3582277641
Ekctrical & Computer Engineering: An International Journal (ECU) VoIume3. Number Z June 2014 Table6. MLODF ofłhe Sanipie 6 Bus System
|
Linę |
I |
2 |
3 |
4 |
5 |
6 |
7 |
8 |
9 |
10 |
11 |
|
1-2 |
-1.3 |
0.5 |
0.6 |
0.0 |
-0.5 |
-0.1 |
-0.1 |
-0.1 |
0.1 |
0.0 |
0.0 |
|
1-4 |
0.8 |
-0.7 |
0.5 |
0.0 |
0.7 |
0.0 |
0.0 |
0.0 |
0.0 |
0.0 |
0.0 |
|
1-5 |
0.5 |
0.3 |
-0.9 |
0.0 |
-0.1 |
0.1 |
0.1 |
0.1 |
0.0 |
0.0 |
0.0 |
|
2-3 |
-0.1 |
0.0 |
0.2 |
-0.1 |
0.2 |
0.1 |
0.3 |
0.1 |
0.3 |
0.0 |
0.0 |
|
2-1 |
-0.7 |
0.6 |
-0.2 |
0.0 |
-1.1 |
0.2 |
0.1 |
0.1 |
0.0 |
-0.1 |
0.0 |
|
2-5 |
-02 |
-0.1 |
0.3 |
0.0 |
0.3 |
-0.6 |
0.2 |
0.2 |
0.0 |
0.0 |
0.0 |
|
2-6 |
-0.1 |
0.0 |
0.2 |
0.1 |
0.2 |
0.2 |
-0.6 |
-0.1 |
0.5 |
0.0 |
0.0 |
|
3-5 |
-0.1 |
0.0 |
0.2 |
0.0 |
0.2 |
0.2 |
-0.1 |
-0.6 |
0.3 |
0.0 |
0.0 |
|
3-6 |
0.0 |
0.0 |
0.0 |
-0.1 |
0.0 |
ox> |
0.4 |
0.3 |
-0.7 |
0.0 |
0.0 |
|
4-5 |
0.0 |
0.0 |
0.3 |
0.0 |
0.2 |
0.1 |
0.1 |
0.1 |
0.0 |
-0.1 |
0.0 |
|
5-6 |
0.1 |
0.0 |
0.1 |
0.0 |
0.0 |
0.0 |
0.2 |
0.1 |
0.3 |
0.0 |
0.0 |
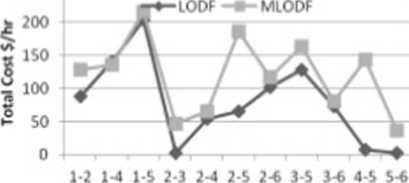
Tablc 7. and Tablc 8. show thc cost allocation to cach generator and load under contingcncy condition duc to LODF and MLODF rcspcctively. Figurę 3. and Figurę 4. show thc total cost allocation to generator and load duc to both distribution factors rcspectivcly. It is elear that thc cost allocation is morę in casc of MLODF in cach linę.
Table 7. Analysis of Cost Allocation to Different Generator*
|
Linę |
Cost Allocated due to LODF ($/hr) |
Cost Allocated due to MLODF <$/hr) | ||||
|
G1 |
<;2 |
03 |
Cl |
02 |
C3 | |
|
1-2 |
87.98 |
0 |
0 |
128.07 |
0 |
0 |
|
I-I |
140.4 |
0 |
0 |
135.66 |
0 |
0 |
|
1-5 |
204.0 |
0 |
0 |
216.30 |
0 |
0 |
|
2-3 |
1.157 |
1.9844 |
0 |
17.197 |
29.481 |
0 |
|
2-1 |
20.17 |
34.663 |
0 |
24.021 |
41.262 |
0 |
|
2-5 |
23.96 |
41.164 |
0 |
68.485 |
117.623 |
0 |
|
2-6 |
.37.32 |
64.100 |
0 |
43.1X57 |
73.938 |
0 |
|
3-5 |
2.263 |
3.9286 |
122.51 |
2.8868 |
5.0094 |
156.2 |
|
.3-6 |
1.285 |
2.2031 |
69.366 |
1.4306 |
2.4526 |
77.22 |
|
4-5 |
5.954 |
2.2727 |
0 |
103.9 |
39.66.3 |
0 |
|
5-6 |
1.9173 |
0.501748 |
0.7884 |
22.109 |
5.7856 |
9.0917 |
|
Total |
526.53 |
150.820 |
192.67 |
763.14 |
315.217 |
242.53 |
250

Lines
Figurę 3. Total cost allocation to generator due to LODF and MLODF
35
Wyszukiwarka
Podobne podstrony:
Ekctrical & Computer Engineering: An International Journal (ECU) Volume3. Number i June 2014 P l
Ekctrical & Computer Engineenng: An International Journal (ECU) Yolume3. Number Z June 2014 The
Electrical & Computer Engineering: An International Journal (ECIJ) Volume 3, Number 2, June 2014
Electrical & Computer Engineering: An International Journal (ECIJ) Volume 3, Number 2, June 2014
Electrical & Computer Engineering: An International Journal (ECIJ) Volume 3, Number 2, June 2014
Electrical & Computer Engineering: An International Journal (ECIJ) Volume 3, Number 2, June 2014
Electrical & Computer Engineering: An International Journal (ECIJ) Volume 3, Number 2, June 2014
Electrical & Computer Engineering: An International Journal (ECIJ) Yolume 3, Number 2, June 2014
Electrical & Computer Engineering: An International Journal (ECIJ) Yolume 3, Number 2, June 2014
Electrical & Computer Engineering: An International Journal (ECIJ) Yolume 3, Number 2, June 2014
Electrical & Computer Engineering: An International Journal (ECU) Yolume 4. Nuinber 2. June
Electrical & Computer Engineering: An International Journal (ECIJ) Volume 3, Number 2, June 2014
Electrical & Computer Engineering: An International Journal (ECIJ) Yolume 3, Number 2, June 2014
Electrical & Computer Engineering: An International Journal (ECIJ) Volume4. Number 3. September
Elcctrical & Computer Emaneering; An International Journal <ECU) Vohime 2. Number 1. Nlarch 2
Elcctrical & Computer Enginccring: An International Journal t ECU) Volumc 3. Numbcr 2. Junc 2014
Electrical & Computer Engineering: Au International Journal (ECIJ) Yolume 3. Numbcr 2. June 2014
Efcctrical & Computer Engincering: An International Journal (ECU) Volume4. N umbcr 3. Septcmber
Ekctrical & Computer Eng ince ring: An International Journal < ECU) Volume4. N untber 3. Sept
więcej podobnych podstron