
Masson,
1
PEDESTRIAN INJURY MECHANISMS & CRITERIA
A COUPLED EXPERIMENTAL AND FINITE ELEMENT APPROACH
Catherine Masson
Pierre-Jean Arnoux
Christian Brunet
Laboratory of Applied Biomechanics. French National Institute for Transport and Safety Research-Faculty of
Medicine of Marseille, Marseille, France
Dominique Cesari
Scientific Direction. French National Institute for Transport and Safety Research. Bron, France
Paper number 05-0335
ABSTRACT
In pedestrian injury biomechanics, knees and
lower legs are highly recruited, leading to joint
damage and bones failures. Safety improvements
should mainly focus on knee ligaments injury
minimization. To investigate the corresponding
injury mechanisms and postulate on injury criteria
risk, both experimental and finite element
simulation approaches were performed. The lower
limb behavior was first studied in lateral bending
and then in lateral shearing impact tests in order to
isolate injury mechanisms effects. The tests
consisted in evaluating lower limb forces and
kinematic through a 37kg guided impact with
velocities ranged between 15 & 20kph. 35 tests
were performed on isolated PMHS lower limbs.
Response corridors for the time history about the
mean response curve ± one standard deviation with
the Maltese procedure were established. The
observed damages were contact injuries (head of
fibula and lateral tibial condyle fractures), ligament
injuries (cruciates and collaterals ligaments
according to the tests) and bone fractures (extra and
diaphysis). These experimental tests were simulated
using a finite element model of the lower limb
(with extended impact velocities). The model
response analysis (bone Von Mises stress levels,
Ligaments global and local strain levels, knee
rotation and shearing measurements) was
performed during each step of the impact
chronology. It leads to postulate on injury criteria
for knee soft tissues based on the knee ultimate
lateral bending (~16°) and shearing levels
(~15mm). These approaches by coupling PMHS
experimentation and numerical simulation ensure
an accurate description of pedestrian lower limb
trauma in terms of injury chronology and threshold.
These results were also relevant with accidentology
and clinical knowledge, especially with the
evaluated potential injuries.
INTRODUCTION
Although the number of pedestrian suffering
severe or fatal injuries has decreased since 1991 in
EU (Kallina, 2002), pedestrian safety has become a
major issue of society and is one of the most
discussed topics in vehicle safety. If pedestrian
sustain multisystem injuries, head and lower
extremities injuries are the most frequently injured
body regions. Particularly, lower limbs are highly
loaded during crash situations (AIS from 2 to 6)
with joints damages and bones failures (IHRA
2001, Stutts 1999). To improve understanding of
the mechanisms and establishing tolerance criteria
for this specific body part, coupled experimental
and numerical studies were conducted.
Experimental studies were performed to
represent condition of pedestrian accident focusing
on the lower limb. The tests should have reflected
the nature and the severity of the injuries sustained
from this kind of impact. There is little data
available from experimental studies measuring the
response of the human knee joint in the pedestrian
environment. Aekbote et al (Aekbote, 2003)
reviewed the biomechanical studies conducted over
the last three decades. He noted that mainly the
injury mechanisms of the lower extremity were
investigated. Tests were conducted in pure lateral
shear loads, in pure bending moments or a
combination of lateral shearing and bending of the
knee (Kajzer 1990, Kajzer 1993, Grzegorz 2001).
On cadavers full leg experiments, Kajzer (1990,
1993) focused on lower limb response under
shearing and bending solicitation. He showed that
pure shearing induces collateral tibial and anterior
cruciate ligaments failure while a primarily bending
mainly induces medial collateral ligament failure.
More generally, three primary injury mechanisms
were underlined: acceleration of the leg induced
contact injuries as fracture of the femur and/or tibial
shaft, shear force through the knee joint led to ACL
rupture/avulsion, tibial intercondylar eminence
fracture and femoral cartilage injury, and injuries
due to bending moment at the knee joint are
compression fracture of lateral femur condyle, tibial
plateau fracture and MCL rupture.

Masson,
2
These last years, recent studies have reported
the response of the isolated knee joint to bending
and shearing forces (Kerrigan, 2003). These tests
aimed to investigate into the failure thresholds of
the lower extremity. In bending tests, femoral and
tibia ends were held. In this experimental
configuration, MCL injuries were the most
common. In shearing tests, damage to the ACL was
the only relevant ligamentous injury. More recently,
Bose (2004) performed 3-point bending tests on
isolated knee joints in order to obtain a combination
of shearing and bending effects, and confirmed
injuries to medial collateral and anterior cruciate
ligaments. It can be noted that knee injuries are not
restricted to the injuries described above. Tibia
fractures (especially with at the tibial eminence in
contact with the intercondylar notch at impact),
PCL injuries, fibula and femur fractures can also be
observed. From all these studies, it appears that the
main challenge for improving leg protection should
focus on knee ligament damage and failure
minimization.
Much of the most recent researches on
pedestrian injury using PMHS has solely focused
on sustained injuries. They reported in details bone
and ligament injuries, proposed injury criteria and
gave only typical load or accelerometric responses
of the lower limb. These data are not always
sufficient to assure a satisfactory validation of the
model (Bhalla, 2003; Kerrigan, 2003; Bose, 2004;
Ivarsson, 2004; Ivarsson, 2005). Very few
presented response corridors to impact though they
are useful to validate pedestrian surrogate models
for biofidelity against PMHS test data. That why
we decided to re-analyse the results of previous
studies performed in Inrets-LBA (Kajzer, 1990,
1993) and to establish force-versus time corridors
for bending and shearing tests.
In order to more accurately describe the injury
mechanisms involved in such trauma situations,
finite element simulations are more and more useful
as they can provide data unavailable
experimentally. In the literature, many finite
element models have been designed to study very
specific points of the leg behaviour under crash
situations. Some ankle-foot models focused on the
kinematics (Beaugonin, 1996; Beillas, 1999), others
on material properties (Beaugonin, 1997; Tannous,
1996) and others else on an accurate description of
geometry (Beillas, 1999). Knee models were also
developed both for frontal impacts (Hayashi, 1996;
Atkinson, 1998) and pedestrians (Yang, 1997;
Schuster, 2000; Takahashi, 2003). Lastly, Bedewi
(1996) included mathematical joints in order to
control the kinematics of a full lower limb model.
The THUMS model (Chawla, 2004) or the LLMS
model (Arnoux, 2001-2004; Beillas, 2001) are
advanced finite element models of the whole lower
limb. This last model was based on an accurate
description of all anatomical parts of the lower
limb, and its validation was performed in various
impact situations (isolated materials, sub-segments
up to the whole model). It has been used to
complete experimental results analysis by focussing
on ligaments strain levels as a function of lateral
shearing or flexion according to the load cases with
an extended range of velocity.
EXPERIMENTAL STUDY
Material and methods
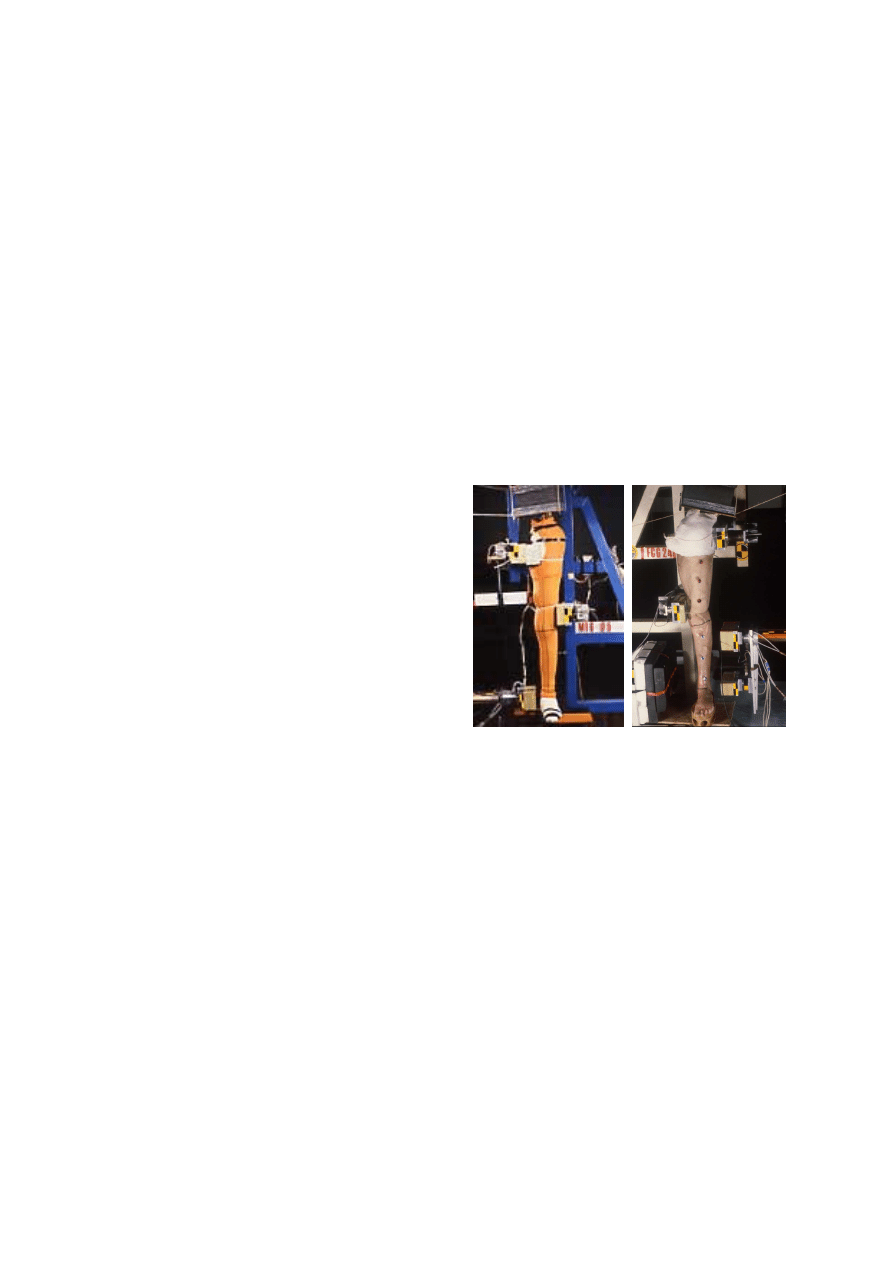
A linear impactor rig was used to perform
dynamic PMHS tests, Figure 1. The cylinder had a
mass of 37kg including instrumentation. The
contact area was a flat piece with 50 mm Styrodur
padding surface.
Impact experiments were conducted on 34 pairs
of human lower limbs. The subjects are Post
Mortem Human Subjects (PMHS) who have given
voluntary before dying their body to the science.
The cadaver specimens are from a population with
considerably advanced age. Haut (Haut, 1995)
reported that cadaver age is not significant predictor
of impact biomechanics or injury to the human
knee. All subjects were preserved at 3°C in
Winkler’s preparation (Winkler, 1974). These
injection methods allow to keep supple the
sampling and to preserve for several months the
soft tissues elasticity. The joint range of
physiological mobility was checked by medical
team. Measurements of valgus-varus and knee
laxity were performed. X-Rays radiographs of the
body were taken and the osseous integrity in 2
planes (sagittal plane and frontal plane) was
checked by an anatomist surgeon. The subjects
chosen were with an average age of 78±8 years,
average weight of 66±11kg, and average height of
161±21cm. Anthropometric details of the subjects
are reported in Table 1. These values are both large
as compared to the 50
th
percentile male dummy
specifications of 1.73m in height and 74.5 kg in
weight.
Table 1.
Cadaver Physical data.
Age Weight
(kg)
Height
(cm)
Limb Weight
(kg)
Bending tests at
4.4m/s
76±6 70±8 166±4
14.4±1.9
Bending tests at
5.5m/s
75±11 60±5 168±7
13.2±1.4
Shearing tests at
4.2m/s
79±6 62±9 167±10 12.1±1.9
Shearing tests at
5.5m/s
79±8 71±16 162±6
12.8±2.2
Masson,
3
The experiment consisted in lateral impacting
an isolated lower limb (leg-thigh-half pelvis) stood
up straight. The thigh was blocked with 2 foam-
padded plates, called the “upper plate” and the
“lower plate”. One was placed on the external face
at femoral condyle level, about 2 cm below the
knee joint line. The second was placed on the
internal face at pubic bone level. The foot was on a
mobile plate to minimize ground friction and a
mass of 40kg allowed preloading the lower limb
(Figure 1).
Bending impacts were performed by loading the
leg just above the ankle joint. The impactor was
equipped with a foam-padded face of 50mm of
Styrodur and 150mm×50mm of size. Distance
between the knee joint line and impactor axis on the
one hand and between the knee joint line and the
lower plate on the other hand were recorded before
test. The impact tests were performed at two impact
velocities: 4.4m/s (MFG01-MFG06) and 5.5m/s
(MFG07-MFG15).
Shearing tests were performed by loading the
leg with 2 impact plates fixed on the impactor, one
loading the leg at the proximal end of tibia and head
of fibula named the “upper impact face”, and one
loading the leg just above the ankle joint and named
the “lower impact face”. Distance between the
lower plate and the upper impact interface was
chosen to be 40mm. A minimize contact injuries,
two foam-padded interfaces were fixed on the
plates (50mm of Styrodur). These impact tests were
performed at two impact velocities: 4.2m/s
(FCG06-FCG15) and 5.5m/s (FCG17-FCG26).
Instrumentation and measurement
An accelerometer (Entran EGA, 250g) and a
force transducer (SEDEME 20kN) equipped the
face of the impactor in bending tests. They
measured the impactor acceleration and the
impactor force presented Figures 2-3. The lower
reaction force was given by a force transducer fixed
on the lower plate (SEDEME, 20kN).
In shearing tests lower impact forces were
measured with a force transducer fixed to the lower
impact face and presented Figures 7-8. The upper
impact face was equipped with an accelerometer
(Entran EGA, 250g) and a force transducer
(SEDEME 20kN). The measurements of the upper
impact force were given in Figures 9-10. A force
transducer equipped the lower plate and recorded
the femur reaction force presented Figure 11-12.
A unit, comprising 32 measurement channels
ensured the conditioning, analog-digital conversion
and memorisation of signal. All the channels were
sampled at 10kHz for a duration of 5 sec. The data
acquisition system was triggered by a contact plate
on the impactor connecting with two contacts on
the knee. Data was transferred to a computer for
processing. Loads were collected and filtered at
180Hz. Two high-speed cameras operating at 1000
frames per second were used to provide a visual
record of the tests and to allow a cinematic analysis.
The locations of all high-speed cameras were
measured with respect to the impact location.
Test Matrix
A total of 35 tests were performed on knee
joints from PMHS. In pure bending, all tests were
performed from male subjects, six tests at 4.4m/s
and nine tests at 5.5m/s. In shear loading, ten tests
were carried out at 4.2m/s and ten tests at 5.5 m/s.
In order to study repeatability of the test procedure,
tests were performed on matched pairs of knees
from the same subject.
Figure 1. Setup for the bending tests (a) and for
the shearing tests (b)
Corridor construction
There is not a standard methodology to construct
biofidelity corridors around the cadaveric data
despite the fact that the way corridors are derived is
an important issue on which the biofidelity rating
depends. Maltese et al (Maltese, 2002) have
proposed a process for calculating corridors from
test data. The first step was to scale data employing
mass scaling developed by Eppinger (Eppinger,
1984) to normalize the data to a 50
th
percentile male
subject. The scaling variable
λ and the scaled test
parameters with subscript s are expressed in terms
of the initial parameters with subscript i in
following equations.
Scaling variable
3
/
1
)
/
75
(
i
M
=
λ
(1)
Velocity
i
s
V
V
=
(2)
a
b
Masson,
4
Acceleration
λ
/
i
s
A
A
=
(3)
Time
i
s
T
T
×
=
λ
(4)
Force
i
s
F
F
2
λ
=
(5)
Then signals were aligned by time shifting. For
each sensor, one signal was chosen as characteristic
response. The cumulative variance between this
typical signal and each signal was calculated
shifting forward then backward in time by one time
step until a minimum variance (Equation 6). The
calculation of cumulative variance continued until
the signal was shifted in time by an amount equal to
one-third of this duration in both directions
2
2
1
,
)
(
i
t
t
i
k
s
k
s
V
−
=
∑
(6)
where
i
s
is the magnitude of the typical signal s at t=i
i
k
is the magnitude of the signal k at t=i
After time alignment, the mean response and the
standard deviation was calculated at each time. To
finish, mean ± one standard deviation corridors
were developed. Straight lines were constructed
around the mean from the defined requirements
.
Experimental results
Results from bending tests
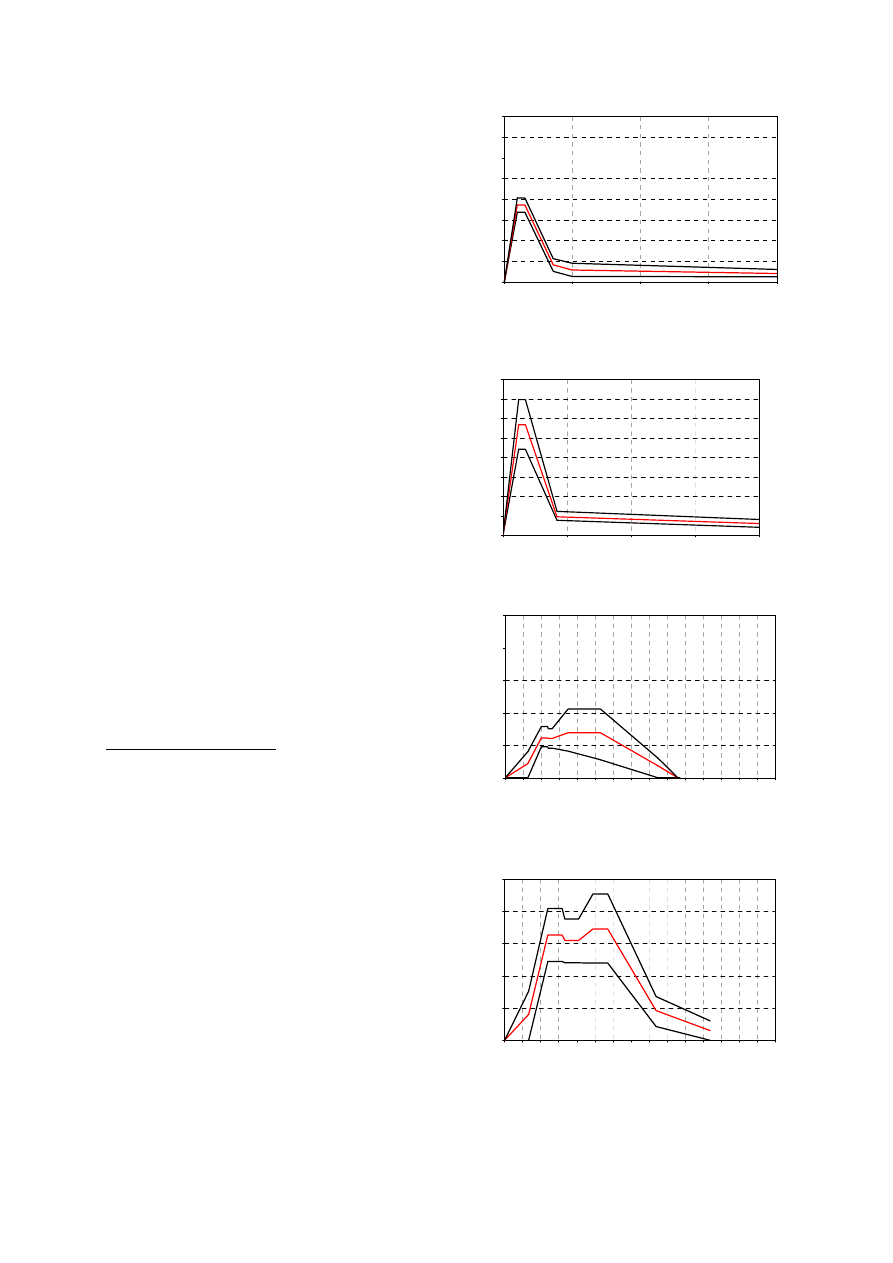
The impact force versus time corridors for the
two impact velocities are presented Figures 2-3.
The corridors mean shape is similar in both cases,
with a linear increasing phase slightly greater at
5.5m/s. The mean peak force is 1860N at 4.4m/s
and 2850N at 5.5m/s with a greater standard
deviation. The duration of solicitation is
comparable for both impact velocities, with a same
increasing slope.
The lower reaction force corridors is plotted as a
function of time for both impact velocities in
Figures 4-5. The corridors show similar trends in
both cases, with a first linear phase during 20ms
following by a local peak. This first mean local
peak is 615N at 4.4m/s and 1628N at 5.5m/s. A
second peak is noticed around 50ms, slightly
greater: 693 N at 4.4m/s and 1728 N at 5.5m/s.
0
500
1000
1500
2000
2500
3000
3500
4000
0
10
20
30
40
cumulative variance calculated
IMPACTOR FORCE
Fo
rc
e
(
N
)
t (ms)
impact velocity : 4,4m/s
Figure 2. Impactor force corridors in bending
tests at 4.4m/s.
0
500
1000
1500
2000
2500
3000
3500
4000
0
10
20
30
40
cumulative variance calculated
IMPACTOR FORCE
F
o
rce
(N
)
t (ms)
impact velocity : 5.5m/s
Figure 3. Impactor force corridors in bending
tests at 5.5m/s.
0
500
1000
1500
2000
2500
0
10
20
30
40
50
60
70
80
90
100 110
120 130
140
150
LOWER REACTION FORCE
t (ms)
Fo
rc
e
(
N
)
impact velocity : 4.4 m/s
Figure 4. Lower reaction force corridors in
bending tests at 4.4m/s
0
500
1000
1500
2000
2500
0
10
20
30
40
50
60
70
80
90
100
110
120
130
140
150
LOWER REACTION FORCE
t (ms)
F
o
rc
e
(N)
impact velocity : 5.5 m/s
Figure 5. Lower reaction force corridors in
bending tests at 5.5m/s.
Masson,
5
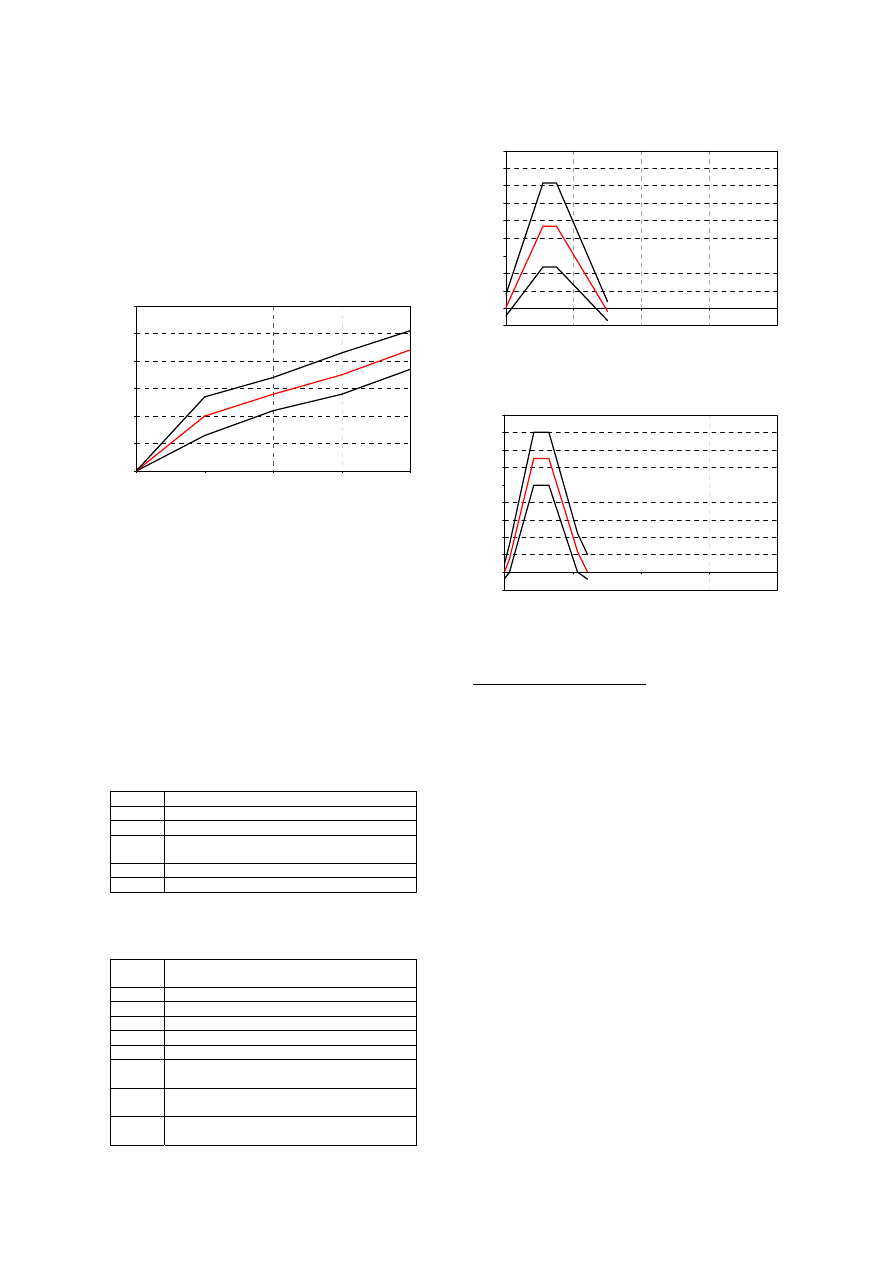
A cinematic analysis was performed. The high
speed images analysis provided the position at each
ms. From the relative displacement of the leg
against the thigh in frontal view, the lateral flexion
angle of the knee was calculated (Figure 6). No
significant difference appeared between 4.4m/s and
5.5m/s. It is estimated that the knee bending rate in
the bending tests is approximately 1°/ms up to
13ms then is 0.5
o
/ms.
0
5
10
15
20
25
30
0
10
20
30
40
LATERAL KNEE FLEXION ANGLE
K
nee
f
lex
io
n
an
gl
e
(°
)
t(ms)
Figure 6. Knee flexion angle versus time
After testing, radiographs were taken and pre-
and post-radiographs were analysed and compared.
Each lower limb was then autopsied.
Tables 2 and 3 list the injuries for both series of
test. Bone damage was seldom observed, only in
two tests at 5.5m/s. In contrary ligament damage
was observed in 70% of tests and the medial
collateral ligament was always injured. The
posterior cruciate ligament was never injured and
damage were observed on the anterior cruciate
ligament in 3 tests at 5.5m/s
Table 2.
Injuries caused in bending tests at 4.4m/s.
MFG01
MCL: avulsion at the femoral insertion
MFG02
MCL: avulsion at the femoral insertion (80%)
MFG03
MCL avulsion at the femoral insertion
MFG04
LCL : rupture (80%) in the ligament
MCL : avulsion (30%) at the femoral insertion
MFG05 None
MFG06 None
Table 3.
Injuries caused in bending tests at 5.5m/s.
MFG07
LCL : partial avulsion at the femoral insertion
ACL : partial avulsion at the tibial insertion
MFG08 None
MFG09
MCL: avulsion at the tibial insertion
MFG10 Tibial
plate
fracture
MFG11 None
MFG12
MCL: total avulsion at the femoral insertion
MFG13
MCL : avulsion at the femoral insertion
Tibial plate fracture
MFG14
MCL: avulsion at the femoral insertion
ACL: avulsion at the femoral insertion
MFG15
MCL: total avulsion at the femoral insertion
ACL: avulsion at the femoral insertion
-200
0
200
400
600
800
1000
1200
1400
1600
1800
0
10
20
30
40
cumulative variance
LOWER IMPACT FORCE
t (ms)
Fo
rc
e
(
N
)
Impact velocity : 4.2m/s
Figure 7. Lower impact force corridors in
shearing tests at 4.2m/s.
-200
0
200
400
600
800
1000
1200
1400
1600
1800
0
10
20
30
40
Cumulative variance calculated
LOWER IMPACT FORCE
t (ms)
Fo
rc
e
(N
)
Impact velocity : 5.5 m/s
Figure 8. Lower impact force corridors in
shearing tests at 5.5m/s.
Results from shearing tests
Lower impact force versus time corridors for the
two impact velocities are presented Figures 7-8.
The mean peak force is 935N at 4.2m/s and 1300N
at 5.5m/s. The increasing phase is stiffer at 5.5m/s
with a slope of 300N/ms against 170N/ms at
4.2m/s. The impact forces peak at 5.5 ms for the
lower impact velocity, at 4.3ms for the second
velocity and then drop to 0 by 14.8ms and 16.2ms
respectively.
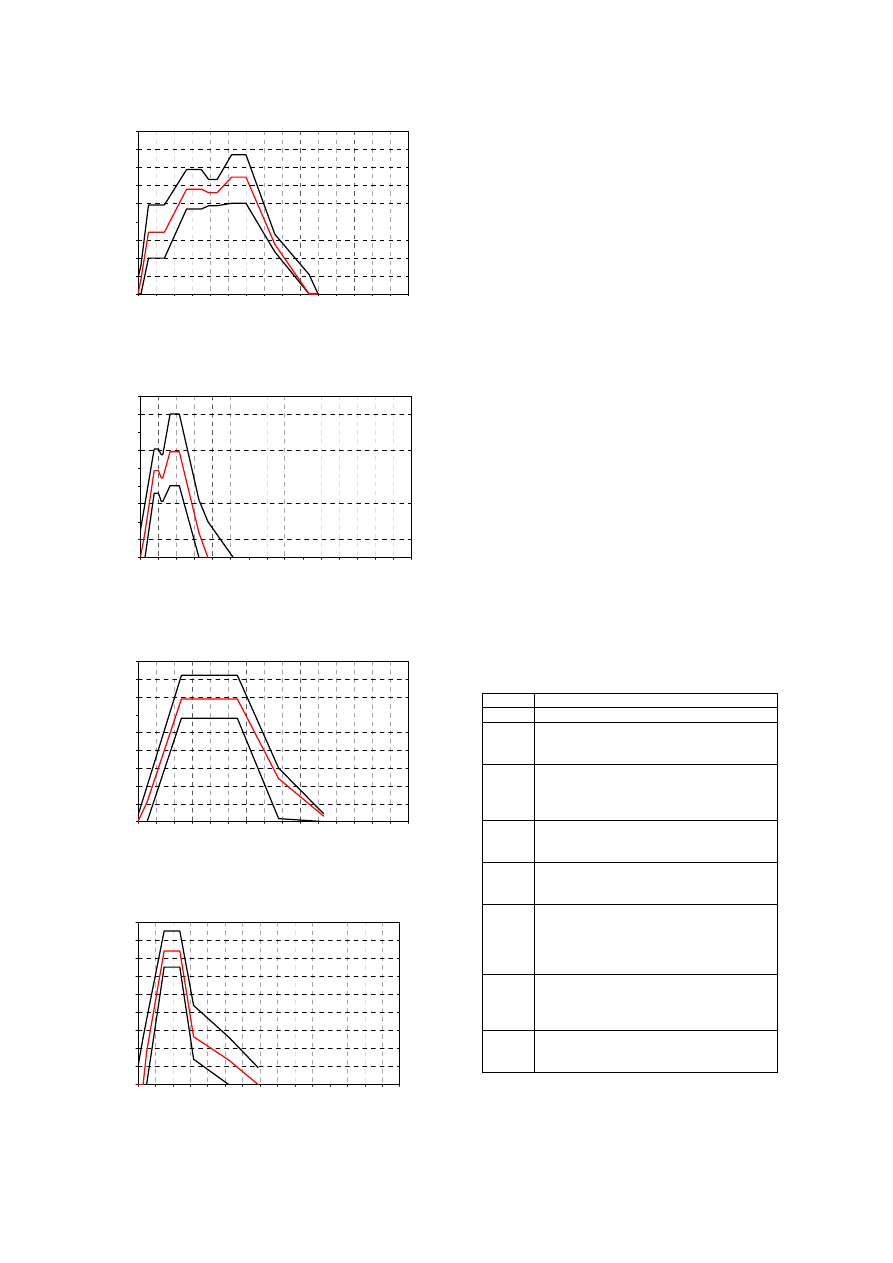
Figures 9-10 show upper impact force versus
time corridors for both impact velocities. Three
peaks are noted at 4.2m/s against only two peaks at
5.5m/s with a decreasing of the force occurring
much later (60ms) than for the lowest impact
velocity. If the values of the first peak differ
according impact velocity (1708N and respectively
2421N), peak values on all duration are
approximately the same (3000N) but appear at
different times (20ms and 60ms).
Femur reaction force versus time corridors for
both impact velocities are presented Figure 11-12.
The corridor at 4.2m/s is very larger in time. The
peak values are similar in both cases with
nevertheless a slope in the increasing phase greater
at 5.5m/s than at 4.2m/s (143N/ms and 306N/ms).
Masson,
6
0
500
1000
1500
2000
2500
3000
3500
4000
4500
0
10
20
30
40
50
60
70
80
90
100
110
120
130
140
150
UPPER IMPACT FORCE
t (ms)
Fo
rc
e
(N
)
cumulative variance calculated
Impact velocity : 4.2m/s
Figure 9. Upper impact force corridors in
shearing tests at 4.2m/s.
0
500
1000
1500
2000
2500
3000
3500
4000
4500
0
10
20
30
40
50
60
70
80
90
100
110
120
130
140
150
Cumulative variance calculated
UPPER IMPACT FORCE
t (ms)
Fo
rc
e
(N
)
Impact velocity : 5.5 m/s
Figure 10. Upper impact force corridors in
shearing tests at 5.5m/s.
0
500
1000
1500
2000
2500
3000
3500
4000
4500
0
10
20
30
40
50
60
70
80
90
100
110
120
130
140
150
FEMUR REACTION FORCE
t (ms)
Fo
rc
e
(N
)
Impact velocity :4.2m/s
Figure 11. Femur reaction force corridors in
shearing tests at 4.2m/s.
0
500
1000
1500
2000
2500
3000
3500
4000
4500
0
10
20
30
40
50
60
70
80
90
100
110
120
130 140
150
Cumulative variance calculated
FEMUR REACTION FORCE
Fo
rc
e
(N
)
Impact velocity : 5.5m/s
t (ms)
Figure 12. Femur reaction force corridors in
shearing tests at 5.5m/s.
After testing, radiographs were taken and pre-
and post-radiographs were analysed and compared.
Each lower limb was then autopsied. Injuries are
listed in Tables 4-5 and concern as well knee
ligaments as lower limb bones. At 4.2m/s,
concerning ligament, there were no injuries to any
of the posterior cruciate ligament and only one
injury to medial collateral ligament. The anterior
cruciate ligament was the most often injured (in
seven tests) with in six tests injury of lateral
collateral ligament. Bone injuries were mainly
fracture of fibula (75% of tests) and fracture of the
tibial intercondylar eminence associated with
femoral cartilage injury. There were no fractures to
femoral diaphysis and one to tibial diaphysis. Only
one knee showed no signs of fracture or any
ligamentous injury. At 5.5m/s, ligament injuries
were mainly anterior cruciate ligament injuries
(seven tests). There were no injuries to any of the
posterior cruciate ligament and few lateral ligament
injuries (in 2 tests for the medial collateral and in 2
cases for the lateral collateral). Concerning bone
injuries, in all cases, a fracture of the fibula was
noted. We noted proportionally less tibial
intercondylar eminence fracture but more tibia
condyle fracture.
Table 4.
Injuries caused in shearing tests at 4.2m/s.
FCG06 None
FCG07
MCL: avulsion at the tibia insertion
FCG08
ACL avulsion at the tibia insertion,
tibial intercondylar eminence crushing,
femoral cartilage
FCG09
LCL : avulsion at the fibula insertion,
ACL: avulsion at the tibial insertion
Fracture of the lateral tibia plate
Avulsion of tibial intercondylar eminence
FCG10
LCL : avulsion at the fibula insertion
ACL: avulsion at the tibial insertion
Avulsion of tibial intercondylar eminence
FCG11
LCL : avulsion at the fibula insertion
ACL: peeling
Crushing of the tibial intercondylar eminence
FCG12
LCL : avulsion at the fibula insertion
ACL: peeling and partial avulsion at the tibial
insertion
Fracture of the fibula
Crushing of the tibial intercondylar eminence
FCG13 LCL:
rupture
ACL: rupture at the tibial insertion
Fracture of the tibia
Fracture of femoral condyles
FCG14 LCL
:damage
ACL : avulsion (70%) at the tibial insertion
Fracture of the fibula neck
Masson,
7
Table 5.
Injuries caused in shearing tests at 5.5m/s.
FCG17
Fracture of the femoral diaphysis
Fracture of the medial malleolus
Fracture of the fibula (proximal end)
ACL: Partial rupture (80%)
FCG18
ACL : Avulsion at the tibial insertion
Fracture of the fibula diaphysis
Fracture of the fibula (proximal end)
Fracture of the tibia (proximal end)
FCG19
ACL : Avulsion at the tibial insertion
Fracture of the fibula (proximal end)
Fracture of tibial intercondylar eminence
Fracture of tibial spinal tuberosity
FCG20
Crushing fracture of the medial femoral
condyle
Fracture of tibial intercondylar eminence
Fracture of tibial spinal tuberosity
Tibial cartilage injury
Fracture of the fibula neck
ACL: partial (80%) avulsion at the tibial
insertion
MCL: partial rupture
FCG21
Fracture of the femoral diaphysis
Fracture of tibial intercondylar eminence
Fracture of the fibula neck
ACL: partial (80%) avulsion at the femoral
insertion
FCG22
Fracture of the fibula (proximal end)
MCL: partial rupture
ACL: partial (80%) avulsion at the femoral
insertion
FCG23
Fracture of the tibial diaphysis
Fracture of the fibula neck
FCG24
Fracture of the fibula (proximal end)
LCL: avulsion at the fibula insertion
FCG25
Fracture of tibial intercondylar eminence
Fracture of the fibula diaphysis
Fracture of the fibula (proximal end)
ACL: avulsion at the tibial insertion
FCG26
Fracture of the fibula (proximal end)
LCL : avulsion at the fibula insertion
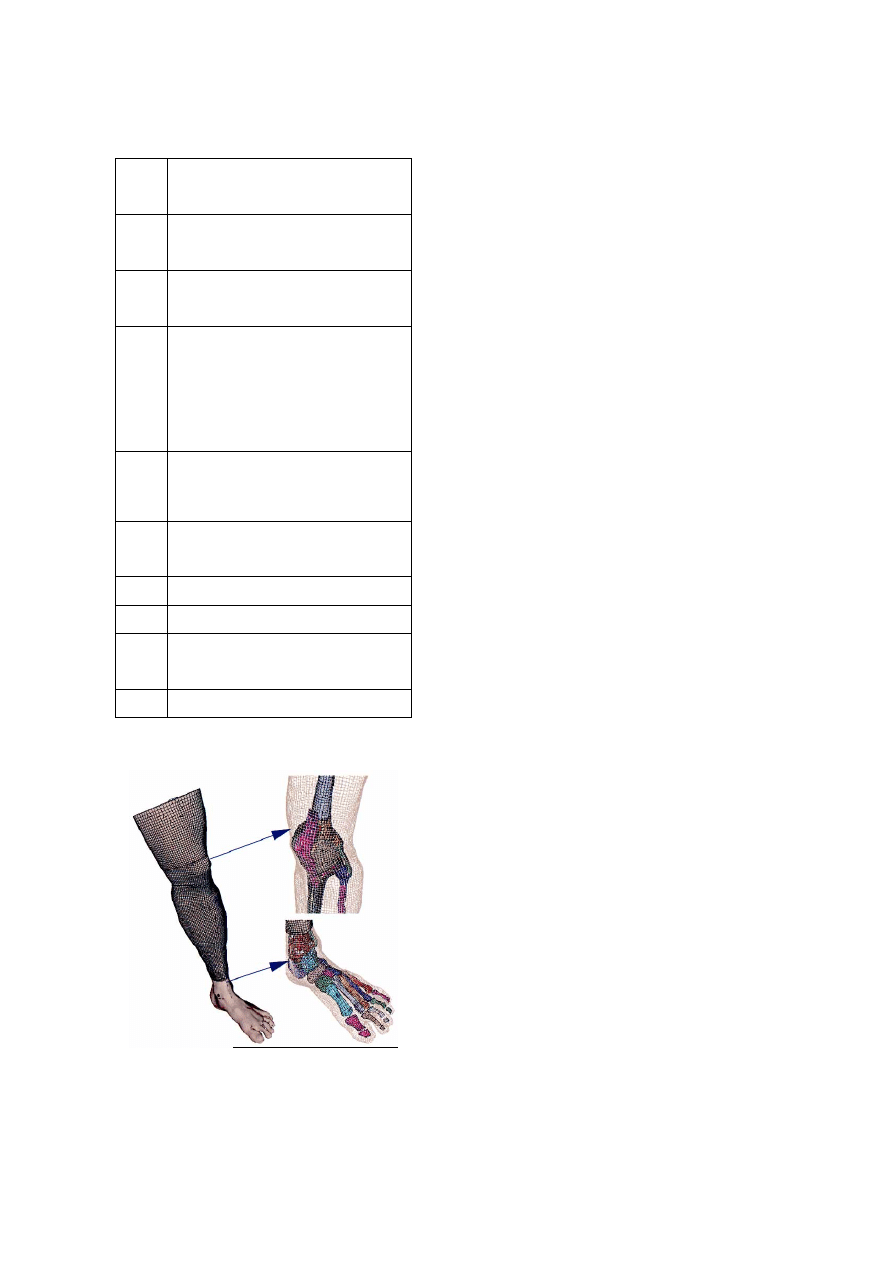
Figure 13. General overview of the Lower Limb
Model for Safety (LLMS).
NUMERICAL STUDY
To complete the analysis of experimental
results, a finite elements model of the lower limb
(the Lower Limb Model for Safety) was used
(Figure 13). As this model (validation, applications,
model features) has already been presented in
previously published papers (Arnoux 2001- 2004,
Behr 2003- 2005, Beillas 2001), we only focus here
on the use of this model to determine injury criteria
assumption on the base of pedestrian related impact
situations performed during experiments. In a first
step model response was evaluated by comparison
between simulation and reanalysis of experimental
results performed in this work. Then, an analysis of
model kinematics, bones Von Mises and lastly soft
tissues strain levels was performed (Arnoux 2004)
in order to postulate on injury assumptions
Model comparison with experiments
In Kajzer (1990) bending tests (Figure14) the
upper leg was allowed to freely translate in the
vertical direction, while a 22 kg dead weight was
attached to the proximal femur to simulate the
weight of the body. The foot was placed on a plate
which allowed free translation along the direction
of impact. A 40 kg impactor was used to load the
distal tibia with impact velocities of 16 and 20 Kph.
The model validation was achieved by comparing
forces versus time recorded on the impactor face
and lateral flexion by analysis of high speed video
data regarding model response through new
experimental corridors defined above. Results
reported were relevant with experiments. Note that
time amplitude was higher than experiment
especially concerning unloading phase. This could
be linked to soft tissue behaviour laws where
physical failure was not implemented in the model.
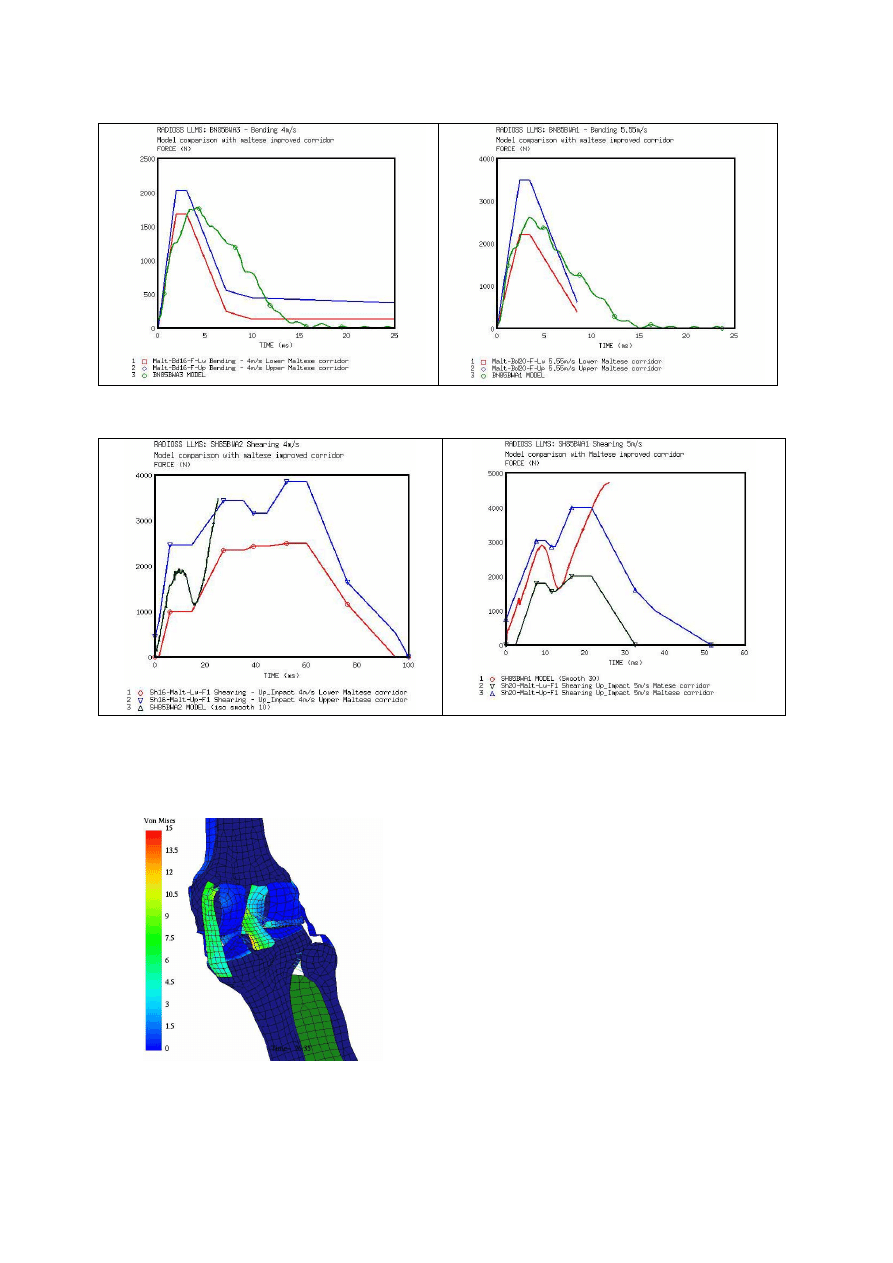
In Kajzer (1993) shearing tests (Figure15), the
leg was put in same conditions as the previous test.
The impactor consists in two impacting surfaces
applied simultaneously on both proximal and distal
extremities of fibula and tibia. Model response was
relevant with experimental corridors but do not
describe complete time duration of the test. The
two-stage injury mechanism experimentally
identified, with the two peaks in the force time
curve, was not reproduced with the LLMS model.
The first injury mechanism, which occurred in 10
th
ms after impact, is directly related to the knee
impact force. It can be described as a contact injury
and can induce bone fractures (head of fibula, tibia
or femur). This phenomenon was relevant with Von
Mises stress level recorded between tibia and fibula
(Figure 16).
Masson,
8
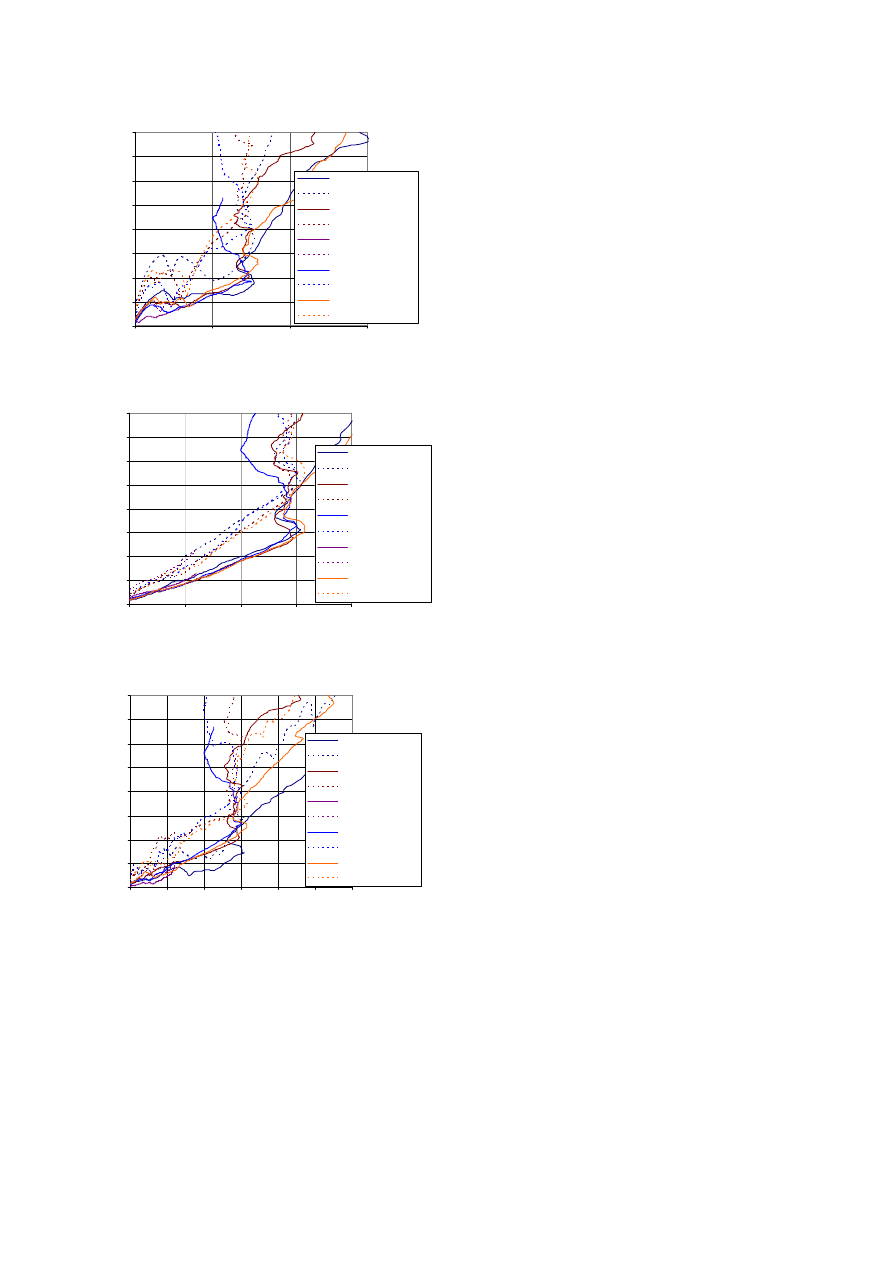
Figure 14. Comparison between simulated model and experiments of impact forces in bending tests for 16
and 20 kph impact velocities.
Figure 15. Comparison between simulated model and experiments of impact forces in shearing tests for 16
and 20 kph impacts velocities.
Figure 16. Illustration of Von Mises stress level
in joints and recruitment level of knee ligaments.
Injury criteria evaluation
The second injury mechanism is correlated to
forces transferred through the knee during
acceleration of the thigh (relative shearing of tibia
versus femur) which lead to soft tissues injuries.
This could be linked to soft tissue behaviour laws
where physical failure was not implemented in the
model. Consequently, the model analysis was
bounded to first part of the tests until the strain
failure level on ligaments were reach. Additionally,
the locations of stress concentrations predicted by
the model, including the cruciate ligament
insertions, the tibia eminence and the tibia fibular
joint, were in agreement with the injury locations
found during the autopsies (Figure 17).
Masson,
9
Injury criteria evaluation
Taking care to the validity domain, loading
cases can be extended and, from model analysis, it
remains possible to compute data that is not usually
recordable experimentally:
- The stress level and distribution in bones provide
an estimation of damage on bone structures when
stress reaches the Yield stress values.
- The kinematics was recorded to check the correct
relative movements between the corresponding
bones or soft tissues through knee torsion, lateral
bending and frontal bending in the different planes
and for each test. Therefore, the lateral relative
displacement between the tibial eminence and the
intercondylar notch was calculated to accurately
identify knee lateral shearing at the joint level.
- Damage properties of soft tissues can be described
in terms of ultimate strain levels in soft tissue
structures (Arnoux 2000, Subit 2004). The results
led to consider ligament failure with a strain
criterion. Ultimate strain levels were calculated for
the four knee ligaments and used in this study to
identify potential failure. Note that literature gives
various values for ultimate strain (Table 6) obtained
in different experimental conditions (loading,
preconditioning, conservation method…). In the
present study, the ultimate values used to postulate
on damage were assumed to be 28% for lateral
ligaments, and 22% for cruciate ligaments. For each
of the four knee ligaments, strain sensors were
inserted in the model. These sensors consist in a
series of springs along the main fiber axis. For the
cruciate and lateral ligaments, it was also possible
to compute the global strain level, the average strain
level as well as the curve of maximum strain
recorded at various levels in the ligament. A first
step in the investigation knee joint injury criteria
was to focus on previous experiments with
extended impact velocities which are 2 m/s, 4 m/s,
5.55 m/s, 7 m/s and 10 m/s.
Table 6.
Overview of ultimate strain levels recorded for
knee ligaments.
Author Collateral
tibial
Collateral
medial
Posterior
cruciate
Anterior
cruciate
Viidick
(1973)
30% 40% 60% 60%
Kennedy
(1976)
24 (±6) %
Marinozzi
(1982)
20 (±5) %
Prietto
(1992)
28 (±9) %
Race
(1994)
18
(±5)
Arnoux
(2000)
24-38% 22-38% 15-23% 18-24%
Kerrigan
(2003)
7-10% 11-20%
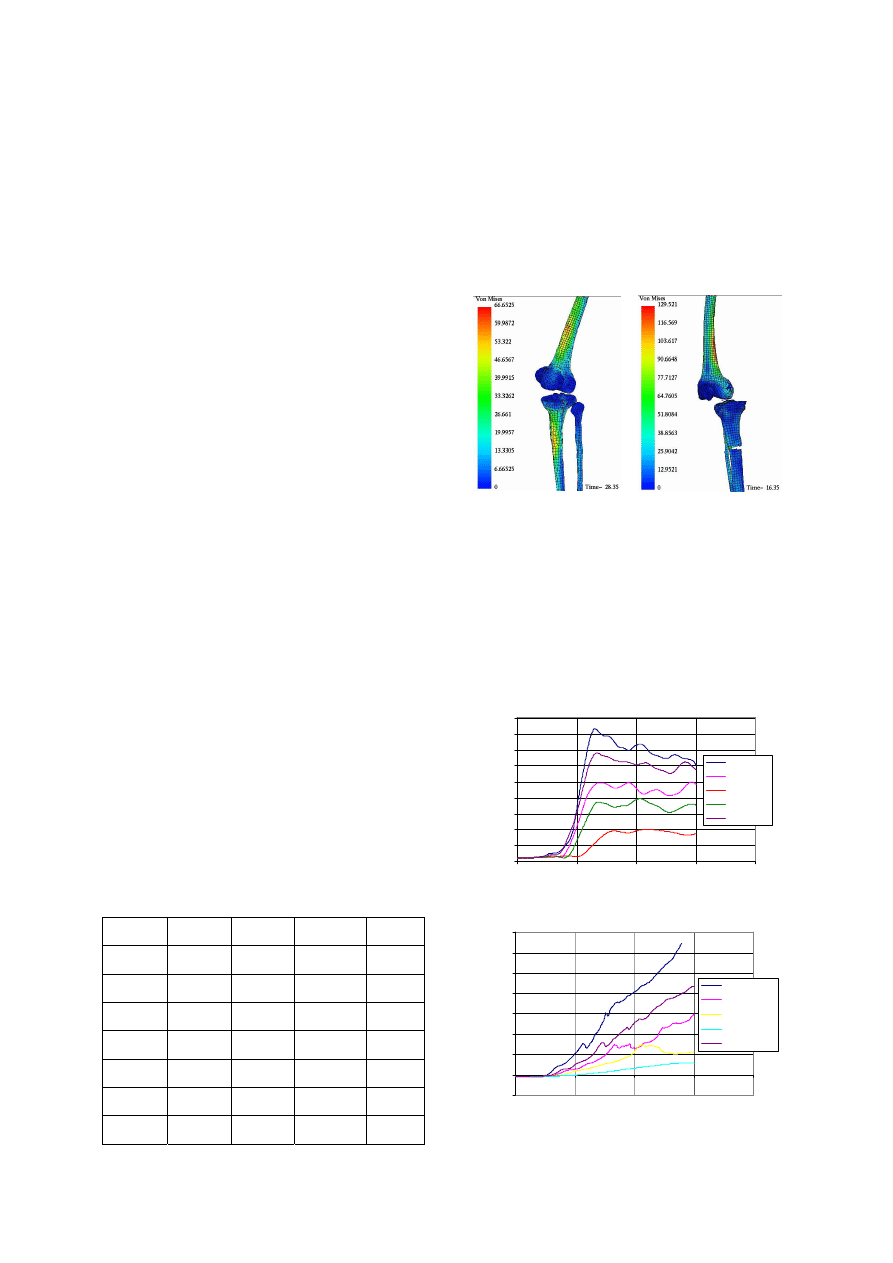
For both impact situations, the Von Mises stress
levels on bones were located on the proximal tibial
metaphysis and distal femoral metaphysis (Figure
17). With impact velocity upper than 7m/s Von
Mises stress reach 120-130MPa which is closed to
failure. Bone failure on shell element was obtained
by deleting elements once ultimate strain is reach.
Note that model stress distribution and failure
location were relevant with experiments (with
lower impact velocities).
Figure 17. Typical Von Mises stress on bones for
bending and shearing impact.
Model kinematics in bending tests exhibit
typical lateral rotation between the tibia and the
femur which seems to be correlated with velocity.
The frontal rotation is stable whereas torsion effect
seems to be important and correlated to the impact
velocity (Figures 18 and 19). Variations of angles
reach values ranging from 2° to 8°, depending on
the impact velocity.
8
9
10
11
12
13
14
15
16
17
0
10
20
30
40
T ime (ms)
R
o
ta
tio
n
(
°)
T rs-V10
T rs Rot -V5
T rs-V2
T rs-V4
T rs-V7
Figure 18. Knee torsion in the bending test.
-10
0
10
20
30
40
50
60
70
0
10
20
30
40
T ime (ms)
S
h
ear
in
g
(
m
m
)
Shearing-V10
Shearing-V5
Shearing-V4
Shearing-V2
Shearing-V7
Figure 19. Knee lateral shearing in the shearing
test.
Masson,
10
In shearing tests, the two main kinematics
aspects are the lateral shearing and the knee torsion
(Figure 19). The lateral shearing seems to be
correlated with velocity and rapidly reaches high
values which are not relevant with geometrical
characteristics of the proximal tibia and distal
femur. At 15mm of shearing the curves reach a
steady state which could result from the contact
between intercondylar notch and tibia eminence. In
the first 15 ms, the knee torsion reaches amplitudes
ranging from 2° to 10° depending on the impact
velocity (Figure 20).
For both impact situation rotation effects have
to be linked to the asymmetrical geometry of the
femoral condyle and the tibial glena. From a
medical point of view, this torsion effect is
described as a natural safety countermeasure of the
human body during trauma situations in order to
avoid (or limit) damage to ligaments.
The strain level recorded on each ligament
(cruciate and lateral) and correlated to rotation or
shearing effects were computed in total strain curve
on the whole ligament and the maximum strain
curve of local maximum strain level (Arnoux
2004). In this model analysis, the maximum strain
can be considered as a first sensor to locate damage
in the structure whereas the total strain gives a
global overview of the whole structure. If the
maximum strain reaches the ultimate strain level,
we assume that damage can occur in the ligament.
Moreover, if the ultimate strain level is reached on
the total strain curve, the ligament complete failure
can be postulated with a high probability.
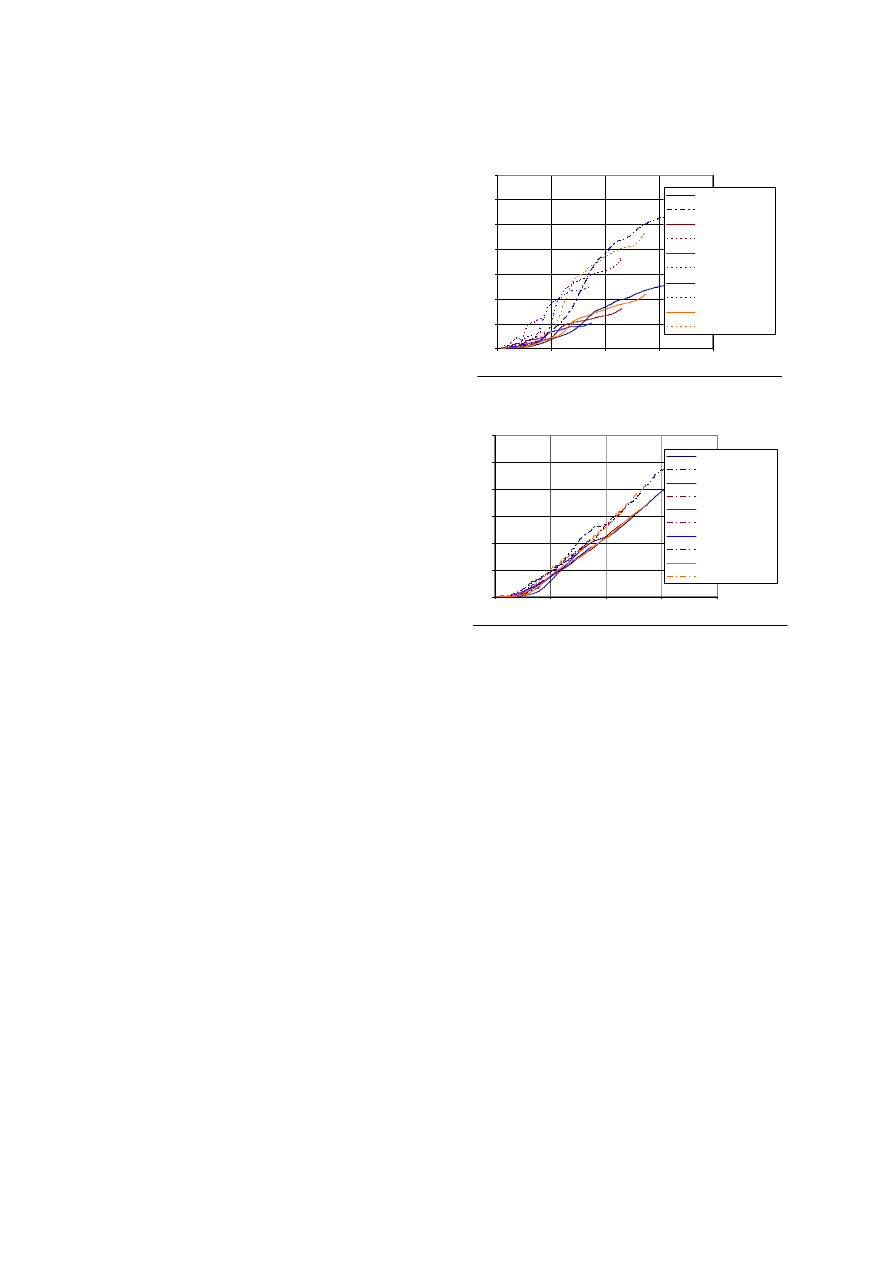
For lateral bending tests, the lateral medial and
the posterior cruciate ligaments were highly loaded
and strain versus lateral bending seems to be
independent of impact velocity (Figure 20). A small
difference between maximum strain level and total
strain level seems to show that the medial collateral
ligament in the model has homogeneous strain
distribution. Its maximum strain or total strain level
used to postulate on damage in the ligaments is
obtained with a lateral rotation ranging from 20 ° to
24 °. For the posterior cruciate ligament, the
difference between global strain (maximum strain)
and local strain (maximum strain) seems to
confirmed local high strain levels. They were
obtained on ligaments insertion and illustrated with
Von Mises curve processing. Local damage could
occur for knee rotation between 12 ° and 15 °,
whereas global damage for knee lateral rotations
was close to 26 ° (which seems to be very high).
Posterior cruciate ligament: Strain/lateral rotation
0
0,1
0,2
0,3
0,4
0,5
0,6
0,7
0
10
20
30
40
Lateral rotation (°)
St
ra
in
Total strain-V10
Maximum strain-V10
Total strain-V5
Maximum strain-V5
Total strain-V2
Maximum strain-V2
Total strain-V4
Maximum strain-V4
Total strain-V7
Maximum strain-V7
Colateral medial ligament: Strain/lateral rotation
0
0,1
0,2
0,3
0,4
0,5
0,6
0
10
20
30
40
Lateral rotation (°)
St
ra
in
Total strain-V10
Maximum strain-V10
Total strain-V5
Maximum strain-V5
Total strain-V2
Maximum strain-V2
Total strain-V4
Maximum strain-V4
Total strain-V7
Maximum strain-V7
Figure 20. Posterior cruciate ligament total and
maximum strain curves versus lateral rotation.
Collateral medial ligament total and maximum
strain curves versus lateral rotation.
For the shearing tests, the two cruciate and the
tibial collateral ligaments were highly loaded
(Figure 21). In that situation, impact velocity had
no effects on strain versus knee shearing curves.
The failure or damage could start at a 13 to 15 mm
knee shearing. For the posterior cruciate ligament,
the strain being not homogeneous on the structure,
only maximum strain levels were computed, and
they show that damage could occur for shear values
ranging from 12 to 14 mm. Finally, for the
collateral tibial ligament, the maximum strain
reaches up to 14-17mm according to the impact
velocity.
Masson,
11
Posterior cruciate ligament: Strain/Shear
0
0,05
0,1
0,15
0,2
0,25
0,3
0,35
0,4
0
10
20
30
Shear (mm)
St
ra
in
Total strain-V10
Maximum strain-V10
Total strain-V5
Maximum strain-V5
Total strain-V2
Maximum strain-V2
Total strain-V4
Maximum strain-V4
Total strain-V7
Maximum strain-V7
Anterior cruciate ligament: Strain/Shearing
0
0,05
0,1
0,15
0,2
0,25
0,3
0,35
0,4
0
5
10
15
20
Shearing (mm)
Str
a
in
Total strain-V10
Maximum strain-V10
Total strain-V5
Maximum strain-V5
Total strain-V4
Maximum strain-V4
Total strain-V2
Maximum strain-V2
Total strain-V7
Maximum strain-V7
Colateral tibial ligament: Strain/Shearing
0
0,05
0,1
0,15
0,2
0,25
0,3
0,35
0,4
0
5
10
15
20
25
30
Shearing (mm)
St
ra
in
Total strain-V10
Maximum strain-V10
Total strain-V5
Maximum strain-V5
Total strain-V2
Maximum strain-V2
Total strain-V4
Maximum strain-V4
Total strain-V7
Maximum strain-V7
Figure 21. Total and maximum strain curves
versus lateral shearing for the posterior cruciate
ligament, the anterior cruciate ligament and the
collateral tibial ligament.
DISCUSSION -CONCLUSION
Four test series were presented with the objective to
evaluate the response of the lower limb to bending
or shearing force. Impact tests were performed on
isolated lower extremities of Post Mortem Human
Subjects and biomechanical corridors have been
proposed.
In bending tests, the differences between lower
reaction force corridors for both impact velocities
were only in magnitude, the rise time and the
duration were equivalent. The first lower reaction
force peak appears between 20 and 23 ms
corresponding to a knee lateral flexion angle of 15-
16°. Damage to the MCL was the most common
joint damage induced in this test configuration; this
is agreement with real word pedestrian accident
injuries (Bhalla, 2003). Two fractures of the tibial
plateau were noted for a 5.5m/s impact velocity
(MFG10-MFG13). These damages could be
induced by a greater valgus rotation of the knee at
this speed causing a compression force on the tibial
plateau. A vertical rotation of the lower limb was
noted in all tests and is due to the no symmetric of
the knee joint. The influence of this movement on
the global response of the knee joint and the
type/time of injury is unknown but may induce
tensional forces in the knee joint ligaments.
In shearing experimental test, the upper impact
load induced firstly bone injuries located near
impact point as fracture of fibula head, lateral tibial
condyles fractures or diaphysis fracture. These
injuries could be tied to the first peak force,
corresponding to a mean level of 1700N for an
impact velocity of 4.2m/s and 2400N for an impact
velocity of 5.5m/s. The following peaks are related
to intra articular injuries as avulsion or rupture of
the anterior cruciate ligament, and femoral cartilage
injury. Note that tibial intercondylar eminence
fractures were typical due to the shear force through
the knee joint. In our tests, they were always
associated with ACL damage.
Coupling such results with model analysis
which allowed to record data unavailable
experimentally and then to follow their evolution
during the test, it was possible to complete injury
mechanisms description and make correlation
between peak in force and failure level reach on
ligaments.
For the bending tests, the knee injury
mechanism consisted in a lateral rotation around the
contact area between the lateral femoral condyle the
and tibial glena. This rotation simultaneously
induces a high deflection of both anterior cruciate
and medial collateral ligaments, assumed to be
injured for rotations over 15 and 20 °respectively.
These results were not sensitive to impact
velocities, and seem to be relevant with those
identified experimentally. Consequently, a
conservative value of 15° for lateral rotation can be
considered as ligaments injury criteria. For pure
shearing impacts, the anterior, posterior cruciate

Masson,
12
and tibial collateral ligaments were concerned. The
ultimate shearing level was computed by recording
the distance between the tibial eminence and the
condylar notch that reached up to 13 to 15 mm
whatever the impact velocity. Consequently, a
conservative value of 13mm for shearing rotation
can be considered as ligaments injury criteria.
The criteria postulated above were strongly
dependant on the material properties. Model
improvement with tissues a damage model as well
as a parametric study around the failure criteria
should be performed in order not to summarize the
injury criteria to a single couple of value (lateral
rotation and shearing) but also to define injury risk
curves.
The strain versus time curves show the
influence of impact velocity and the time dependent
answer of the whole structure which could be
mainly attributed to structure effects and also soft
tissue viscoelastic properties. It also underlines the
differences in strain distribution between cruciate
and collateral ligaments. For the cruciate ligaments,
high strain levels were recorded on ligaments
insertions (in agreement with experimental results),
that underlines failure properties of cruciate
ligaments at their insertions.
Von Mises distribution was systematically
located on the same metaphysis areas of the lower
femur and upper tibia but also in the knee joint with
contact area during shocks. This distribution could
indicate a bending effect on the two bones. It was
also observed that for impact velocities overs
10m/s, and according to the damping properties of
the impacting surface, the failure risk for bones
seems to be very high. Therefore, with numerical
simulations, it was observed that even in pure
loading, pure shearing or pure bending can not be
obtained alone. The two mechanisms seem to be
coupled with a majority of shearing or bending
according to the loading conditions.
In perspective, new tests will be performed on
suitably instrumented PMHS with objective to
compare the effects of varying proportions of
moment and shear applied at the knee joint. Further
numerical simulations will be done in order to
widen model capabilities by focussing on material
properties and to improve injury criteria accuracy.
The new experimental tests will be included in
model validation process.
ACKNOWLEDGEMENT
We would like to thank MECALOG for their
partnership in LLMS model designing.
REFERENCES
Aekbote K., Schuster P., Kankanala S.,
Sundararajan S., Rouhana W. 2003. “The
biomechanical aspects of pedestrian protection“.
Int. J. Vehicle Design, Vol. 32. 28-52
Arnoux P.J. 2000. « Modélisation des ligaments des
membres porteurs », Ph D. Thesis.
Arnoux P.J., Kang H.S., Kayvantash K., Brunet C.,
Cavallero C., Beillas P., Yang H. 2001. “The
Radioss Lower Limb Model for safety: application
to lateral impacts”, International Radioss user
Conference. Sophia
Arnoux P.J., Kang H. S., Kayvantash K. 2001. “The
Radioss Human model for Safety”, Archives of
Physiology and Biochemistry, vol. 109, 109.
Arnoux P.J., Cavallero C., Chabrand P., Brunet C.
2002. “Knee ligaments failure under dynamic
loadings”. International Journal of Crashworthiness,
Vol 7 (3), 255 – 268.
Arnoux P. J., Thollon L., Kayvantash K., Behr M.,
Cavallero C., Brunet C. 2002. “Advanced lower
limb model with Radioss, application to frontal and
lateral impact Radios lower limb model for safety”.
Proceedings of the IRCOBI Conference.
Arnoux P. J., Cesari D., Behr M., Thollon L.,
Brunet C. 2004. “Pedestrian lower limb injury
criteria evaluation a finite element approach”, under
submission to Traffic Injury Prevention Journal.
Atkinson P., A stress based damage criterion to
predict articular joint injury from subfracture insult,
Ph.D. thesis, 1998.
Atkinson P.J., Haut R., Eusebi C., Maripudi V., Hill
T., Sambatur K. 1998. “Development of injury
criteria for human surrogates to address current
trends in knee-to-instrument panel injury”, Stapp
Car Crash Conference Proceedings. 13-28.
Beaugonin M., Haug E., Cesari D. 1996. “A
numerical model of the human ankle/foot under
impact loading in inversion and eversion”, 40th
Stapp Car Crash Conference Proceedings.
Beaugonin M., Haug E., Cesari D. 1997.
“Improvement of numerical ankle/foot model:
modeling of deformable bone”, 41th Stapp Car
Crash Conference Proc.
Bedewi P.G., Bedewi N.E. 1996. “Modelling of
occupant biomechanics with emphasis on the
analysis of lower extremities injuries”. International
Journal of Crash, Vol. (1). 50-72.

Masson,
13
Behr M., Arnoux P. J., Serre T., Bidal S., Kang
H.S., Thollon L., Cavallero C., Kayvantash K.,
Brunet C. 2003. “A Human model for Road Safety :
From geometrical acquisition to Model Validation
with Radioss”, International Journal on Computer
Methods in Biomechanics and Biomedical
Engineering, vol 6 issue 4.
Behr M., Arnoux P.J., Thollon L., Serre T.,
Cavallero C., Brunet C. 2003. “Towards integration
of muscle tone in lower limbs subjectes to
impacts”, IX International Symposium on
Computer Simulation
in Biomechanics, Sydney,
Australia.
Behr, M., Arnoux, P.J., Serre, T., Kayvantash, K.,
Brunet, C. 2005. “Modeling active muscle behavior
for emergency braking simulations”. Computational
Fluid and Solid Mechanics , Ed. Bathe. 60-64.
Beillas P., Modélisation des membres inférieurs en
situation de choc automobile, Ph.D. thesis, École
Nationale Supérieure d'Arts et Métiers, Paris,
France, 1999
Beillas P., Lavaste F., Nicoloupoulos D.,
Kayventash K., Yang K. H., Robin S. 1999. “Foot
and ankle finite element modeling using CT-scan
data”, Stapp Car Crash Conference Proc.
Beillas P., Arnoux P. J., Brunet C., Begeman P.,
Cavallero C., Yang K., King A., Kang H. S.,
Kayvantash K., Prasad P. 2001. “Lower Limb:
Advanced FE Model and New Experimental Data”,
International Journal of STAPP - ASME, vol. 45,
469-493.
Bhalla K., Bose D., Madeley N.J., Kerrigan J.,
Crandall J., Longhitano D., Takahashi Y. 2003.
“Evaluation of the Response of Mechanical
Pedestrian Knee Joint Impactors in Bending and
Shear Loading”. 18
th
International Conference on
the Enhanced Safety of Vehicles.
Bose D., Bhalla K., Rooij L., Millington S., Studley
A., Crandall J. 2004. “Response of the Knee joint to
the pedestrian impact loading environment”, SAE
World Congress, paper 2004-01-1608.
Chawla A., Mukherjee S., Mohan D., Parihar A..
2004. “Validation of Lower Extremity Model in
THUMS”. IRCOBI Conf. 155-166
Eppinger R, Marcus J., Morgan R. 1984. ‘Develpment
of Dummy and injury index for NHTSA’s Thoracic
side impact protection research program’, SAE 840885,
28
th
Stapp Car Crash Conference, Warrendale, PA.
Grzegorz Teresinski, Roman Madro. 2001. “Pelvis
and hip injuries as a reconstructive factors in car-to-
pedestrian accidents”, Forensic Science
International 124. 68-73.
Haut R. C., Atkinson P. J. 1995. “Insult to the
human cadaver patellofemoral joint : effect of age
on fracture tolerence and occult injury”, 39th Stapp
Car Crash Conference Proc., SAE. 952729.
Hayashi S., Choi H.Y., Levine R.S., Yang K.H.,
King A.I. 1996. “Experimental and analytical study
of knee fracture mechanisms in a frontal knee
impact”, 40th Stapp Car Crash Conf. Proc.161.
IHRA/PS/200. 2001. International Harmonized
Research Activities, Pedestrian Safety Working
Group Report.
Ivarsson J, Lessley D, Kerrigan J, Bhalla K, Bose
D., Crandall J, Kent R. 2004. ”Dynamic Response
Corridors and Injury Thresholds of the Pedestrian
Lower Extremities. IRCOBI Conference on the
Biomechanics of Impacts.
Ivarsson J, Kerrigan J, Lessley D, Drinkwater C,
Kam C, Murphy D, Crandall J, Kent R. 2005.
“Dynamic “Response Corridors of the Human
Thigh and Leg in Non-Midpoint Three-Point
Bending.” Society of Automotive Engineers World
Congress. Paper Number 05B-218.
Kajzer J., Cavallero C., Bonnoit J., Morjane A.,
Ghanouchi S. 1990. “Response of the knee joint in
lateral impact: Effect of shearing loads”. Proc.
IRCOBI. 293-304.
Kajzer J., Cavallero C., Bonnoit J., Morjane A.,
Ghanouchi S. 1993. “Response of the knee joint in
lateral impact: Effect of bending moment.” Proc.
IRCOBI. 105-116.
Kallina I, 2002. “Pedestrian Protection. Looking for
Potentials”. Proc. IRCOBI. 1–15.
Kerrigan J.R., Ivarsson B.J., Bose D., Madeley N.J.,
Millington S.A., Bhalla K. S., Crandall J.R. 2003.
“Rate sensitive constitutive and failure properties of
human collateral knee ligaments”, IRCOBI
conference. 193
Maltese M.R., Eppinger R. H., Rhule H., Donnelly
B., Pintar F. A., Yoganandan N. 2002. “Response
Corridors of Human Surrogates in lateral impacts”.
Stapp Car Crash Journal, vol. 46.
Schuster P.J., Chou C.C., Prasad P., Jayaraman G.
2000. “Development and Validation of a Pedestrian
Lower Limb Non-Linear 3-D Finite Element

Masson,
14
Model”. 44th Stapp Car Crash Conference
Proceedings. Atlanta, 2000-01-SC21.
Stutts J.C., Hunter, W.W. 1999. “Motor vehicle and
roadway factors in pedestrian and bicyclists
injuries: an examination based on emergency
department data”, Accident analysis and prevention.
Volume 31, Issue 5, Pages 505-514.
Subit D.2004. “Modélisation de la liaison os
ligament dans l’articulation du genou”, PhD.
Thesis, Université de la Méditerranée.
Subit D., Chabrand P., Masson C., Brunet C. 2004.
“Modelling of the mechanical behaviour of the
insertion of the ligament to bone in knee joint.”
Congress of European Society of Biomechanics, s’-
Hertogenbosch.
Subit D., Chabrand P., Masson C., Brunet C. 2004
“Behaviour of human knee ligaments : tensile tests
in flexion and extension.” 12th International
Conference On Experimental Mechanics. Bari.
Takahashi Y., Kikuchi, Y., Mori, F., and Konosu,
A., 2003 “Advanced FE Lower Limb Model for
Pedestrians”. 18
th
International Conference on the
Enhanced Safety of Vehicles.
Tannous R.E., Bandak F.A., Toridis T.G., Eppinger
R.H. 1996. “A three-dimensional finite element
model of the human ankle: development and
preliminary application to axial impulsive loading”,
40th Stapp Car Crash Conference Proc., SAE. 219-
238.
Winkler G. 1974. Manuel d'Anatomie
Topographique et Fonctionnelle, 2nd ed. Masson,
Paris.
Yang J. 1997. “Injury Biomechanics in car
pedestrian collisions: development, validation and
application of Human-Body mathematical models”.
Ph.D. thesis.
Wyszukiwarka
Podobne podstrony:
Mechanika techniczna(12)
Mechanika Semest I pytania egz
wykl 8 Mechanizmy
mechanizm mycia i prania
MECHANIKA II DYN
METODY KOMPUTEROWE W MECHANICE 2
08 BIOCHEMIA mechanizmy adaptac mikroor ANG 2id 7389 ppt
Mechanizm obrzęków
Mechanizmy swoistej immunoterapii alergii 3
mechanika kwantowa
Mechanizmy nadwrażliwości
Mechanika górotworu cz 3
Szkol Uszkodzenie ciała przez czynniki mechaniczne
więcej podobnych podstron