
Page 1 of 9
Intraday Open Pivot Setup
The logistics of this plan are relatively simple and take less than two minutes to process
from collection of the previous session’s history data to the order entrance. Once the
orders are placed, this system will run its course and you can check it the next day at
same time you enter your orders for that day if you wish to leave all emotions on the
floor, or you can monitor the position until it closes to tighten loss risk or capitalize on
larger movements. Below is a overview of the logistics of this system. I will go into
detail of how to enter the information and setup your trades in a bit. The summary of
the details of this system are as follows:
Prior to any trading with this system you must decide upon a set up figures
for your limit and stop orders. 20 points each direction seems to be the
most profitable and efficient of the 16 combinations that I tested. This
number can be changed from time to time if you prefer, but I would
suggest against it as a system relies on continuity and consistency.
At your brokerage’s close of business, usually 4:00 or 5:00 PM EST, record
the open, high, low, and close.
Enter these numbers into the pivots calculator(or the inclusive spreadsheet
that accompanies the system) and record the pivot point
Visually compare this pivot with the open price of the previous session
The condition of direction depends upon the first factor; if the pivot is
higher than the previous open, then the potential position will be long. If

Page 2 of 9
the Pivot is less than the previous opening price, the potential position will
be short. I say “potential” in that a second factor must be met.
Once you have established whether a position is acceptable based upon the
criteria above, the second calculation to determine if a trade will occur is as
follows:
If the first calculation results in long potential, then calculate:
Previous High – Previous Open > Profit Goal (Pips) + Spread
(i.e. 1.6682-1.6642 > 0.0020 + .0004) (0.0040 > 0.0024)
The H-O is greater than the Goal + Spread, therefore a long position is
initiated.
If the initial calculation recommends a short, then calculate:
Previous Low – Previous Opening > Profit Goal + Spread
If the L-O is greater than the Goal + Spread, then initiate a short position.
Immediately, upon the open of the new session, place your market order
corresponding to the calculations above; short or long. Set your stop and
limit orders utilizing the profit goal and risk management strategy you
devised earlier and that’s it. You are finished for the day.
The following day, right before the close, you can check to see what
occurred overnight if you have not already looked. Do the calculations
again and enter your order.
Some of these rules and principles may sound confusing. Don’t be alarmed, because
they are for the novice or beginner trader. But not to worry, because you will not have

Page 3 of 9
to calculate or determine any of these things manually. You simply need to enter four
numbers daily, or before each session you wish to trade, and the page does the work for
you. It does most of the thinking for you. You simply need to set up the orders in your
trading platform and walk away, or wait until the price moves in your favour and enter
the market manually.
Although this system is based around the Asian/Sydney markets, as that’s when I
normally trade due to my work schedule, it can be tailored to suit any of the other
markets. There is a bit of a hitch with the other markets, which is that you need to
calculate the open, high, low, and closing figures in a different manner. You should use
the closing time that is similar to the time that you will start trading. For instance, I trade
the Asian session, so I generally begin trading at around 17:30 EST. CMS’s VT uses a
17:00 EST closing/opening time, so that works perfect for me. Other online brokerages
use 15:00 EST, 16:00 EST, 19:00 EST, and so forth. I have seen a website in the past
that would let you calculate these numbers for whatever time of day you would like the
market to be reported as closed. If you wanted the close to be at 2am, then it would
calculate that for you. I haven’t been able to track that site down since I started this
system though unfortunately.
So to summarize this last note, if you would like to trade the NY session, 7:30 EST –
16:00 EST, you should calculate your closing information as of 7:00 EST. This process
requires a bit more time and effort, but it can be done with a little legwork. For the
purpose of example, I will be using the 17:00 EST closing time in my explanation below.
Utilizing Trade Sheet
Step 1:
Gather the data for the previous day from whatever source you decide to
use. I will give the example of the CMS platform, Visual Trader or VT, as that is what I
use and am familiar with. If you decide to use something else that is your prerogative.
In VT, set up your chart with the time frame set at DAY, click the INSPECT button at the

Page 4 of 9
bottom of the chart in the toolbar (red arrow with a blue trend line above it). This will
bring up the inspection box that lists all the data for that time period. Now make sure
your instrument is set to the currency pair you want to trade. Move your cursor to the
far right of the screen until you see the date of the last closed session. For instance, if
today is September 12, you want the date to read 09/12/05 17:00. Record the open,
high, low, and close data. You will enter it into the calculator next. If you are monitoring
more than one pairing, then you can repeat this process for the other pairings.
Step 2:
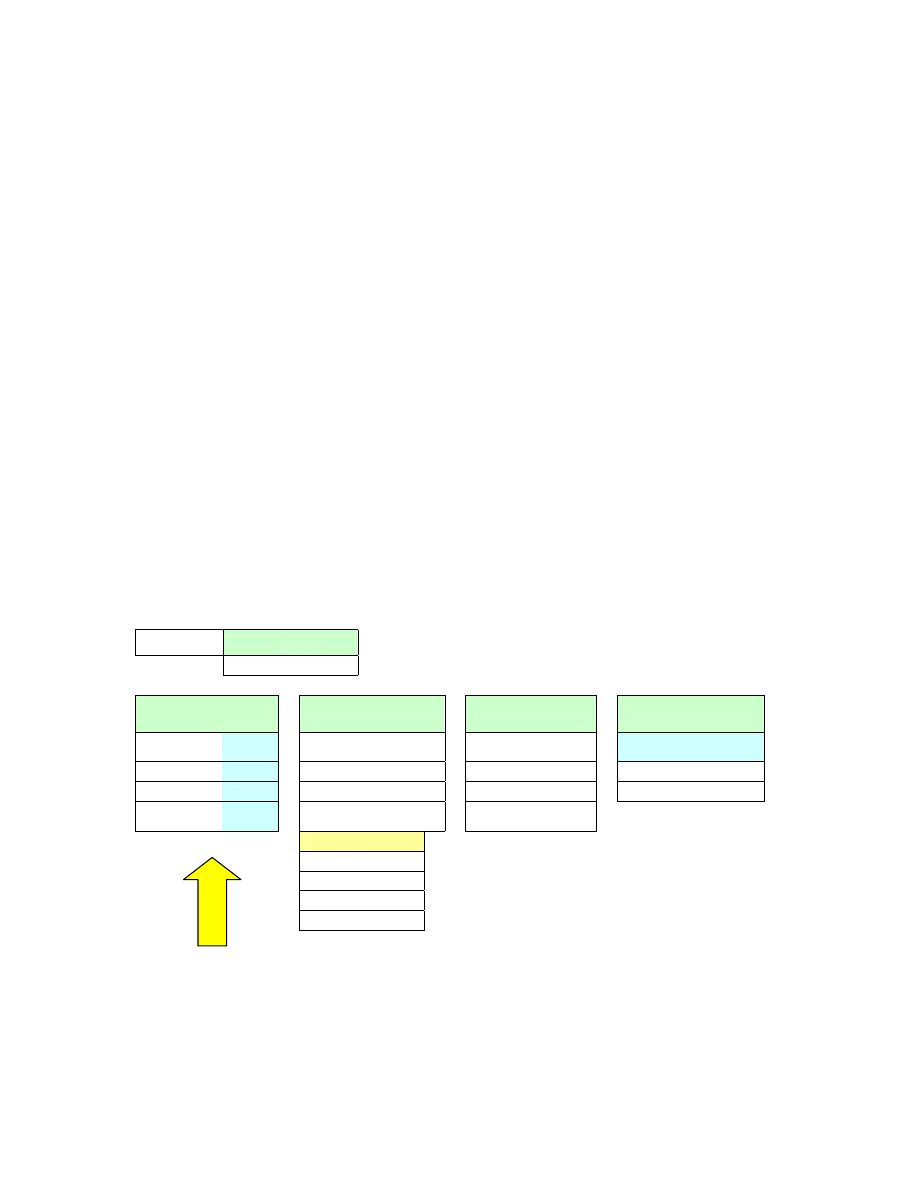
Open the Forex Pivot System Calculator spreadsheet, and select
Trade
Sheet tab at the bottom of the screen. You will need to set up this page the first time
you use it, in order to set each calculation section to the pairing you are monitoring.
Enter the day and date for the session you are forecasting, and enter the data you just
collected previously into the proper areas (see yellow arrow marked #2 below). The
calculator does the rest for you! In the section, labelled 2. Pivot Points, to the left of the
first box, you will see a list of numbers. These are the pivot, support, and resistance
numbers for the coming day. You can research support and resistance levels online if
you are not sure of their meaning or significance. It also plots the midpoints between the
levels for further analysis and use.
The third box to the right, 3. Ranges, lists the trading ranges from the previous day. This
is mainly for calculation and reference purpose. The fourth box to the right, 4. Potential
Trade lists the direction, either long or short, that the market possibly will take based
upon empirical data, and the mathematical algorithm used to calculate the pivots and the
directions. The trade box at the bottom of this section lets you know whether a trade for
that session is visible. It usually lists YES, as generally there is a trade available during
each session. The fifth block to the right, 5. Actual Number, is a space that you can
enter the actual numbers for that day you just forecasted, for comparison reasons.
NOTE OF CAUTION: As the trade sheet estimates the direction of the trade for that
session, this does not necessarily reflect the overall outcome of the entire session or of
Page 5 of 9
the day as a whole. The trade may be long, but the session could close down, or the
whole day close down. It does happen more often than not, so do not be looking to
extend your trade for lengthy period of time. My trades are usually entered by 19:00 EST
and closed by 01:00 EST, with some going as long as 08:00 EST the following morning.
This is set up for intraday.
If you are following more than one pairing, you can repeat this step for the other
pairings.
Now comes the most crucial part of trading; determining entrance and exit. I have
found, through backtesting different scenarios, the best scenario from a profit margin and
efficiency standpoint is the 20 pip limit, 20 pip stop loss. This seems to be the best
combination. You can set it to whatever you are comfortable with, but this is just my
observation.
GBP/USD
Limit
Stop
Monday October 1, 2005
20
-20
1. Previous
Numbers
2. Pivot Points
3. Ranges
4. Potential Trade
Previous
Open
1.7635
R2
1.7713
High-Open
0
Direction
SHORT
Previous High
1.7635
M4
1.7694
Low-Open
117
Range
117
Previous Low
1.7518
R1
1.7674
Range
117
Trade?
YES
Previous
Close
1.7546
M3
1.7635
Close-Open
-89
Pivot
1.7596
M2
1.7577
S1
1.7557
M1
1.7518
S2
1.7479
Step 3:
#2

Page 6 of 9
Now that you have your trade information setup and your direction plotted, you can
move to the charts to look for an entrance point. There are a few ways to approach this.
One way is to utilize the pivot points that the spreadsheet just calculated for you in the
previous step as entrance triggers. You can use any of the support or resistance levels,
or the pivot point for that matter, as entrance points. Using the example below, if the
price is currently 1.7648 and trending up, you are looking for it to pass the first
resistance level, R1 (1.7674). If it tests that mark but does not break through it and
continue rising, you could enter short here and look to close the position at the next
sublevel, that being M3 in this case. You can monitor it and look to reach for the next
major level before closing, that of the pivot point at 1.7596.
The second way to enter into your trade is to simply open the position after doing the
calculator, but this requires that you are not completely leveraged and able to handle a
swing of 50 pips or more, as it does happen sometimes. If you are leveraged at 200:1
and trading 20% of your balance as margin, you cannot and DO NOT want to handle a
100 pip loss! The feeling never gets any easier.
The third way to enter, and the way that I trade, is dependent on which session you
trade. Every session follows a fairly distinct pattern of price movement. This pattern
repeats itself at virtually the same times each and every day to a certain extent. I will
give you the example of the Asian session that I trade here, but if you trade a different
session I suggest you pay close attention to back data, if you don’t already know the
trends, and determine a pattern of movement. If you cannot figure out the pattern you
can email me directly and for a small consulting fee I can research it and plot it for you.
The Asian market begins 19:00 EST, but I begin trading it at 17:00 EST. A distinct
pattern follows this timeline into the session to an almost certainty every day. If my
system says the trade direction is long, then generally after the close of the NY session at
17:00 EST the price will move down about 20 points or so, and then retreat back to the
open price and consolidate for an hour or so before it begins its rise. Sometimes it will
repeat the dip down to the -20 pip from open point and then return to the open again,

Page 7 of 9
but regardless this happens almost every day, and if you can realize this trend and utilize
it you can be very successful. I generally enter when the price is about 15-25 points
below the open in a long trade, and 15-25 points above the open price when the trade is
short. The key is to set up a system to enter and exit, and stick to it consistently, as any
system not only requires but demands consistency and continuity.
Make sure that you are using your regular technical indicators to monitor market activity
and ensure the trade is on target. If you are looking to enter a short and your MACD
says long, or the 30 minute chart is oversold, you are asking for trouble. You need
checks and balances with any system to eliminate as much of the margin of error as
possible.
My personal setup employs a 20 pip stop and limit on my trades. When I first opened my
live account I was anxious and was seeking 30 pips on every trade which is a bit of a
stretch on a daily basis. I did well with the 30 pip limit, but was very lucky on quite a
number of trades where it only went 3 or 4 pips above my limit before retreating. The
limits you decide to use ultimately depend on you and your trading style, and nerves.
The system seems to work the best on the GBPUSD pairing. I have back-tested it over
the past three years using historical data from Capital Market Services (
). Using the 20/20 money management levels, it achieved an 83.17% rate of
accuracy, which is extremely efficient. If you were to drop it to 15 or 10 points/position,
you would achieve a slightly greater efficiency rating, but the profit potential on the
20/20 far outweighs the few extra percentage points. Set up your risk level to what you
are comfortable with. I generally trade 1 mini-lot (10K) at 0.5%, or 200:1, leverage, per
$250US of balance in my account. For instance, if your balance is $1500, then
1500/250=6, so 6 10K mini lots, or 0.6 standard 100K lots, would be positioned. This is
high by most standards, but it allows you to have 5 devastating trades in a row before
you are drained of funds. The level of risk that you wish to run with is entirely your

Page 8 of 9
decision. You can use the handy risk management sheet with this package to help you
manage your risk/reward information. And remember, allowing your balance to
compound is the ONLY way to achieve financial success at an accelerated pace through
exchange trading. If you allow it to build and multiply, it will grow faster than you can
imagine. If you look at the year 2003, after 1 month following my system, having begun
with $250US it would have accumulated approximately $630US, 3 months $1770US, 6
months $41,550US, and after one year $7.59 million US, providing you had kept the
lot/balance ratio consistent. If you capped it at, say, 1000 mini-lots maximum per trade,
it would have been about a 1/3 of that amount. It may seem like it is crawling along for
the first few months, but imagine a snowball rolling downhill! And 2004 was even better
than 2003, with a 10% increase in efficiency over 2003.
Well, good luck with the system and remember, I do not promise any results; this is
strictly hypothetical, but all information is based on actual data backtested as well as my
live trading experience in the past year, so the numbers are not misleading by any
standard. My personal live accounts have experienced solid growth as well, averaging
629 pips per month to date. If you have any questions about the system that you cannot
find the answers for in this manual feel free to email me at the address below. And if
you require the consult on the session trends, or for other items, I’d be happy to help you
out. Happy trading and I wish you the best of luck.
Sincerely,
Jeff Reimer
P.S.:
Within the spreadsheet you will find a few other valuable resources, namely the risk
management sheet, the trading log, and a statement for your record keeping or in case you happen
to be managing someone else’s fund. They are all relatively easy to use, and I have left a line of
data in each page for you to see how the information is to be entered for the sheets to work
properly.

Page 9 of 9
P.P.S: Remember that with any financial investment, risk is involved. We do not accept any
responsibility for any losses incurred on your part or the part of your trading associates/partners
with or without the use of this system. We will not be held liable for the actions or inactions of
you or those around you. This system is designed as a supplementary tool to the market and other
technical indicators. The market is an extremely volatile space in time. It is ever changing, and
we all need to heed its way. Respect the market, and it will reward you…usually! Good luck and
Godspeed.
Wyszukiwarka
Podobne podstrony:
Intraday Pivot Based System
FESTO Podstawy automatyzacji
Automatyka (wyk 3i4) Przel zawory reg
Automatyzacja w KiC (w 2) Obiekty reg
AutomatykaII 18
Automatyka wykład 8
System open source NauDoc (1)
Wybrane elementy automatyki instalacyjnej
12 Podstawy automatyki Układy sterowania logicznego
Automatyka dynamiakPAOo 2
Automatyka okrętowa – praca kontrolna 2
get open&r7 prn
open
automatyczne swiatla
podstawy automatyki ćwiczenia lista nr 4b
AUTOMATYZACJA PROCESÓW SPAWALNICZYCH
Podstawy automatyki cz1
więcej podobnych podstron