
Protein structure determination using a database
of interatomic distance probabilities
MICHAEL E. WALL,
1
SHANKAR SUBRAMANIAM,
2,3
and GEORGE N. PHILLIPS, JR.
1
1
Department of Biochemistry and Cell Biology and Keck Center for Computational Biology, Rice University,
Houston, Texas 77005-1892
2
Departments of Biochemistry, Molecular and Integrative Physiology and Chemical Engineering,
Beckman Institute for Advanced Science and Technology and National Center for Supercomputing Applications,
University of Illinois, Urbana–Champaign, Urbana, Illinois 61801
~Received May 24, 1999; Accepted September 30, 1999!
Abstract
The accelerated pace of genomic sequencing has increased the demand for structural models of gene products. Improved
quantitative methods are needed to study the many systems
~e.g., macromolecular assemblies! for which data are scarce.
Here, we describe a new molecular dynamics method for protein structure determination and molecular modeling. An
energy function, or database potential, is derived from distributions of interatomic distances obtained from a database
of known structures. X-ray crystal structures are refined by molecular dynamics with the new energy function replacing
the Van der Waals potential. Compared to standard methods, this method improved the atomic positions, interatomic
distances, and side-chain dihedral angles of structures randomized to mimic the early stages of refinement. The greatest
enhancement in side-chain placement was observed for groups that are characteristically buried. More accurate calcu-
lated model phases will follow from improved interatomic distances. Details usually seen only in high-resolution
refinements were improved, as is shown by an R-factor analysis. The improvements were greatest when refinements
were carried out using X-ray data truncated at 3.5 Å. The database potential should therefore be a valuable tool for
determining X-ray structures, especially when only low-resolution data are available.
Keywords: knowledge-based
modeling;
low-resolution;
molecular
dynamics;
structure
refinement;
X-ray
crystallography
Genomic sequencing efforts are far outpacing our understanding
how gene products
~i.e., RNA and proteins! give rise to the char-
acteristics of living things. The more than 8,500 currently known
protein structures ought to be a rich resource for solving this prob-
lem. For example, bond distances and angles obtained from known
small-molecule structures commonly are used to generate geomet-
rical restraints in solving new X-ray and NMR structures
~Hen-
drickson & Konnert, 1980; Engh & Huber, 1991
!. Much of what
protein databases “know” about protein structure, however, re-
mains hidden when the data are viewed in this limited way.
Methods for determining X-ray and NMR structures are well
understood, and procedures have become largely automated. Many
problems still exist, however, in obtaining structures using limited
data. This is especially true when the atomic coordinates are un-
derdetermined by the data alone, such as happens for poorly dif-
fracting crystals of molecular complexes. In these cases, prior
information about molecular structure must be used to obtain a
useful model.
In the limit where no experimental data are available, there is an
exclusive reliance on prior information, and the problem becomes
an even more difficult one of molecular modeling. Homology mod-
eling has brought significant developments
~Browne et al., 1969;
Blundell et al., 1987; Jones & Thornton, 1996; Sanchez & Sali,
1997
!, but use of this method requires that the structure of a
molecule with high sequence homology be determined
~this fact
motivates the structural genomics initiatives reviewed in Terwill-
iger et al., 1998
!. Another limitation to homology modeling is that
the same sequence is capable of adopting different structures de-
pending on tertiary context
~Minor & Kim, 1996!. There are also
numerous examples of proteins without significant sequence ho-
mology that, nevertheless, have high structural homology.
To enhance structure determination and molecular modeling, we
have implemented a knowledge-based energy function that makes
greater use of the information in structure databases. The energy
function is derived from distributions of interatomic distances es-
timated from an ensemble of reference structures
~see Methods!.
These distributions are referred to as “probability density func-
tions”
~PDFs!. Molecular dynamics ~MD! using a PDF energy
adjusts the structures so that the interatomic distances of the model
are similar to those found in the ensemble.
Reprint requests to: Michael E. Wall, Bioscience Division, MSG758,
Los Alamos National Laboratory, Los Alamos, New Mexico 87545; e-mail:
mewall@lanl.gov.
3
Present address: Department of Bioengineering, University of Califor-
nia, San Diego, 9500 Gilman Dr., Mail Code 0412, La Jolla, California
92093-0412.
Protein Science
~1999!, 8:2720–2727. Cambridge University Press. Printed in the USA.
Copyright © 1999 The Protein Society
2720
Standard MD refinement techniques
~Brünger et al., 1987! use
Van der Waals
~VDW! interactions to help determine the distance
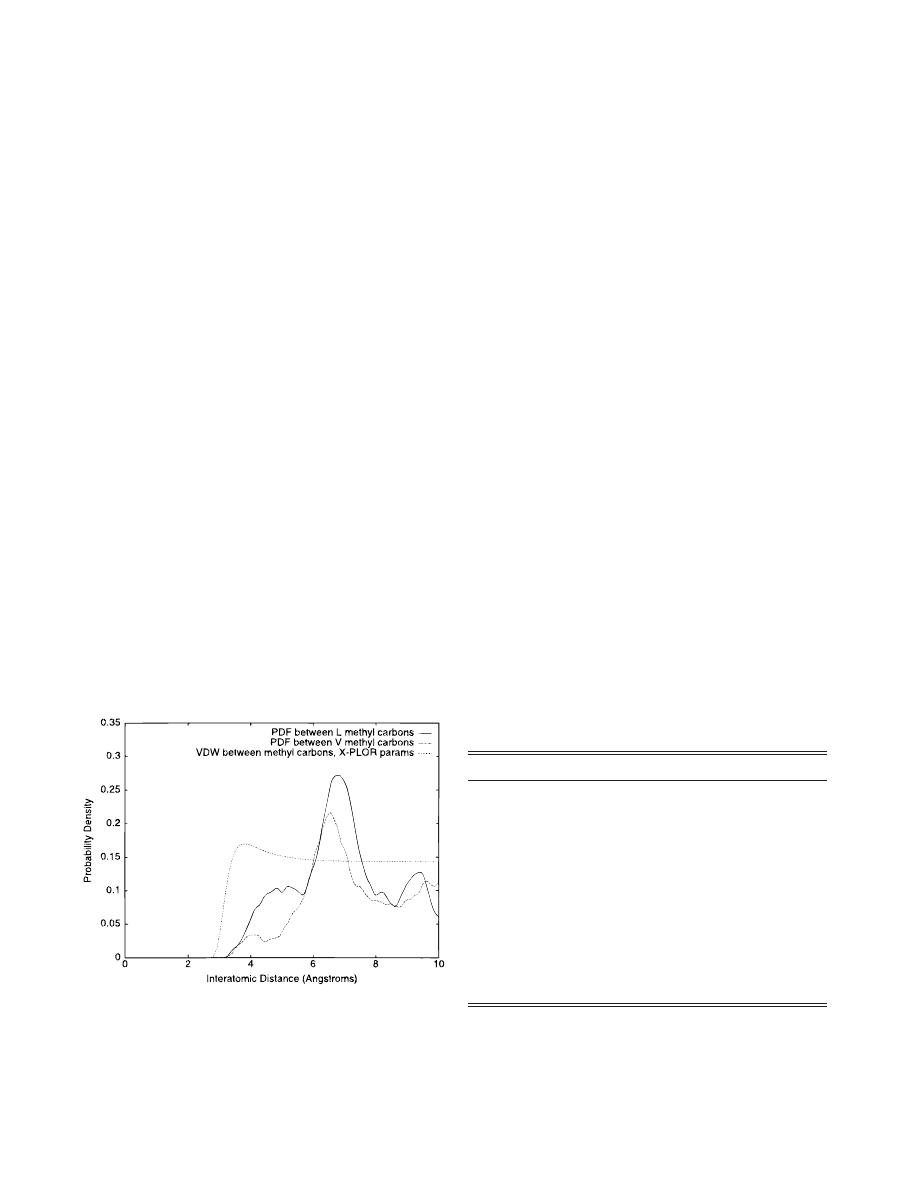
between nonbonded atoms. Figure 1 compares the VDW inter-
action between two methyl carbons with both the PDF for methyl
carbons on valine residues separated by three peptide bonds
~m
5 3!
and the m
5 3 PDF for leucine–leucine methyl carbons. The PDF
energy is much more richly structured and depends on the context
of the atom pairs.
We reason that by replacing VDW with the PDF energy, much
more information will be available for nonbonded interactions be-
tween atoms, providing a powerful method for optimizing protein
structures. Here we present the results of a test of this idea: A PDF
energy function was implemented in crystallographic refinement,
and the method was tested by running test refinements on random-
ized X-ray structures. The results show that using the PDF energy
function significantly improved the structures obtained at the end
of refinement. Analysis of the refined structures shows where the
improvements are and why this is a useful method in determining
X-ray structures.
Results
A 1.3 Å resolution crystal structure of wild-type myoglobin
~Romo,
1998
! and a 2.0 Å resolution structure of calmodulin complexed
with brain calmodulin-dependent protein kinase II-alpha
~Wall et al.,
1997; Protein Data Bank
~PDB! entry 1cm1! were randomized
~see Methods!. These structures were refined using real X-ray data
truncated at 2.0 and 3.5 Å to simulate low-resolution crystallog-
raphy. Three refinement methods were used: Cartesian molecular
dynamics using standard potentials
~referred to as “NORM” in
tables and figures
!, Cartesian molecular dynamics with the VDW
potential replaced by the PDF potential
~“PDF ” in tables and
figures
!, and torsion-angle refinement ~Rice & Brünger, 1994!
with standard potentials
~“TORS” in tables and figures!.
The following sections describe analyses of the atomic posi-
tions, interatomic distances, stereochemistry, side-chain dihedral
angles, R-factors, and PDF scores of the refined structures. The
X-ray data and known structures were used to analyze the struc-
tures and evaluate the refinements. The analyses show that refine-
ment was improved by using the database potential.
Atomic positions
The root-mean-square deviation
~RMSD! of backbone and side-
chain atomic positions in refined structures was calculated with
respect to the X-ray structures
~Table 1!. In all but one case, both
backbone and side-chain positions were more accurate in PDF
refinement. The exception is for the backbone of myoglobin re-
fined at 2.0 Å resolution, where no advantage is observed. Includ-
ing higher resolution data in refinement led to improved atomic
positions in all cases.
Interatomic distances
The RMSDs of interatomic distances between refined structures
~NORM and PDF! and the X-ray structures were calculated as a
function of the interatomic distance. Results for torsion-angle re-
finement are almost indistinguishable from those for normal re-
finement. Use of the PDF potential improved overall interatomic
distances in all refined structures
~Table 1!.
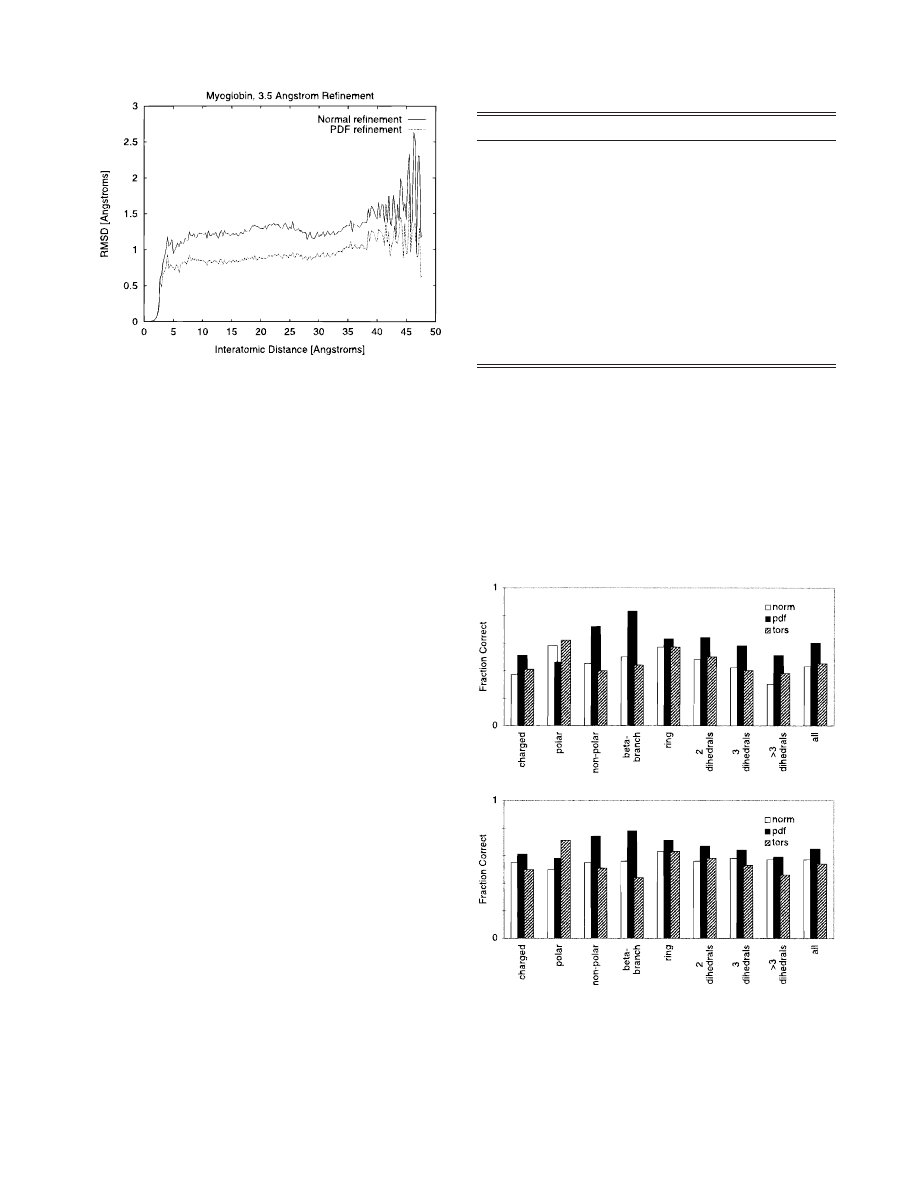
In the 3.5 Å resolution PDF refinement of myoglobin, there was
a relatively uniform improvement in the RMSD of interatomic
distances for distances between 5 and 25 Å
~Fig. 2!. The difference
decreases slightly from 25 to 30 Å, and then is uniform until 40 Å.
Above 40 Å, where the number of atom pairs is small, the RMSD
becomes highly variable. Atom pairs involving surface residues
likely begin to dominate the statistics at 25 Å. Results from the
calmodulin complex
~not shown! are similar, except that the RMSD
becomes small at long distances, perhaps due to end-to-end pack-
Fig. 1. Comparison of probability densities for methyl carbon pairs. PDF
probability densities vs. distance for V:C
g–V:Cg and L:Cd–L:Cd atom
pairs
~m
5 3! are contrasted with a methyl carbon–methyl carbon VDW
potential. The PDF depends upon the context of the methyl carbon and has
more features than the probability due to VDW. Note that the PDF densities
are shifted to higher distances than in VDW, showing the effect of the
backbone connectivity on the distance.
Table 1. RMSDs of backbone and side-chain atomic positions,
and RMSD of interatomic distances, all calculated between
refined structures and available high-resolution structures
a
Meth
Back
Side
Dist
BOND
ANGL
DIHE
IMPR
3.5A Mb
norm
0.52
1.95
1.25
0.47
1.07
25
0.60
0.33
1.47
0.88
0.70
1.12
23
0.94
tors
0.52
1.94
1.24
0.35
0.84
26
0.52
CaM
norm
0.73
1.96
1.31
0.39
0.78
29
0.43
0.45
1.60
1.05
0.76
1.10
24
0.68
tors
0.69
1.84
1.21
0.35
0.70
29
0.40
2.0A Mb
norm
0.23
1.63
1.03
0.94
1.31
22
0.83
0.24
1.41
0.87
0.83
1.12
20
0.84
tors
0.23
1.68
1.03
0.63
1.08
23
0.68
CaM
norm
0.48
1.90
1.19
0.96
1.49
27
0.74
0.25
1.58
1.00
1.40
1.59
26
1.09
tors
0.48
1.74
1.07
0.60
0.86
28
0.49
a
Also shown are RMSDs from ideal bond distances
~BOND!, bond
angles
~ANGL!, multimodal dihedral angles ~e.g., backbone! ~DIHE!, and
other dihedral angles
~IMPR!. Back, Side, and Dist values are in ang-
stroms. BOND values are in 10
22
Å. ANGL, DIHE, and IMPR values are
in degrees. Structures were chosen on the basis of the lowest R
free
~see
Table 3
!.
Structure determination using a database
2721
ing in the crystal lattice. Plots are generally similar for 2.0 Å
resolution refinements
~not shown!.
Stereochemistry
The RMSDs of standard geometry parameters from the mean were
calculated for each of the refined structures
~Table 1!. No VDW
clashes were found in any structure, and the values indicate that all
of the structures have normal stereochemistry. The PDF potential
generally lowered the RMSD for multimodal dihedral angles DIHE
~phi, psi, and chi, as defined by IUPAC! while raising the RMSD
for the other parameters.
Side-chain conformations
The fraction of correct side-chain rotational isomers
~Volkenstein,
1963
! or “rotomers” ~as defined by IUPAC! was calculated for
each of the refined structures
~Table 2!. With one exception, the
fraction is higher in every instance for PDF-refined structures. The
exception is the 2.0 Å myoglobin refinement, where more NORM
refinement yielded better placement of
x
1
and
x
3
rotomers, and a
higher overall fraction of correct rotomers. PDF refinement in this
instance produced both a higher fraction of combined correct
x
1
and
x
2
rotomers, and a higher fraction of correct
x
2
rotomers.
An analysis of the fraction of correct combined
x
1
and
x
2
roto-
mers vs. residue type was done for 3.5 and 2.0 Å resolution refine-
ments
~Fig. 3!. In both 3.5 Å resolution refinement ~Fig. 3A! and
2.0 Å resolution refinement
~Fig. 3B!, PDF improved the side-chain
conformations for all but the polar category.
Nonpolar and beta-branched categories showed the biggest im-
provement in fraction of correct combined
x
1
and
x
2
rotomers.
Remarkably, a separate calculation for the 3.5-Å resolution cal-
modulin refinement showed that all of the
~x
1
,
x
2
! combinations
are correct for this case. The PDF refinement method thus posi-
tioned interior residues particularly well. This is understandable,
due the increased number of distance distributions
~and thus in-
formation
! available for buried atoms.
Crystallographic R-factors
R-factors were calculated at multiple resolutions using both real
and simulated diffraction data
~Table 3!. R
free
~Brünger, 1992!
Fig. 2. The difference
~as calculated by RMSD! between interatomic dis-
tances in the X-ray structure and the 3.5 Å resolution refined structure of
myoglobin plotted vs. interatomic distance. RMSD is defined for structures
~1! and ~2! at distance s as @
^~d
ij
~1!
2 d
ij
~2!
!
2
&
6d
ij
~1!
2s6,b
#
102
, where
$i % and $ j %
span all atoms in the structure, d
ij
5 distance between atoms i and j, and b
is half the bin size. Values are averaged in 0.25 Å bins.
Table 2. Fraction of correct side-chain rotomers
a
Meth
x
1
x
2
x
3
x
1
and
x
2
All
3.5 Å Mb
norm
0.66
0.72
0.49
0.53
0.65
0.79
0.81
0.58
0.69
0.76
tors
0.71
0.75
0.29
0.58
0.66
CaM
norm
0.62
0.48
0.36
0.28
0.52
0.75
0.62
0.40
0.51
0.64
tors
0.61
0.52
0.26
0.31
0.52
2.0 Å Mb
norm
0.87
0.77
0.67
0.69
0.80
0.83
0.87
0.51
0.78
0.79
tors
0.73
0.77
0.49
0.61
0.70
CaM
norm
0.70
0.57
0.36
0.45
0.60
0.76
0.66
0.45
0.51
0.67
tors
0.72
0.57
0.49
0.48
0.62
a
Structures were chosen on the basis of the lowest R
free
~see Table 3!.
A
B
Fig. 3. Analysis of the fraction of correct combined
x1 and x2 rotomers
vs. residue type. Myoglobin and calmodulin results are combined to cal-
culate the fractions for
~A! 3.5 Å refinement and ~B! 2.0 Å refinement.
Residue type definitions: charged
5 EDHKR; polar 5 NQSTY; nonpolar 5
CFILMVW; beta-branched
5 ITV; ring 5 FHWY; 1 dihedral 5 CSTV;
2 dihedrals
5 FHDILNWY; 3 dihedrals 5 EMQ; .3 dihedrals 5 KR; all 5
CDEFHIKLMNQRSTVWY.
2722
M.E. Wall et al.

~using real data! and R
calc
~using simulated data! are smaller for
structures obtained by PDF refinement. The resolution-dependent
analysis shows that the PDF potential improved the high resolution
features of the structural models, especially when only low reso-
lution data were used for refinement. Note that R
free
is not the best
measure of the quality of a structure for our tests, as it does not
make use of the available high-resolution structure model.
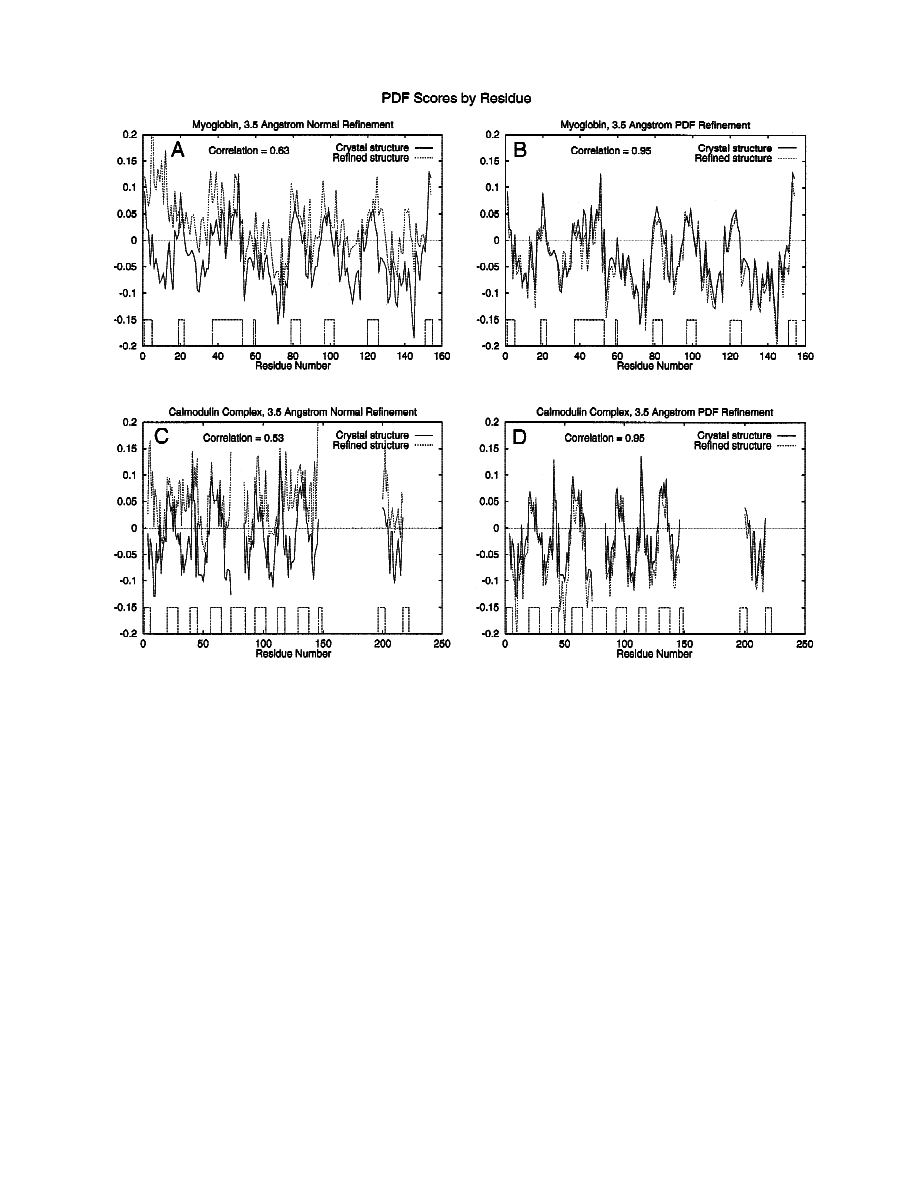
PDF scores by residue
The average PDF score per residue was calculated for the orig-
inal X-ray structures of myoglobin and the calmodulin complex
~Fig. 4!. In both structures, there is a good correspondence be-
tween regions with relatively uncommon interatomic distances
~high
PDF score
! and nonhelical domains.
The same plots were compared with ones obtained from refined
structures by calculating correlation coefficients. For myoglobin
refined at 3.5 Å resolution using normal methods, the correlation
calculated between the profiles is 0.63
~Fig. 4A!. For the calmod-
ulin complex refined at 3.5 Å resolution, the correlation is 0.53
~Fig. 4C!. For both myoglobin and calmodulin refined at 3.5 Å
resolution using the PDF method, the correlation coefficient cal-
culated between the profiles is 0.95
~Fig. 4B,D!. The correlations
calculated for structures refined at 2.0 Å resolution were: 0.86 for
Mb, normal refinement; 0.96 for Mb, PDF refinement; 0.78 for
CaM, normal refinement; and 0.94 for CaM, PDF refinement.
Using the PDF energy in low-resolution refinements, therefore,
has the striking result of producing PDF profiles that usually come
only from high-resolution structure determinations.
Discussion
We have demonstrated that a novel energy function, the PDF data-
base potential, enhances protein structure determination. Com-
pared to standard methods, use of the PDF energy improved atomic
positions, interatomic distances, side-chain conformations and
R-factors of refined randomized structures of myoglobin and a
calmodulin complex. The results indicate that the PDF potential
should be a valuable tool for determining X-ray structures, espe-
cially in the early stages of a structure determination or when only
low-resolution data are available. Future studies will address the
value of the method in molecular modeling and NMR refinement.
Plots of the PDF score by residue
~Fig. 4! suggest two rules for
evaluating structures. The first is that any alpha-helical region
with a PDF score
.0 is likely to have incorrectly modeled side
chains. The second is that any region with a PDF score
.0.2 ~using
normalization W
5 0.58! is likely to be incorrectly modeled. These
two rules together can be used as a heuristic method for validating
protein structures using plots of the PDF score by residue.
PDF refinements accurately reproduced both the minima and
maxima in plots of PDF score by residue that were obtained from
the high-resolution X-ray structures
~Fig. 4!. The PDF method thus
may improve structural models even when it is applied to proteins
where the real interatomic distances are relatively uncommon. Fu-
ture studies, however, will be needed to demonstrate the method’s
effectiveness when applied to a broad range of protein classes.
It has been suggested that multimodal information
~such as the
PDF potential
!, while useful for validation methods, is inappropri-
ate for use in refinement
~Sheldrick & Schneider, 1997!. One
reason is that structures tend to become trapped in local minima,
making it impossible to locate the global minimum without a pro-
hibitively time-consuming search of the space of model param-
eters. Another is because the negative curvatures in multimodal
distributions render useless many optimization methods that rely
on curvature information.
Use of multimodal information is certainly not appropriate in
the latter stages of refinement of a high-resolution structure, where
full-matrix least-squares methods are applied. It is certainly useful,
however, in the early stages of refinement, when the solution is far
from the global minimum in the X-ray target, or in low-resolution
refinements, when the full-atom solution is underdetermined by
the X-ray data. In the early stages of refinement, use of the PDF
potential can improve interatomic distances, improving model phases
and electron-density maps
~observed in an application to a
Table 3. R, R
free
, and R
calc
evaluated to the resolution indicated at the top of the column
a
R
R
free
R
calc
Meth
Wght
3.5 Å
2.0 Å
1.3 Å
3.5 Å
2.0 Å
1.3 Å
3.5 Å
2.0 Å
1.3 Å
3.5 Å Mb
norm
1.0
3
0.19
0.43
0.48
0.38
0.47
0.50
0.26
0.43
0.48
1.0
3
0.22
0.37
0.42
0.35
0.42
0.45
0.25
0.36
0.41
tasa
0.5
3
0.23
0.43
0.48
0.39
0.47
0.50
0.28
0.43
0.47
CaM
norm
0.5
3
0.28
0.45
N0A
0.43
0.52
N0A
0.35
0.46
N0A
1.0
3
0.28
0.42
N0A
0.39
0.46
N0A
0.31
0.40
N0A
tasa
0.5
3
0.26
0.45
N0A
0.42
0.52
N0A
0.33
0.45
N0A
2.0 Å Mb
norm
2.0
3
0.26
0.30
0.34
0.31
0.36
0.38
0.23
0.26
0.30
1.0
3
0.27
0.30
0.34
0.30
0.34
0.36
0.22
0.25
0.29
tasa
1.0
3
0.28
0.32
0.37
0.33
0.38
0.40
0.25
0.30
0.34
CaM
norm
2.0
3
0.25
0.35
N0A
0.38
0.44
N0A
0.31
0.37
N0A
2.0
3
0.28
0.35
N0A
0.38
0.43
N0A
0.30
0.34
N0A
tasa
1.0
3
0.27
0.36
N0A
0.38
0.46
N0A
0.32
0.37
N0A
a
Values are for refinements of myoglobin
~Mb! and calmodulin ~CaM! using X-ray data truncated at 3.5A and 2.0 Å. The relative
weight of the X-ray data is indicated in the Wght column. Only results from structures with the lowest value of R
free
are listed.
Structure determination using a database
2723
troponin-C structure problem by Soman et al., 1999
!. The improve-
ments thus can potentially speed the process of obtaining a good
initial model for the latter stages of refinement.
The argument for using the PDF potential in refinement is even
stronger when only low-resolution data are available. In this case,
many atomic models will fit the data equally well, so that to choose
the most likely structure one must rely on prior information about
protein structure. In Bayesian terms, the PDF potential can be seen
as an estimate of the prior probability for the interatomic distances
in the protein
~given the assumption of independent atom pairs!.
When high resolution data are available, the PDF potential is less
useful, because
~1! the data are sufficient to determine the struc-
ture, and
~2! high-resolution structures already have PDF profiles
that are similar to those obtained by minimization of the PDF
energy, leaving little room for improvement.
Our tests definitively show that the PDF refinement method can
be useful in increasing the quality of a structural model. One
remarkable supporting result is that the high-resolution features
~i.e., R-factors! of both myoglobin and the calmodulin complex
were improved by use of the PDF potential in low-resolution re-
finement. Another is that refinement at low resolution accurately
reproduced the entire profile of the PDF score by residue for the
high-resolution X-ray structures
~correlation
5 0.95!, whereas nor-
mal refinement generated models with a much poorer agreement
~correlation
,0.65!.
There are two ways to explain the enhancement in refinement.
One is that the PDF potential provides extra information that is not
available in refinement with ordinary potentials. The PDF potential
is derived only from compact structures, whereas the distance
distributions that one would derive from ordinary geometry re-
straints and contact potentials would allow both compact and ex-
tended structures. The difference is most likely due to entropic
effects: protein configurational entropy and the hydrophobic “in-
teraction.” Further studies will be required to determine the rela-
tive contributions of entropic effects and geometrical restraints in
giving rise to the features in the PDFs.
Fig. 4. PDF scores calculated by residue for X-ray structures from
~A! normal refinement of myoglobin, ~B! PDF refinement of
myoglobin,
~C! normal refinement of the calmodulin complex, and ~D! PDF refinement of the calmodulin complex, all refined at 3.5 Å
resolution. On the calmodulin complex plots, linker residues 74–83 were deleted, and residues beginning at 200 correspond to the
peptide. The correlation coefficient calculated between the plots is indicated on each graph. Nonhelical domains are indicated by boxes
at the bottom. PDF scores above 0 indicate relatively uncommon interatomic distances.
2724
M.E. Wall et al.

The PDF potential could also enhance refinement by its re-
representation of local geometrical restraints in terms of central
forces between unbonded atom pairs. The many pairwise poten-
tials could result in a more efficient search of configuration space
than is possible when the restraints are represented using only local
geometry parameters and a VDW nonbonded interaction. The many
multimodal distance distributions that determine the forces on a
single atom could potentially add up to an energy surface that is
relatively free of local traps, allowing a complex downhill trajec-
tory through configuration space. The repulsive component of the
PDF potential is also relatively soft, so that conformations that
would be frustrated by VDW contacts would be more plastic when
PDF is used.
Finally, we note that there are many alternative ways of choos-
ing structures to use in generating the PDFs
~e.g., the 100 high-
resolution structures without VDW clashes described in Word et al.,
1999
!. Many of these may provide additional information valuable
for structure determination. Further studies will be required to
determine which factors are most important in enhancing structure
refinement.
In summary, our results support an “Aufbau principle” of mac-
romolecular structure
~Schutt, 1987!. In this principle, the proper-
ties of larger structures are induced from those of smaller molecules
that have been carefully described. A caveat is that new structures
that depend on this information should not be used in generating
future database potentials. By making fuller use of the information
in structures that have already been solved, however, methods that
use the new database potentials will likely aid in the structure
solution and modeling of molecular complexes for which data are
scarce.
Methods
The PDF energy function is derived from a previously described
knowledge-based interaction potential for proteins
~Sippl, 1990;
Subramaniam et al., 1996
!. A probability is constructed by assum-
ing that each atom pair contributes independently according to
spatial separation. The total likelihood of a structure is equal to the
product of all of the pairwise probabilities.
To implement this, one wants the precise probability density
functions
~PDFs! that describe the distances between atoms in
proteins
~i.e., statistical mechanical pair distribution functions!.
Although these PDFs are not known, they can be estimated using
an ensemble of known protein structures.
Classification of atom pairs for the distributions is critical. For
our PDF database, an ordered pair of atom types plus the number
of peptide bonds m along the bonding path connecting the atoms is
used. A value m
5 0 corresponds to the atoms on the same residue,
and any value m
. 4 ~4 5 alpha-helical repeat! is of one type,
termed “tertiary.” Each nonhydrogen atom on 21 residue types
~20
plus disulfide-bonded cysteine
! counts as 1 of 173 different atom
types. This leads to distance probability distributions between
roughly 150,000 types of atom pairs. Scoring systems based on
these and similar distributions already have shown promise for
validating protein structures
~Sippl, 1993; Rojnuckarin & Subra-
maniam, 1999
!.
To obtain the PDFs, structures of 2.5 Å or higher resolution in
the Brookhaven Protein Data Bank
~PDB! ~Bernstein et al., 1977!
were sampled for interatomic distances, and the results were
smoothed. Only a single structure was selected among structures
with more than 25% sequence identity. Selection criteria for this
structure were
~1! high resolution, ~2! absence of prosthetic groups,
and
~3! low R-factors in order of importance. Four hundred thirty-
two polypeptide chains from 392 structures were analyzed to gen-
erate the distributions.
Selection of the kernel width for smoothing is critical, as too
small a width will introduce artifacts from noise, while too large a
width will smear important features. Here, the optimal kernel width
was determined from the data obtained for each atom pair
~Silver-
man, 1982; Rojnuckarin & Subramaniam, 1999
!. Distributions were
stored as arrays of 140 values of the probability density at discrete
interatomic distances, along with a start distance and bin size to
generate the ordinate values.
A stand-alone program called SOESA
~standing for Structure
Optimization and Evaluation using Separations of Atoms; distri-
bution through the internet at www.bioc.rice.edu0soesa! was writ-
ten to calculate the total PDF energy and its derivatives with respect
to atomic positions. This program runs in the UNIX background as
a “server” and processes requests for calculations from “client”
processes, leaving the answers in a file. Support was added for
using the information in the output file for refinement in X-PLOR
~Brünger, 1993! ~see below!, CNS ~Brünger et al., 1998! ~still to be
completed
!, and TNT ~Tronrud, 1997!.
The program SOESA calculates the PDF energy by summing
contributions E
ij
~s! from each unique atom pair ~i, j !, where s is
the interatomic distance. The values E
ij
~s! are calculated by spline
interpolation of the transformed arrays E
ij,n
~s!
5 2W ln P
ij,n
~s!
,
where P
ij,n
~s!
is the probability distribution between atoms i and j,
and n
~s! is the bin number into which the distance s falls in the
distribution. Thus, the total energy bears resemblance to an ex-
pression of maximum likelihood, where the product of the values
P
ij
~s! is analogous to a prior probability of the interatomic dis-
tances. By analogy with Boltzmann statistics, the energy scale W
was defined as 0.58 kcal mol
21
~
5 RT at room temperature!,
although in practice W is an arbitrary weight whose value should
be optimized.
The gradient of the energy with respect to atomic positions was
calculated using the analytic derivative of the spline expression
used to interpolate the energy values. The gradient is used by, e.g.,
X-PLOR to calculate molecular dynamics forces F
i
on each atom
i as F
i
5 2
(
j
dE
ij
~s!0ds~x
i
2 x
j
!06x
i
2 x
j
6, where x
i
is the vector
position of atom i, and the sum
(
j
is carried out over all j not equal
to i.
X-PLOR version 3.851 was modified to read energies and de-
rivatives from a file and use them for refinement. Also added was
a C routine to
~1! write the current atomic coordinates to a PDB
file;
~2! send a signal to a UNIX process to initiate calculations;
and
~3! wait for a signal indicating completion. Control was
implemented through the USER potential, allowing full use of
CONStraints INTERactions statements for selecting atom pairs
participating in the database potential, and setting the relative weights
of their contributions.
The fact that the PDF energies and gradients are calculated
directly from the distance distributions makes this strictly the first
true example of a database potential used in structure determina-
tion. This is so because the information in the distributions is not
parameterized or reduced in any way once estimated. By compar-
ison, for instance, standard geometry restraints reduce the infor-
mation to mean distances and angles and their standard deviations.
We found that methods such as steepest descent and molecular
dynamics, especially when combined with simulated annealing
algorithms, efficiently decreased the PDF energy. Methods that use
Structure determination using a database
2725

curvature information, however, such as Powell minimization, did
not work well. This is due to the multimodal nature of the distance
distributions and the amplification of noise caused by differentia-
tion, both of which give rise to sign changes in the curvature.
Test conditions
We used real data from experiments on solved structures for our
tests. Artificial X-ray data nearly always agree poorly with low-
resolution experimental data, and the tests of low-resolution re-
finement were critical to our study. The structure and X-ray data
from crystallographic experiments on a 1.3 Å resolution wild-type
myoglobin
~Romo, 1998! and a 2.0 Å resolution structure of cal-
modulin complexed with the calmodulin-binding domain of brain
calmodulin-dependent protein kinase II-alpha
~Wall et al., 1997!
~PDB entry 1cm1! were used. Linker residues 74–83, which lie in
a region of no connected electron density, were deleted from the
calmodulin complex.
Homologous myoglobin
~PDB entry 1mbd! and calmodulin ~PDB
entry 1osa
! coordinates are in the ensemble of reference structures.
These structures account for only a small fraction of the total data
used to compile the PDFs, however, and therefore would not sig-
nificantly bias refinement. In addition, the calmodulin entry is in
the open, unbound form, which has major differences with the
closed, bound form used in this study.
Test conditions were chosen to mimic early refinement, where
the backbone is fairly well defined but the side chains are not yet
determined. Starting structures for the tests were generated by first
using the program CHAIN
~Sack, 1988! to select alternate possible
side-chain conformations for one-third of the residues, attempting
to minimize changes to all but the
x
1
dihedral angle. Changes
preserved good local geometry, but were poor in the context of the
rest of the protein. The temperature factors for all atoms in the
myoglobin structure were set to 10 Å, and those for the calmodulin
complex were set to 20 Å. One refinement cycle
~described below!
by standard methods using X-ray data truncated at 3.5 Å resolution
was then run to generate a starting structure with scrambled side
chains and displaced backbone atoms.
Parallel refinements in X-PLOR were run using three methods
to try to improve the starting structure. In each method, geometry
restraints
~BOND, ANGL, DIHE, and IMPR flags! were used. For
“NORM” refinement, the VDW potential was used. For “ PDF ”
refinement, the VDW potential was turned off and replaced by the
USER
~i.e., PDF! potential. To avoid overweighting local geom-
etry restraints, the m
5 0 PDFs were not used. Torsion-angle re-
finement
~“TORS”! was also carried out using the same potentials
as with standard refinement.
To simulate limited available X-ray data, refinement was done
using reduced data sets: a low-resolution data set truncated at 3.5 Å
and a high-resolution data set truncated at 2.0 Å.
Standard methods were used
@see X-PLOR manual ~Brünger,
1993
!# to scale the contribution of the X-ray target function to the
total “energy,” dividing the recommended Wa by 3 for all refine-
ments. For each case, two additional refinements were carried out
with the recommended weight both doubled
~2.0
3! and halved
~0.5
3!.
For myoglobin, all heme atoms were kept fixed during refine-
ment. For calmodulin, all calcium ions were kept fixed.
Each full round of NORM and PDF refinement consisted of a
segment of simulated annealing
~300 K final temperature, 25 K
step, 25 cycles per step
! bracketed by Powell minimizations ~120
steps each
!. Four sequential rounds of refinement were carried out
in each case, and the best R
free
structure was chosen for comparison.
For NORM refinement, starting temperatures of both 2,000 and
4,000 K were used. At 3.5 Å resolution, better results were ob-
tained using a starting temperature of 2,000 K, while at 2.0 Å
resolution, better results were obtained using a starting tempera-
ture of 4,000 K. For PDF refinement, only a starting temperature
of 4,000 K was used.
For the TORS method, four parallel refinements were done,
using starting temperatures of both 2,000 and 4,000 K. For 3.5 Å
refinement, a starting temperature of 2,000 K gave the best results,
and for 2.0 Å resolution refinement, a starting temperature of
4,000 K gave the best results; the sample X-PLOR script was used
with minimal editing.
Acknowledgments
We gratefully acknowledge the contributions of A. Rojnuckarin, M. Stupar,
and E. Blanc for programming support, J. Soman for performing some
refinement tests, and G. Bricogne for advice on the manuscript and dis-
cussions about protein refinement and the curvature problem. This work
was supported by funding from NIH AR 40252, the Robert A. Welch
Foundation, and NSF. M.E.W. gratefully acknowledges fellowships from
the Robert A. Welch Foundation and the Keck Center for Computational
Biology, and additional support from NCSA.
References
Bernstein FC, Koetzle TF, Williams GJB, Myer EF Jr, Brice MD, Rodgers JR,
Kennard O, Shimanouchi T, Tasumi M. 1977. The Protein Data Bank: A
computer-based archival file for macromolecular structure. J Mol Biol
112:535–542.
Blundell TL, Sibanda BL, Sternberg MJE, Thornton JM. 1987. Knowledge-
based prediction of protein structures and design of novel molecules. Nature
323:347–352.
Browne WJ, North ACT, Philips DC, Brew K, Vanaman TC, Hill RL. 1969. A
possible three-dimensional structure of bovine
b-lactalbumin based on that
of hen’s egg white lysozyme. J Mol Biol 42:65–86.
Brünger AT. 1992. Free R-value—A novel statistical quantity for assessing the
accuracy of crystal structures. Nature 355:472– 475.
Brünger AT. 1993. X-PLOR version 3.1: A system for X-ray crystallography and
NMR. New Haven, Connecticut: Yale University Press.
Brünger AT, Adams PD, Clore GM, DeLano WL, Gros P, Grosse-Kuntsleve RW,
Jiang JS, Kuszewski J, Nilges M, Pannu NS, et al. 1998. Crystallography &
NMR system: A new software suite for macromolecular structure determi-
nation. Acta Crystallogr D54:905–921.
Brünger AT, Kuriyan J, Karplus M. 1987. Crystallographic R factor refinement
by molecular dynamics. Science 235:458– 460.
Engh RA, Huber R. 1991. Accurate bond and angle parameters for X-ray protein–
structure refinement. Acta Crystallogr A47:392– 400.
Hendrickson WA, Konnert JH. 1980. Incorporation of stereochemical informa-
tion into crystallographic refinement. In: Diamond R, Ramaseshan S, Ven-
katesan K, eds. Computing in crystallography. Bangalore, India: Indian
Academy of Sciences. pp 13.01–13.23.
Jones DT, Thornton JM. 1996. Potential energy functions for threading. Curr
Opin Struct Biol 6:210–216.
Minor DL Jr, Kim PS. 1996. Context-dependent secondary structure formation
of a designed protein sequence. Nature 380:730–734.
Rice LM, Brünger AT. 1994. Torsion angle dynamics—Reduced variable con-
formational sampling enhances crystallographic structure refinement. Pro-
teins 19:277–290.
Rojnuckarin A, Subramaniam S. 1999. Knowledge-based interaction potentials
for proteins. Proteins 36:54– 67.
Romo TD. 1998. Identification and modeling of protein conformational sub-
states
@PhD thesis#. Rice University, Houston, Texas.
Sack JS. 1988. CHAIN—A crystallographic modeling program. J Mol Graph
6:244–245.
Sanchez R, Sali A. 1997. Advances in comparative protein-structure modelling.
Curr Opin Struct Biol 7:206–214.
2726
M.E. Wall et al.

Schutt CE. 1987. Muscle regulation—Movement on the Aufbaubahn. Nature
325:757–758.
Sheldrick GM, Schneider TR. 1997. SHELXL: High-resolution refinement. Meth-
ods Enzymol 277B:319–343.
Silverman BW. 1982. Algorithm AS 176. Kernel density estimation using the
fast Fourier transform. Appl Stat 31:93–99.
Sippl MJ. 1990. Calculation of conformational ensembles from potentials of
mean force—An approach to the knowledge-based prediction of local struc-
tures in globular-proteins. J Mol Biol 213:859–883.
Sippl M. 1993. Recognition of errors in 3-dimensional structures of proteins.
Proteins 17:355–362.
Soman J, Tao T, Phillips GN Jr. 1999. Conformational variation of calcium-
bound troponin C. Proteins. In press.
Subramaniam S, Tcheng DK, Fenton JM. 1996. In: States DJ, Agarwal P, Gas-
sterland T, Hunter L, Smith RF, eds. Proceedings of the fourth international
conference on intelligent systems in molecular biology, St. Louis. Menlo
Park, CA: AAAI Press. pp 218–229.
~Currently available at http:00glycine.
ncsa.uiuc.edu0doc0ISMB96-PDF.html.!
Terwilliger TC, Waldo G, Peat TS, Newman JM, Chu K, Berendzen J. 1998.
Class-directed structure determination: Foundation for a protein structure
initiative. Protein Sci 7:1851–1856.
Tronrud DE. 1997. The TNT refinement package. Methods Enzymol 277B:306–
319.
Volkenstein MV. 1963. Statistics of polymeric chains. New York: Interscience.
~Translated from Russian by Timasheff SN, Timasheff MJ.!
Wall ME, Clarage JB, Phillips GN Jr. 1997. Motions of calmodulin charac-
terized using both Bragg and diffuse X-ray scattering. Structure 5:1599–1612.
Word JM, Lovell SC, Richardson JS, Richardson DC. 1999. Asparagine and
glutamine: Using hydrogen atom contacts in the choice of side-chain amide
orientation. J Mol Biol 285:1735–1747.
Structure determination using a database
2727
Wyszukiwarka
Podobne podstrony:
pdf 1 92 9045 170 X en
instr 2011 pdf, Roztw Spektrofoto
(ebook PDF)Shannon A Mathematical Theory Of Communication RXK2WIS2ZEJTDZ75G7VI3OC6ZO2P57GO3E27QNQ
KSIĄŻKA OBIEKTU pdf
zsf w3 pdf
CAD CAM KWPPWPS Zad graf PDF
10 Produkty strukt PDF
biuletyn katechetyczny pdf id 8 Nieznany
excel 2013 pdf converter
DIOKSYNY pdf
instrukcja pilota uniwersalnego 433,92
cziomer i zyblikiewicz, w pdf
cwiczenie 2b pdf
Eucharystyczne w pdf, Niech z serca płynie pieśń
Brit M Two Men and a Lady Prequel [Ravenous] (pdf)
egzamin bhp pdf
Drewno projekt 1 pdf
LINGO ROSYJSKI raz a dobrze Intensywny kurs w 30 lekcjach PDF nagrania audio audio kurs
więcej podobnych podstron