A
t the beginning of the 1990s, Poland became the first country in post-communist Europe
to embrace rapid economic liberalization—a goal implemented by both center–right and
center–left governments. Years of economic transformation have led to deep structural
change and have made Poland’s economy one of the most successful and open in Central
Europe. Banking has been almost completely privatized, with foreign institutions owning 70
percent of total assets. Despite pressures from the Union of Labor and the Peasants Party (pop-
ulist coalition partners in the ruling Democratic Left Alliance) to loosen monetary policies, the
government has maintained its commitment to monetary discipline. The government’s ambi-
tious program to return the country to a path of sustained economic growth, announced in
October 2001, is focused on three major components: job creation for young professionals, sup-
port of medium and small enterprises, and infrastructure development. Exports depend large-
ly on European Union markets; Germany alone accounted for nearly 35 percent of exports in
2001. Therefore, joining the EU has become the overall political and economic priority for
Poland, which is also a member of the World Trade Organization and NATO. In June 2003,
Poles voted in a referendum to join the EU. Poland’s property rights score is 1 point worse this
year; however, its fiscal burden of government score is 0.2 point better, and its monetary poli-
cy score is 1 point better. As a result, Poland’s overall score is 0.02 point better this year.
TRADE POLICY
Score:
3–Stable
(moderate level of protectionism)
According to the World Bank, Poland’s weighted average tariff rate in 2000 (the most recent
year for which World Bank data are available) was 7.3 percent. The government maintains
non-tariff barriers through its issuance of import permits on a growing number of products.
The U.S. Department of State reports that these permit requirements “hamper import
prospects for certain bulk products that might otherwise be shipped in larger quantities on
ocean-going vessels.”
FISCAL BURDEN OF GOVERNMENT
Score—Income Taxation: 4–Stable
(high tax rates)
Score—Corporate Taxation: 3.5–Stable
(high tax rates)
Score—Change in Government Expenditures: 3.5–Better
(low increase)
Final Score:
3.6–Better
(high cost of government)
Poland’s top income tax rate is 40 percent. The top corporate tax rate is 27 percent, down
from the 28 percent reported in the 2003 Index, and is scheduled to fall to 24 percent in 2004.
Government expenditures as a share of GDP increased less in 2002 (0.8 percentage point to
43.2 percent) than they did in 2001 (1.7 percentage points). As a result, Poland’s fiscal bur-
den of government score is 0.2 point better this year.
GOVERNMENT INTERVENTION IN THE ECONOMY
Score:
2–Stable
(low level)
Based on data from the Organisation for Economic Co-operation and Development, the gov-
ernment consumed 15 percent of GDP in 2002. In 2001, according to the International
Monetary Fund, Poland received 3.96 percent of its total revenues from state-owned enter-
prises and government ownership of property.
SCORES
Trade Policy
3
Fiscal Burden
3.6
Government Intervention 2
Monetary Policy
2
Foreign Investment
3
Banking and Finance
2
Wages and Prices
3
Property Rights
3
Regulation
3
Informal Market
3.5
Population: 38,610,000
Total area: 312,685 sq. km
GDP: $166.8 billion
GDP growth rate: 1.3%
GDP per capita: $4,320
Major exports: machinery
and transport equipment,
miscellaneous manufactured
goods, food and live animals
Exports of goods and ser-
vices: $55.8 billion
Major export trading part-
ners: Germany 34.4%, France
5.4%, Italy 5.4%, UK 5.0%
Major imports: machinery
and transport equipment,
mineral fuels and lubricants,
chemicals
Imports of goods and ser-
vices: $56.9 billion
Major import trading part-
ners: Germany 23.9%, Russia
8.8%, Italy 8.2%, France 6.8%
Foreign direct investment
(net): $7.9 billion
POLAND
R
U
S
S
I
A
FINLAND
AUSTRIA
ITALY
SPAIN
SWEDEN
NORWAY
GERMANY
FRANCE
PORTUGAL
HUNGARY
ROMANIA
BULGARIA
TURKEY
DENMARK
POLAND
BELARUS
UKRAINE
CZECH
SLOVAK
GREECE
CYPRUS
NETH.
BELGIUM
IRELAND
ALBANIA
MOLDOVA
LITHUANIA
LATVIA
ESTONIA
LUX.
BOSNIA
CROATIA
SLO.
SWITZERLAND
MACEDONIA
GREENLAND
ICELAND
Canary Islands
ARMENIA
GEORGIA
SYRIA
IRAQ
U. K.
SERBIA/
MONT.
Q U I C K S T U DY
331
2002 Data (in constant 1995 US dollars)
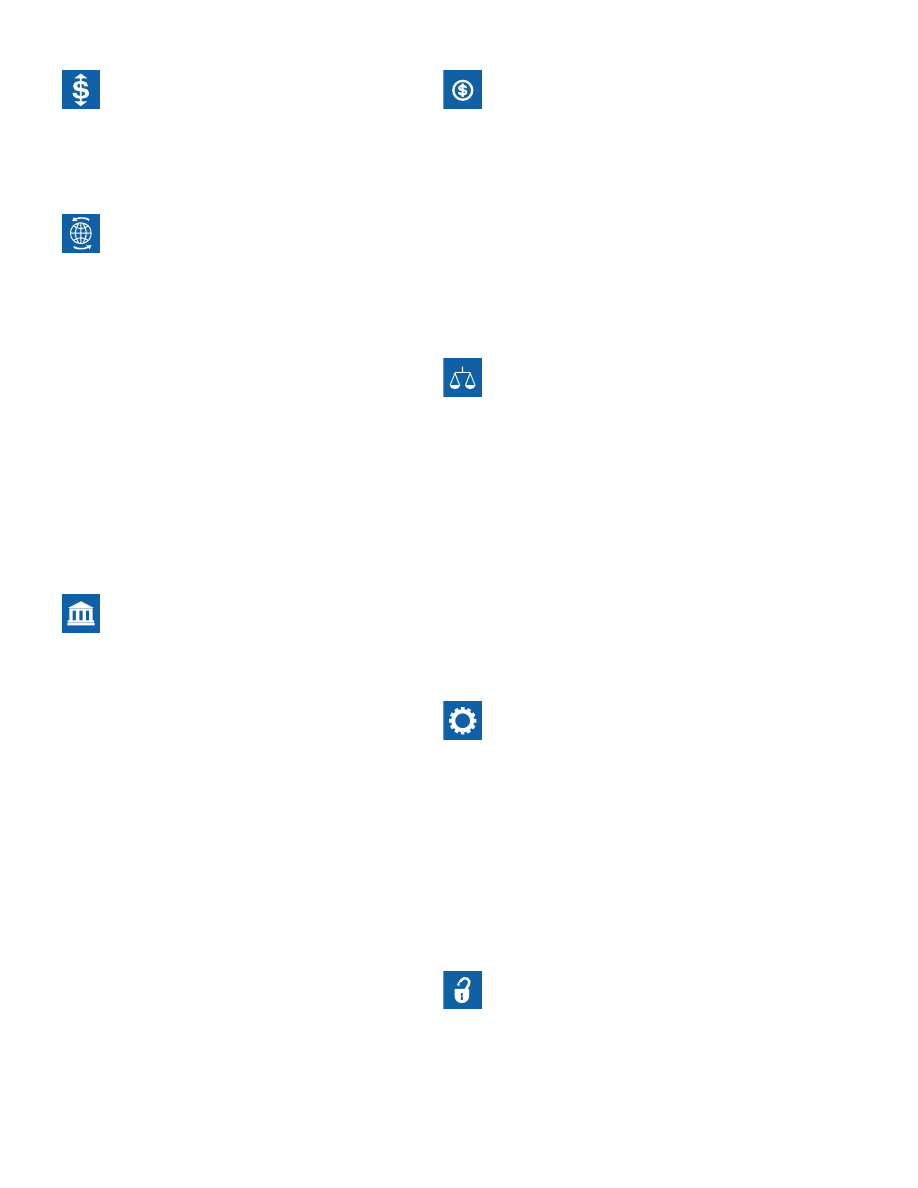
POLAND
Rank: 56
Score: 2.81
Category: Mostly Free
3.46 3.24
3.09 2.91 2.83 2.84
2.64 2.60 2.83
5
4
3
2
1
'04
'03
'02
'01
'00
'99
'98
'97
'96
'95
Present & Past Scores
2.81
(Best)
(Worst)
MONETARY POLICY
Score:
2–Better
(low level of inflation)
From 1993 to 2002, Poland’s weighted average annual rate of
inflation was 3.82 percent, down from the 7.17 percent from
1992 to 2001 reported in the 2003 Index. As a result, Poland’s
monetary policy score is 1 point better this year.
CAPITAL FLOWS AND FOREIGN INVESTMENT
Score:
3–Stable
(moderate barriers)
Polish law allows 100 percent foreign ownership of domestic
businesses with such notable exceptions as broadcasting,
insurance, and aviation services. The government lifted the
cap on foreign ownership of telecommunications on January
1, 2001. Foreign purchase of land over a set area requires gov-
ernment approval. According to the U.S. Department of State,
foreign and domestic investors face considerable red tape. All
public procurement bids must contain a 50 percent domestic
material and labor content minimum clause, and the U.S.
Department of State reports that foreign firms “face potential
discrimination in public procurement contracts.” The
International Monetary Fund reports that both residents and
non-residents may hold foreign exchange accounts, subject to
certain restrictions. Payments, transactions, and transfers
over a specified amount must be conducted through a
domestic bank. Most capital transactions require foreign
exchange permits or central bank approval.
BANKING AND FINANCE
Score:
2–Stable
(low level of restrictions)
Until the late 1980s, Poland’s banking system was geared to
supporting the state-run economy. The National Bank of
Poland was established as the central bank in 1989 and oversaw
the creation of nine independent regional banks, which subse-
quently were privatized and joined by a number of new private
banks in the 1990s. The banking sector is now open and com-
petitive. There are 83 private banks, and foreign banks account
for 70 percent of assets. The Economist Intelligence Unit reports
that the government retains control of four state-owned banks
and intends to hold “a majority share in any sale involving
PKO BP [the largest Polish bank], raising concerns that PKO BP
will be used by the authorities to direct credit to chosen, ‘strate-
gic’ sectors.” Nevertheless, according to the U.S. Department of
State, “The majority of Polish banks have been privatized….
The majority of the Polish banking sector’s assets, deposits, and
equity are in the hands of the private sector. Foreign companies
do not have special restrictions on access to local finance as long
as funds are used for activities in Poland.” The insurance sector
is still dominated by the communist-era monopoly provider,
which is now partially privatized.
WAGES AND PRICES
Score:
3–Stable
(moderate level of intervention)
The government has removed a number of price controls but
continues to influence the prices of some products. According
to the Economist Intelligence Unit, “Official prices apply
under the following conditions and products: (1) to goods or
services when there are substantial threats to the proper func-
tioning of the economy as specified by the Council of
Ministers; (2) to pharmaceutical and medical materials that
are covered by health insurance; and (3) to prices for taxi ser-
vices…. [U]tility prices [are subject to] supervision if the
provider is market dominating….” A mandated minimum
wage is adjusted every three months through negotiations
involving the government, the unions, and employers.
PROPERTY RIGHTS
Score:
3–Worse
(moderate level of protection)
The threat of expropriation is low, but recent corruption
scandals have revealed serious weaknesses in Poland’s judi-
cial system. The transformation from communism to
democracy, reports the Financial Times, did not guarantee
that democratic institutions would function properly.
“Institutions were imported from the west without making
sure they could function. For example, the courts are nomi-
nally independent, but, in practice, underpaid officials are
often subject to corrupt influences.” According to the U.S.
Department of State, “Many investors—foreign and domes-
tic—complain about the slowness of the judicial system….
[I]nvestors often voice concern about frequent or unexpect-
ed issuance of or changes in laws and regulations.” Based
on new evidence of corruption in the judiciary, Poland’s
property rights score is 1 point worse this year.
REGULATION
Score:
3–Stable
(moderate level)
According to the U.S. Department of State, “The government
acknowledges that its policies are not as transparent as they
ought to be and that bureaucratic requirements continue to
impose a burden on investors.… [U]neven and unpredictable
regulatory treatment and a generally high level of adminis-
trative ‘red tape’ are recurring complaints of investors….” In
addition, “investors must comply with a variety of laws con-
cerning…taxation, labor practices, health and safety, and the
environment. Complaints about these laws, especially the tax
system, center on the lack of clarity and often-draconian
penalties for minor errors.”
INFORMAL MARKET
Score:
3.5–Stable
(high level of activity)
Transparency International’s 2001 score for Poland is 4.
Therefore, Poland’s informal market score is 3.5 this year.
332
2004 Index of Economic Freedom
Wyszukiwarka
Podobne podstrony:
Education in Poland
Kodeks Etyki ICOM poland
poland07 Medycyna komórkowa
Introduction to Lean for Poland
Instrukcja IEF Algorytmy i struktury danych lab2
DIMENSIONS OF INTEGRATION MIGRANT YOUTH IN POLAND
Hinduizm made in Poland, EDUKACJA różne...)
Lecture POLAND Competitiv2008
pdf poland pilkington
cw 7 skrypt fizjo ifmsa poland
Poland and?lsifications of Polish History
Images of Poland
The Solidarity movement in Poland
The?ginning of World War II German Invasion of Poland
Chopin Poland's Greatest Composer
Lekturki, Internet in Poland - Lekturka
więcej podobnych podstron