
521
CHAPTER 37
WEATHER OBSERVATIONS
BASICS OF WEATHER OBSERVATIONS
3700. Introduction
Weather forecasts are generally based upon informa-
tion acquired by observations made at a large number of
stations. Ashore, these stations are located so as to provide
adequate coverage of the area of interest. Most observations
at sea are made by mariners, wherever they happen to be.
Since the number of observations at sea is small compared
to the number ashore, marine observations are of great im-
portance. Data recorded by designated vessels are sent by
radio to weather centers ashore, where they are plotted,
along with other observations, to provide data for drawing
synoptic charts, which are used to make forecasts. Com-
plete weather information gathered at sea by cooperating
vessels is mailed to the appropriate meteorological services
for use in the preparation of weather atlases and in marine
climatological studies.
A special effort should be made to provide routine syn-
optic reports when transiting areas where few ships are
available to report weather observations. This effort is par-
ticularly important in the tropics, where a vessel’s synoptic
weather report may be one of the first indications of a de-
veloping tropical cyclone. Even with satellite imagery,
actual reports are needed to confirm suspicious patterns and
provide actual temperature, pressure, and other measure-
ments. Forecasts can be no better than the data received.
3701. Atmospheric Pressure
The sea of air surrounding the earth exerts a pressure of
about 14.7 pounds per square inch on the surface of the
earth. This atmospheric pressure, sometimes called baro-
metric pressure, varies from place to place, and at the
same place it varies over time.
Atmospheric pressure is one of the most basic elements
of a meteorological observation. When the pressure at each
station is plotted on a synoptic chart, lines of equal atmo-
spheric pressure, called isobars, indicate the areas of high
and low pressure. These are useful in making weather pre-
dictions, because certain types of weather are characteristic
of each type of area, and the wind patterns over large areas
can be deduced from the isobars.
Atmospheric pressure is measured with a barometer.
A mercurial barometer measures pressure by balancing
the weight of a column of air against that of a column of
mercury. The aneroid barometer has a partly evacuated,
thin metal cell which is compressed by atmospheric pres-
sure; slight changes in air pressure cause the cell to expand
or contract, while a system of levers magnifies and converts
this motion to a reading on a gage or recorder.
Early mercurial barometers were calibrated to indicate
the height, usually in inches or millimeters, of the column
of mercury needed to balance the column of air above the
point of measurement. While units of inches and millime-
ters are still widely used, many modern barometers are
calibrated to indicate the centimeter-gram-second unit of
pressure, the millibar, which is equal to 1,000 dynes per
square centimeter. A dyne is the force required to accelerate
a mass of one gram at the rate of one centimeter per second
per second. A reading in any of the three units of measure-
ment can be converted to the equivalent reading in either of
the other units by means of tables, or the conversion factors
given in the appendix. However, the pressure reading
should always be reported in millibars.
3702. The Barometer
The mercurial barometer was invented by Evangelis-
ta Torricelli in 1643. In its simplest form it consists of a
glass tube a little more than 30 inches in length and of uni-
form internal diameter. With one end closed, the tube is
filled with mercury, and inverted into a cup of mercury. The
mercury in the tube falls until the column is just supported
by the pressure of the atmosphere on the open cup, leaving
a vacuum at the upper end of the tube. The height of the col-
umn indicates atmospheric pressure, greater pressures
supporting higher columns of mercury.
The mercurial barometer is subject to rapid variations
in height, called pumping, due to pitch and roll of the ves-
sel and temporary changes in atmospheric pressure in the
vicinity of the barometer. Because of this, plus the care re-
quired in the reading the instrument, its bulkiness, and its
vulnerability to physical damage, the mercurial barometer
has been replaced at sea by the aneroid barometer.
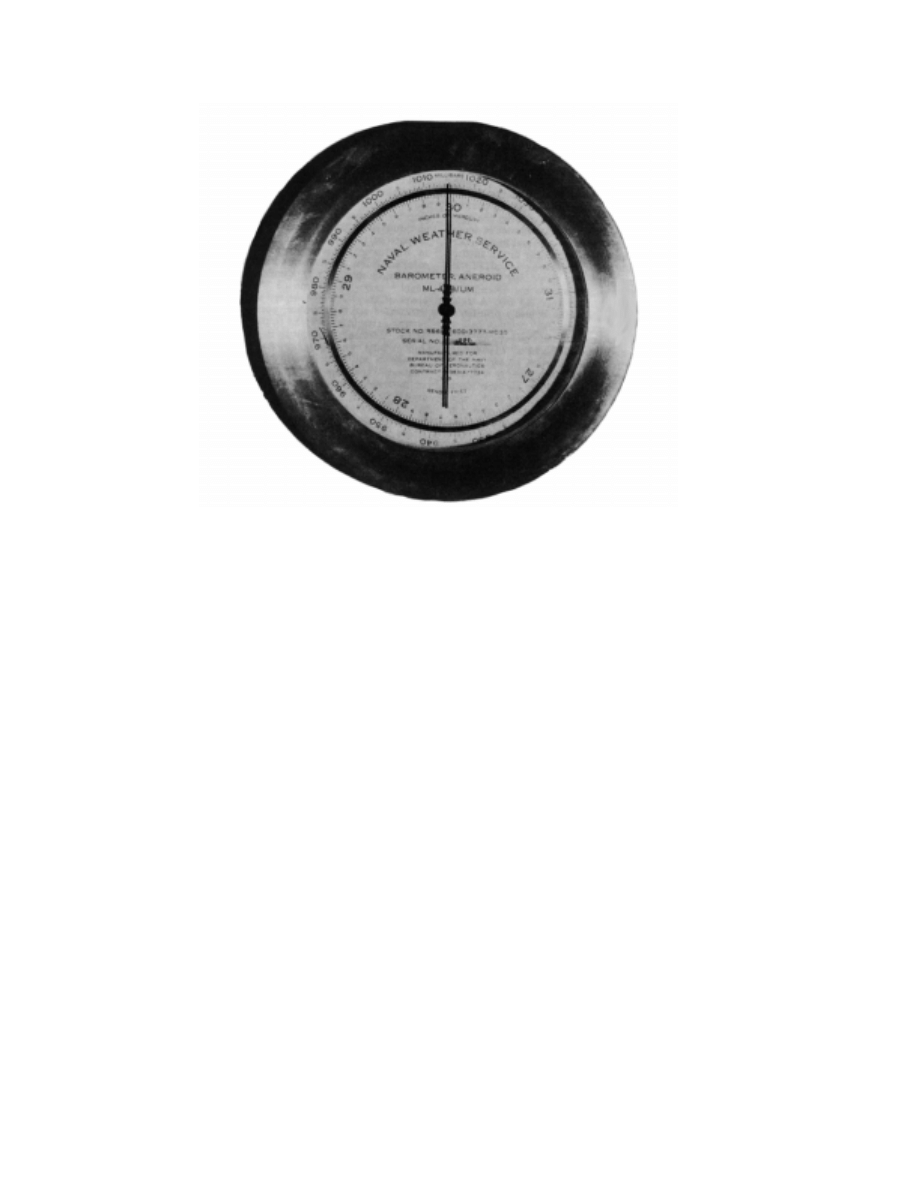
3703. The Aneroid Barometer
The aneroid barometer measures the force exerted by
atmospheric pressure on a partly evacuated, thin-metal ele-
ment called a sylphon cell (aneroid capsule). A small spring
is used, either internally or externally, to partly counteract
the tendency of the atmospheric pressure to crush the cell.
522
WEATHER OBSERVATIONS
Atmospheric pressure is indicated directly by a scale
and a pointer connected to the cell by a combination of le-
vers. The linkage provides considerable magnification of
the slight motion of the cell, to permit readings to higher
precision than could be obtained without it.
An aneroid barometer should be mounted permanent-
ly. Prior to installation, the barometer should be carefully
set. U.S. ships of the Voluntary Observing Ship (VOS) pro-
gram are set to sea level pressure. Other vessels may be set
to station pressure and corrected for height as necessary. An
adjustment screw is provided for this purpose. The error of
the instrument is determined by comparison with a mercu-
rial barometer or a standard precision aneroid barometer. If
a qualified meteorologist is not available to make this ad-
justment, adjust by first removing only one-half the
apparent error. The tap the case gently to assist the linkage
to adjust itself, and repeat the adjustment. If the remaining
error is not more than half a millibar (0.015 inch), no at-
tempt should be made to remove it by further adjustment.
Instead, a correction should be applied to the readings. The
accuracy of this correction should be checked from time to
time.
3704. The Barograph
The barograph is a recording barometer. In principle
it is the same as a nonrecording aneroid barometer except
that the pointer carries a pen at its outer end, and the scale
is replaced by a slowly rotating cylinder around which a
chart is wrapped. A clock mechanism inside the cylinder ro-
tates the cylinder so that a continuous line is traced on the
chart to indicate the pressure at any time.
The barograph is usually mounted on a shelf or desk in
a room open to the atmosphere, in a location which mini-
mizes the effect of the ship’s vibration. Shock-absorbing
material such as sponge rubber may be placed under the in-
strument to minimize vibration.
The pen should be checked and the inkwell filled each
time the chart is changed.
A marine microbarograph is a precision barograph
using greater magnification and an expanded chart. It is de-
signed to maintain its precision through the conditions
encountered aboard ship. Two sylphon cells are used, one
mounted over the other in tandem. Minor fluctuations due
to shocks or vibrations are eliminated by damping. Since
oil-filled dashpots are used for this purpose, the instrument
should never be inverted. The dashpots of the mi-
crobarograph should be kept filled with dashpot oil to
within three-eighths inch of the top.
Ship motions are compensated by damping and spring
loading which make it possible for the microbarograph to
be tilted up to 22
°
without varying more than 0.3 millibars
from true reading. Microbarographs have been almost en-
tirely replaced by standard barographs.
Both instruments require checking from time to time to
insure correct indication of pressure. The position of the
pen is adjusted by a small knob provided for this purpose.
The adjustment should be made in stages, eliminating half
the apparent error, tapping the case to insure linkage adjust-
ment to the new setting, and then repeating the process.
Figure 3703. An aneroid barometer.

WEATHER OBSERVATIONS
523
3705. Adjusting Barometer Readings
Atmospheric pressure as indicated by a barometer or
barograph may be subject to several errors.
Instrument error: Inaccuracy due to imperfection or
incorrect adjustment can be determined by comparison with
a standard precision instrument. The National Weather Ser-
vice provides a comparison service. In major U. S. ports a
Port Meteorological Officer carries a portable precision an-
eroid barometer for barometer comparisons on board ships
which participate in the Voluntary Observing Ship (VOS)
program of the National Weather Service. The portable ba-
rometer is compared with station barometers before and
after a ship visit. If a barometer is taken to a National
Weather Service shore station, the comparison can be made
there. The correct sea-level pressure can also be obtained by
telephone. The shipboard barometer should be corrected for
height, as explained below, before comparison with this
value. If there is reason to believe that the barometer is in
error, it should be compared with a standard, and if an error
is found, the barometer should be adjusted to the correct
reading, or a correction applied to all readings.
Height error: The atmospheric pressure reading at the
height of the barometer is called the station pressure and
is subject to a height correction in order to make it a sea lev-
el pressure reading. Isobars adequately reflect wind
conditions and geographic distribution of pressure only
when they are drawn for pressure at constant height (or the
varying height at which a constant pressure exists). On syn-
optic charts it is customary to show the equivalent pressure
at sea level, called sea level pressure. This is found by ap-
plying a correction to station pressure. The correction
depends upon the height of the barometer and the average
temperature of the air between this height and the surface.
The outside air temperature taken aboard ship is sufficiently
accurate for this purpose. This is an important correction
which should be applied to all readings of any type barom-
eter. See Table 31 for this correction.
Gravity error: Mercurial barometers are calibrated for
standard sea-level gravity at latitude 45
°
32’40". If the gravity
differs from this amount, an error is introduced. The correc-
tion to be applied to readings at various latitudes is given in
Table 32. This correction does not apply to readings of an an-
eroid barometer or microbarograph. Gravity also changes
with height above sea level, but the effect is negligible for the
first few hundred feet, and so is not needed for readings taken
aboard ship. See Table 32 for this correction.
Temperature error: Barometers are calibrated at a
standard temperature of 32
°
F. The liquid of a mercurial ba-
rometer expands as the temperature of the mercury rises, and
contracts as it decreases. The correction to adjust the reading
of the instrument to the true value is given in Table 33. This
correction is applied to readings of mercurial barometers
only. Modern aneroid barometers are compensated for tem-
perature changes by the use of different metals having
unequal coefficients of linear expansion.
3706. Temperature
Temperature is a measure of heat energy, measured in
degrees. Several different temperature scales are in use.
On the Fahrenheit (F) scale pure water freezes at 32
°
and boils at 212
°
.
On the Celsius (C) scale commonly used with the met-
ric system, the freezing point of pure water is 0
°
and the
boiling point is 100
°
. This scale, has been known by various
names in different countries. In the United States it was for-
merly called the centigrade scale. The Ninth General
Conference of Weights and Measures, held in France in
1948, adopted the name Celsius to be consistent with the
naming of other temperature scales after their inventors,
and to avoid the use of different names in different coun-
tries. On the original Celsius scale, invented in 1742 by a
Swedish astronomer named Anders Celsius, numbering
was the reverse of the modern scale, 0
°
representing the
boiling point of water, and 100
°
its freezing point.
Absolute zero is considered to be the lowest possible
temperature, at which there is no molecular motion and a
body has no heat. For some purposes, it is convenient to ex-
press temperature by a scale at which 0
°
is absolute zero.
This is called absolute temperature. If Fahrenheit degrees
are used, it may be called Rankine (R) temperature; and if
Celsius, Kelvin (K) temperature. The Kelvin scale is more
widely used than the Rankine. Absolute zero is –459.69
°
F
or –273.16
°
C.
Temperature of one scale can be easily converted to an-
other because of the linear mathematical relationship
between them. Note that the sequence of calculation is
slightly different; algebraic rules must be followed.
A temperature of –40
°
is the same by either the Celsius
or Fahrenheit scale. Similar formulas can be made for con-
version of other temperature scale readings. The Conversion
Table for Thermometer Scales (Table 29) gives the equiva-
lent values of Fahrenheit, Celsius, and Kelvin temperatures.
The intensity or degree of heat (temperature) should not
be confused with the amount of heat. If the temperature of air
or some other substance is to be increased (the substance made
hotter) by a given number of degrees, the amount of heat that
must be added is dependent upon the amount of the substance
to be heated. Also, equal amounts of different substances re-
quire the addition of unequal amounts of heat to effect an equal
increase in temperature because of their difference of specific
heat. Units used for measurement of amount of heat are the
C
5
9
--- F
32
–
(
)
, or
=
C
F
32
–
1.8
---------------
=
F
9
5
---C
32 or
,
+
=
F
1.8
C
32
+
=
K
C
273.16
+
=
R
F
459.69
+
=

524
WEATHER OBSERVATIONS
British thermal unit (BTU), the amount of heat needed to
raise the temperature of 1 pound of water 1
°
Fahrenheit; and
the calorie, the amount of heat needed to raise the temperature
of 1 gram of water 1
°
Celsius.
3707. Temperature Measurement
Temperature is measured with a thermometer. Most
thermometers are based upon the principle that materials ex-
pand with an increase of temperature, and contract as
temperature decreases. In its most usual form a thermometer
consists of a bulb filled with mercury and connected to a tube
of very small cross-sectional area. The mercury only partly
fills the tube. In the remainder is a vacuum. Air is driven out
by boiling the mercury, and the top of the tube is then sealed.
As the mercury expands or contracts with changing temper-
ature, the length of the mercury column in the tube changes.
Sea surface temperature observations are used in the
forecasting of fog and furnish important information about
the development and movement of tropical cyclones. Com-
mercial fishermen are interested in the sea surface
temperature as an aid in locating certain species of fish.
There are several methods of determining seawater temper-
ature. These include engine room intake readings, condenser
intake readings, thermistor probes attached to the hull, and
readings from buckets recovered from over the side. Al-
though the condenser intake method is not a true measure of
surface water temperature, the error is generally small.
If the surface temperature is desired, a sample should
be obtained by bucket, preferably a canvas bucket, from a
forward position well clear of any discharge lines. The sam-
ple should be taken immediately to a place where it is
sheltered from wind and sun. The water should then be
stirred with the thermometer, keeping the bulb submerged,
until a constant reading is obtained.
A considerable variation in sea surface temperature can
be experienced in a relatively short distance of travel. This
is especially true when crossing major ocean currents such
as the Gulf Stream and the Kuroshio Current. Significant
variations also occur where large quantities of freshwater
are discharged from rivers. A clever navigator will note
these changes as in indication of when to allow for set and
drift in dead reckoning.
3708. Humidity
Humidity is a measure of the atmosphere’s water vapor
content. Relative humidity is the ratio, stated as a percent-
age, of the pressure of water vapor present in the atmosphere
to the saturation vapor pressure at the same temperature.
As air temperature decreases, the relative humidity in-
creases. At some point, saturation takes place, and any further
cooling results in condensation of some of the moisture. The
temperature at which this occurs is called the dew point, and
the moisture deposited upon objects is called dew if it forms in
the liquid state, or frost if it forms in the frozen state.
The same process causes moisture to form on the out-
side of a container of cold liquid, the liquid cooling the air
in the immediate vicinity of the container until it reaches the
dew point. When moisture is deposited on man-made ob-
jects, it is usually called sweat. It occurs whenever the
temperature of a surface is lower than the dew point of air
in contact with it. It is of particular concern to the mariner
because of its effect upon his instruments, and possible
damage to his ship or its cargo. Lenses of optical instru-
ments may sweat, usually with such small droplets that the
surface has a “frosted” appearance. When this occurs, the
instrument is said to “fog” or “fog up,” and is useless until
the moisture is removed. Damage is often caused by corro-
sion or direct water damage when pipes sweat and drip, or
when the inside of the shell plates of a vessel sweat. Cargo
may sweat if it is cooler than the dew point of the air.
Clouds and fog form from condensation of water on
minute particles of dust, salt, and other material in the air.
Each particle forms a nucleus around which a droplet of wa-
ter forms. If air is completely free from solid particles on
which water vapor may condense, the extra moisture re-
mains in the vapor state, and the air is said to be
supersaturated.
Relative humidity and dew point are measured with a hy-
grometer. The most common type, called a psychrometer,
consists of two thermometers mounted together on a single
strip of material. One of the thermometers is mounted a little
lower than the other, and has its bulb covered with muslin.
When the muslin covering is thoroughly moistened and the
thermometer well ventilated, evaporation cools the bulb of the
thermometer, causing it to indicate a lower reading than the
other. A sling psychrometer is ventilated by whirling the
thermometers. The difference between the dry-bulb and wet-
bulb temperatures is used to enter psychrometric tables (Ta-
ble 35 and Table 36) to find the relative humidity and dew
point. If the wet-bulb temperature is above freezing, reason-
ably accurate results can be obtained by a psychrometer
consisting of dry- and wet-bulb thermometers mounted so
that air can circulate freely around them without special ven-
tilation. This type of installation is common aboard ship.
Example: The dry-bulb temperature is 65
°
F, and the
wet-bulb temperature is 61
°
F.
Required: (1) Relative humidity, (2) dew point.
Solution: The difference between readings is 4
°
. En-
tering Table 35 with this value, and a dry-bulb temperature
of 65
°
, the relative humidity is found to be 80 percent. From
Table 36 the dew point is 58
°
.
Answers: (1) Relative humidity 80 percent, (2) dew
point 58
°
.
Also in use aboard many ships is the electric psy-
chrometer. This is a hand held, battery operated instrument
with two mercury thermometers for obtaining dry- and wet-
bulb temperature readings. It consists of a plastic housing
that holds the thermometers, batteries, motor, and fan.
WEATHER OBSERVATIONS
525
3709. Wind Measurement
Wind measurement consists of determination of the di-
rection and speed of the wind. Direction is measured by a
wind vane, and speed by an anemometer.
Several types of wind speed and direction sensors are
available, using vanes to indicate wind direction and rotat-
ing cups or propellers for speed sensing. Many ships have
reliable wind instruments installed, and inexpensive wind
instruments are available for even the smallest yacht. If no
anemometer is available, wind speed can be estimated by its
effect upon the sea and nearby objects. The direction can be
computed accurately, even on a fast moving vessel, by ma-
neuvering board or Table 30.
3710. True And Apparent Wind
An observer aboard a vessel proceeding through still air
experiences an apparent wind which is from dead ahead and
has an apparent speed equal to the speed of the vessel. Thus,
if the actual or true wind is zero and the speed of the vessel is
10 knots, the apparent wind is from dead ahead at 10 knots.
If the true wind is from dead ahead at 15 knots, and the speed
of the vessel is 10 knots, the apparent wind is 15 + 10 = 25
knots from dead ahead. If the vessel reverses course, the ap-
parent wind is 15 – 10 = 5 knots, from dead astern.
The apparent wind is the vector sum of the true wind
and the reciprocal of the vessel’s course and speed vector.
Since wind vanes and anemometers measure apparent
wind, the usual problem aboard a vessel equipped with an
anemometer is to convert apparent wind to true wind. There
are several ways of doing this. Perhaps the simplest is by
the graphical solution illustrated in the following example:
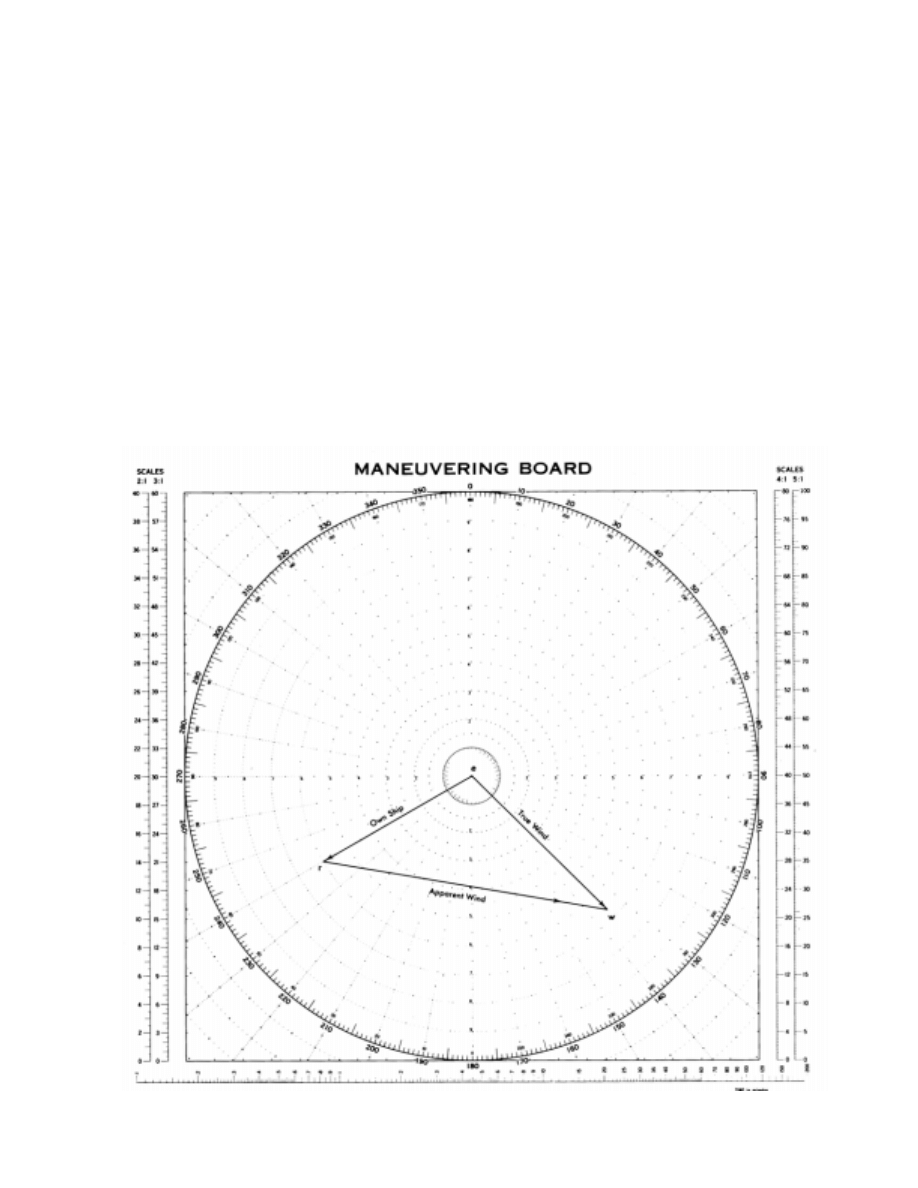
Example 1: A ship is proceeding on course 240
°
at a
speed of 18 knots. The apparent wind is from 040
°
relative
at 30 knots.
Required: The direction and speed of the true wind.
Figure 3710. Finding true wind by Maneuvering Board.

526
WEATHER OBSERVATIONS
Solution: First starting from the center of a maneuver-
ing board, plot the ship’s vector er, at 240
°
, length 18 knots
(using the 3–1 scale). Next plot the relative wind’s vector
from r, in a direction of 100
°
(the reciprocal of 280
°
) length
30 knots. The true wind is from the center to the end of this
vector or line ew.
Alternatively, you can plot the ship’s vector from the
center, then plot the relative wind’s vector toward the cen-
ter, and see the true wind’s vector from the end of this line
to the end of the ship’s vector. Use parallel rulers to trans-
fer the wind vector to the center for an accurate reading.
Answer: True wind is from 315
°
at 20 knots.
On a moving ship, the direction of the true wind is al-
ways on the same side and aft of the direction of the
apparent wind. The faster the ship moves, the more the ap-
parent wind draws ahead of the true wind.
Solution can also be made without plotting, in the fol-
lowing manner: On a maneuvering board, label the circles 5,
10, 15, 20, etc., from the center, and draw vertical lines tan-
gent to these circles. Cut out the 5:1 scale and discard that
part having graduations greater than the maximum speed of
the vessel. Keep this sheet for all solutions. (For durability,
the two parts can be mounted on cardboard or other suitable
material.) To find true wind, spot in point 1 by eye. Place the
zero of the 5:1 scale on this point and align the scale (invert-
ed) using the vertical lines. Locate point 2 at the speed of the
vessel as indicated on the 5:1 scale. It is always vertically be-
low point 1. Read the relative direction and the speed of the
true wind, using eye interpolation if needed.
A tabular solution can be made using Table 30, Direc-
tion and Speed of True Wind in Units of Ship’s Speed. The
entering values for this table are the apparent wind speed in
units of ship’s speed, and the difference between the head-
ing and the apparent wind direction. The values taken from
the table are the relative direction (right or left) of the true
wind, and the speed of the true wind in units of ship’s speed.
If a vessel is proceeding at 12 knots, 6 knots constitutes
one-half (0.5) unit, 12 knots one unit, 18 knots 1.5 units, 24
knots two units, etc.
Example 2: A ship is proceeding on course 270
°
at a
speed of 10 knots. The apparent wind is from 10
°
off the
port bow, speed 30 knots.
Required: The relative direction, true direction, and
speed of the true wind by table.
Solution: The apparent wind speed is
Enter Table 30 with 3.0 and 10
°
and find the relative direc-
tion of the true wind to be 15
°
off the port bow (345
°
relative),
and the speed to be 2.02 times the ship’s speed, or 20 knots, ap-
proximately. The true direction is 345
°
+ 270
°
= 255
°
.
Answers: True wind from 345
°
relative = 255
°
true, at
20 knots.
By variations of this problem, one can find the appar-
ent wind from the true wind, the course or speed required
to produce an apparent wind from a given direction or
speed, or the course and speed to produce an apparent
wind of a given speed from a given direction. Such prob-
lems often arise in aircraft carrier operations and in some
rescue situations. See “Pub. 217, Maneuvering Board
Manual”, for more detailed information.
When wind speed and direction are determined by the
appearance of the sea, the result is true speed and direc-
tion. Waves move in the same direction as the generating
wind, and are not deflected by earth’s rotation. If a wind
vane is used, the direction of the apparent wind thus deter-
mined can be used with the speed of the true wind to
determine the direction of the true wind by vector diagram.
WIND AND WAVES
3711. Effects Of Wind On The Sea
There is a direct relationship between the speed of the
wind and the state of the sea. This is useful in predicting the
sea conditions to be anticipated when future wind speed
forecasts are available. It can also be used to estimate the
speed of the wind, which may be necessary when an ane-
mometer is not available.
Wind speeds are usually grouped in accordance with the
Beaufort scale, named after Admiral Sir Francis Beaufort
(1774-1857), who devised it in 1806. As adopted in 1838,
Beaufort numbers ranged from 0 (calm) to 12 (hurricane). The
Beaufort wind scale and sea state photographs which are at the
end of this chapter can be used to estimate wind speed.
These pictures (courtesy of Environment Canada)
present the results of a project carried out on board the Ca-
nadian Ocean Weather Ships VANCOUVER and
QUADRA at Ocean Weather Station PAPA (50
°
N.,
145
°
W), between April 1976 and May 1981. The aim of the
project was to collect color photographs of the sea surface
as it appears under the influence of the various ranges of
wind speed, as defined by The Beaufort Scale of Wind
Force. The photographs represent as closely as possible
steady-state sea conditions over many hours for each Beau-
fort wind force, except Force 12, for which no photographs
are available. They were taken from heights ranging from
12-17 meters above the sea surface; anemometer height was
28 meters.
30
10
------
3.0
ships speed units
=

WEATHER OBSERVATIONS
527
3712. Estimating The Wind At Sea
Observers on board ships at sea usually determine the
speed of the wind by estimating Beaufort Force, as mer-
chant ships may not be equipped with wind measuring
instruments. Through experience, ships’ officers have de-
veloped various methods of estimating this force. The
effect of the wind on the observer himself, the ship’s rig-
ging, flags, etc., is used as a guide, but estimates based on
these indications give the relative wind which must be cor-
rected for the motion of the ship before an estimate of the
true wind speed can be obtained.
The most common method involves the appearance of
the sea surface. The state of the sea disturbance, i.e. the di-
mensions of the waves, the presence of white caps, foam, or
spray, depends principally on three factors:
1. The wind speed. The higher the speed of the wind,
the greater is the sea disturbance.
2. The wind’s duration. At any point on the sea, the
disturbance will increase the longer the wind blows
at a given speed, until a maximum state of distur-
bance is reached.
3. The fetch. This is the length of the stretch of water
over which the wind acts on the sea surface from
the same direction.
For a given wind speed and duration, the longer the
fetch, the greater is the sea disturbance. If the fetch is short,
such as a few miles, the disturbance will be relatively small
no matter how great the wind speed is or how long it has
been blowing.
There are other factors which can modify the appear-
ance of the sea surface caused by wind alone. These are
strong currents, shallow water, swell, precipitation, ice, and
wind shifts. Their effects will be described later.
A wind of a given Beaufort Force will, therefore, pro-
duce a characteristic appearance of the sea surface provided
that it has been blowing for a sufficient length of time, and
over a sufficiently long fetch.
In practice, the mariner observes the sea surface, not-
ing the size of the waves, the white caps, spindrift, etc., and
then finds the criterion which best describes the sea surface
as he saw it. This criterion is associated with a Beaufort
number, for which a corresponding mean wind speed and
range in knots are given. Since meteorological reports re-
quire that wind speeds be reported in knots, the mean speed
for the Beaufort number may be reported, or an experienced
observer may judge that the sea disturbance is such that a
higher or lower speed within the range for the force is more
accurate.
This method should be used with caution. The sea con-
ditions described for each Beaufort Force are “steady-state”
conditions; i.e. the conditions which result when the wind
has been blowing for a relatively long time, and over a great
stretch of water. At any particular time at sea, though, the
duration of the wind or the fetch, or both, may not have
been great enough to produce these “steady-state” condi-
tions. When a high wind springs up suddenly after
previously calm or near calm conditions, it will require
some hours, depending on the strength of the wind, to gen-
erate waves of maximum height. The height of the waves
increases rapidly in the first few hours after the commence-
ment of the blow, but increases at a much slower rate later
on.
At the beginning of the fetch (such as at a coastline
when the wind is offshore) after the wind has been blowing
Beaufort
force of
wind.
Theoretical
maximum wave
height (ft)
unlimited duration
and fetch.
Duration of winds, (hours),
with unlimited fetch, to
produce percent of maxi-
mum wave height indicated.
Fetch (nautical miles), with
unlimited duration of
blow, to produce percent
of maximum wave height
indicated.
50%
75%
90%
50%
75%
90%
3
2
1.5
5
8
3
13
25
5
8
3.5
8
12
10
30
60
7
20
5.5
12
21
22
75
150
9
40
7
16
25
55
150
280
11
70
9
19
32
85
200
450
Table 3712. Duration of winds and length of fetches required for various wind forces.

528
WEATHER OBSERVATIONS
for a long time, the waves are quite small near shore, and in-
crease in height rapidly over the first 50 miles or so of the
fetch. Farther offshore, the rate of increase in height with
distance slows down, and after 500 miles or so from the be-
ginning of the fetch, there is little or no increase in height.
Table 3712 illustrates the duration of winds and the
length of fetches required for various wind forces to build
seas to 50 percent, 75 percent, and 90 percent of their theo-
retical maximum heights.
The theoretical maximum wave heights represent the
average heights of the highest third of the waves, as these
waves are most significant.
It will be seen that winds of force 5 or less can build seas
to 90 percent of their maximum height, in less than 12 hours,
provided the fetch is long enough. Higher winds require a
much greater time-force 11 winds requiring 32 hours to build
waves to 90 percent of their maximum height. The times given
in Table 3712 represent those required to build waves starting
from initially calm sea conditions. If waves are already present
at the onset of the blow, the times would be somewhat less de-
pending on the initial wave heights and their direction relative
to the direction of the wind which has sprung up.
The first consideration when using the sea criterion to
estimate wind speed, therefore, is to decide whether the
wind has been blowing long enough from the same direc-
tion to produce a steady state sea condition. If not, then it is
possible that the wind speed may be underestimated.
Experience has shown that the appearance of white-
caps, foam, spindrift, etc., reaches a steady state condition
before the height of the waves attain their maximum value.
It is a safe assumption that the appearance of the sea (such
as white-caps, etc.) will reach a steady state in the time re-
quired to build the waves to 50-75 percent of their
maximum height. Thus, from Table 3712, it is seen that a
force 5 wind could require 8 hours at most to produce a
characteristic appearance of the sea surface.
A second consideration, when using the sea criterion, is
the length of the fetch over which the wind has been blowing
to produce the present state of the sea. On the open sea, un-
less the mariner has the latest synoptic weather map
available, the length of the fetch will not be known. It will be
seen from Table 3712, though, that only relatively short
fetches are required for the lower wind forces to generate
their characteristic seas. On the open sea, the fetches associ-
ated with most storms and other weather systems are usually
long enough so that even winds up to force 9 can build seas
up to 90 percent or more of their maximum height, providing
the wind blows from the same direction long enough.
When navigating close to a coast, or in restricted wa-
ters, however, it may be necessary to make allowances for
the shorter stretches of water over which the wind blows.
For example, referring to Table 3712, if the ship is 22 miles
from a coast, and an offshore wind with an actual speed of
force 7 is blowing, the waves at the ship will never attain
more than 50 percent of their maximum height for this speed
no matter how long the wind blows. Hence, if the sea crite-
rion were used under these conditions without consideration
of the short fetch, the wind speed would be underestimated.
With an offshore wind, the sea criterion may be used with
confidence if the distance to the coast is greater than the val-
ues given in the extreme right-hand column of Table 3712;
again, provided that the wind has been blowing offshore for
a sufficient length of time.
3713. Special Wind Effects
Tidal and Other Currents: A wind blowing against a
tide or strong current causes a greater sea disturbance than nor-
mal, which may result in an overestimate of the wind speed.
On the other hand, a wind blowing in the same direction as a
tide or strong current causes less sea disturbance than normal,
and may result in an underestimate of the wind speed.
Shallow Water: Waves running into shallow water in-
crease in steepness, and hence, their tendency to break.
With an onshore wind there will, therefore, be more white-
caps over the shallow waters than over the deeper water
farther offshore. It is only over relatively deep water that
the sea criterion can be used with confidence.
Swell: Swell is the name given to waves, generally of
considerable length, which were raised in some distant area
by winds blowing there, and which have moved into the vi-
cinity of the ship; or to waves raised nearby and which
continue to advance after the wind at the ship has abated or
changed direction. The direction of swell waves is usually
different from the direction of the wind and the sea waves.
Swell waves are not considered when estimating wind
speed and direction. Only those waves raised by the wind
blowing at the time are of any significance. The wind-driv-
en waves show a greater tendency to break when
superimposed on the crests of swell, and hence, more
whitecaps may be formed than if the swell were absent. Un-
der these conditions, the use of the sea criterion may result
in a slight overestimate of the wind speed.
Precipitation: Heavy rain has a damping or smoothing
effect on the sea surface which must be mechanical in char-
acter. Since the sea surface will therefore appear less
disturbed than would be the case without the rain, the wind
speed may be underestimated unless the smoothing effect is
taken into account.
Ice: Even small concentrations of ice floating on the sea
surface will dampen waves considerably, and concentra-
tions greater than about seven-tenths average will eliminate
waves altogether. Young sea ice, which in the early stages of
formation has a thick soupy consistency, and later takes on
a rubbery appearance, is very effective in dampening waves.
Consequently, the sea criterion cannot be used with any de-
gree of confidence when sea ice is present. In higher
latitudes, the presence of an ice field some distance to wind-
ward of the ship may be suspected if, when the ship is not
close to any coast, the wind is relatively strong but the seas
abnormally underdeveloped. The edge of the ice field acts
like a coastline, and the short fetch between the ice and the

WEATHER OBSERVATIONS
529
ship is not sufficient for the wind to fully develop the seas.
Wind Shifts: Following a rapid change in the direction
of the wind, as occurs at the passage of a cold front, the new
wind will flatten out to a great extent the waves which were
present before the wind shift. This happens because the di-
rection of the wind after the shift may differ by 90
°
or more
from the direction of the waves, which does not change.
Hence, the wind may oppose the progress of the waves and
dampen them out quickly. At the same time, the new wind
begins to generate its own waves on top of this dissipating
swell, and it is not long before the cross pattern of waves
gives the sea a “choppy” or confused appearance. It is dur-
ing the first few hours following the wind shift that the
appearance of the sea surface may not provide a reliable in-
dication of wind speed. The wind is normally stronger than
the sea would indicate, as old waves are being flattened out,
and new waves are beginning to be developed.
Night Observations: On a dark night, when it is im-
possible to see the sea clearly, the observer may estimate
the apparent wind from its effect on the ship’s rigging,
flags, etc., or simply the “feel” of the wind.
CLOUDS
3714. Cloud Formation
Clouds consist of innumerable tiny droplets of water,
or ice crystals, formed by condensation of water vapor
around microscopic particles in the air. Fog is a cloud in
contact with the surface of the earth.
The shape, size, height, thickness, and nature of a cloud
depend upon the conditions under which it is formed.
Therefore, clouds are indicators of various processes occur-
ring in the atmosphere. The ability to recognize different
types, and a knowledge of the conditions associated with
them, are useful in predicting future weather.
Although the variety of clouds is virtually endless, they
may be classified according to general type. Clouds are
grouped generally into three “families” according to com-
mon characteristics. High clouds have a mean lower level
above 20,000 feet. They are composed principally of ice
crystals. Middle clouds have a mean level between 6,500
and 20,000 feet. They are composed largely of water drop-
lets, although the higher ones have a tendency toward ice
particles. Low clouds have a mean lower level of less than
6,500 feet. These clouds are composed entirely of water
droplets.
Within these 3 families are 10 principal cloud types.
The names of these are composed of various combinations
and forms of the following basic words, all from Latin:
Cirrus, meaning “curl, lock, or tuft of hair.”
Cumulus, meaning “heap, a pile, an accumulation.”
Stratus, meaning “spread out, flatten, cover with a
layer.”
Alto, meaning “high, upper air.”
Nimbus, meaning “rainy cloud.”
Individual cloud types recognize certain characteris-
tics, variations, or combinations of these. The 10 principal
cloud types and their commonly used symbols are:
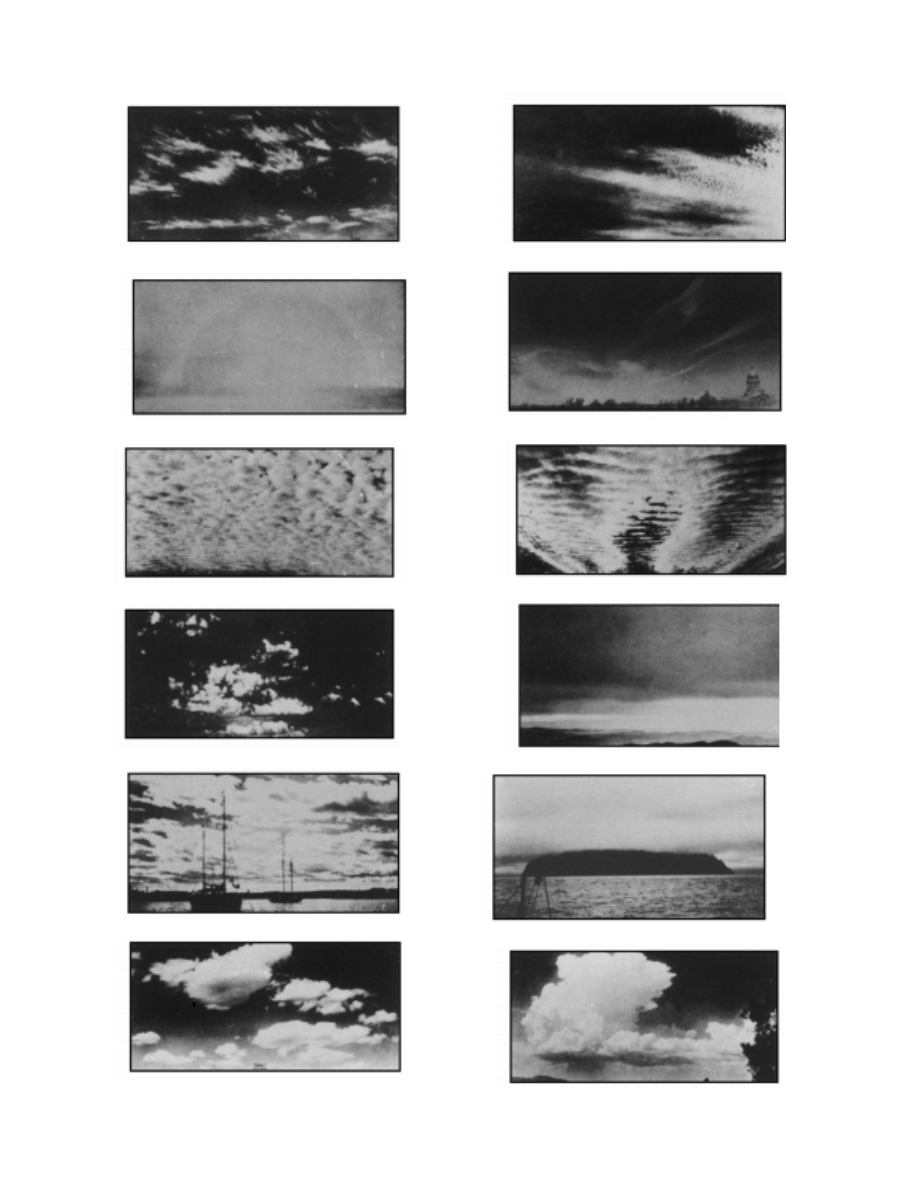
3715. High Clouds
Cirrus (Ci) are detached high clouds of delicate and fi-
brous appearance, without shading, generally white in
color, and often of a silky appearance (Figure 3715a and
Figure 3715d). Their fibrous and feathery appearance is
caused by their composition of ice crystals. Cirrus appear in
varied forms such as isolated tufts; long, thin lines across
the sky; branching, feather-like plumes; curved wisps
which may end in tufts, and other shapes. These clouds may
be arranged in parallel bands which cross the sky in great
circles, and appear to converge toward a point on the hori-
zon. This may indicate the general direction of a low
pressure area. Cirrus may be brilliantly colored at sunrise
and sunset. Because of their height, they become illuminat-
ed before other clouds in the morning, and remain lighted
after others at sunset. Cirrus are generally associated with
fair weather, but if they are followed by lower and thicker
clouds, they are often the forerunner of rain or snow.
Cirrocumulus (Cc) are high clouds composed of
small white flakes or scales, or of very small globular mass-
es, usually without shadows and arranged in groups of
lines, or more often in ripples resembling sand on the sea-
shore (Figure 3715b). One form of cirrocumulus is
popularly known as “mackerel sky” because the pattern re-
sembles the scales on the back of a mackerel. Like cirrus,
cirrocumulus are composed of ice crystals and are generally
associated with fair weather, but may precede a storm if
they thicken and lower. They may turn gray and appear
hard before thickening.
Cirrostratus (Cs) are thin, whitish, high clouds (Fig.
3715c) sometimes covering the sky completely and giving it
a milky appearance and at other times presenting, more or
less distinctly, a formation like a tangled web. The thin veil
is not sufficiently dense to blur the outline of sun or moon.
However, the ice crystals of which the cloud is composed re-
fract the light passing through to form halos with the sun or
moon at the center. Figure 3715d shows cirrus thickening
and changing into cirrostratus. In this form it is popularly
known as “mares’ tails.” If it continues to thicken and lower,
the ice crystals melting to form water droplets, the cloud for-
mation is known as altostratus. When this occurs, rain may
normally be expected within 24 hours. The more brush-like
the cirrus when the sky appears as in Figure 3715d, the stron-
ger wind at the level of the cloud.
530
WEATHER OBSERVATIONS
Figure 3715a. Cirrus.
Figure 3715c. Cirrostratus.
Figure 3716a. Altocumulus in patches.
Figure 3716c. Turreted altocumulus.
Figure 3717a. Stratocumulus.
Figure 3717cCumulus.
Figure 3715b. Cirrocumulus.
Figure 3715d. Cirrus and cirrostratus.
Figure 3716b. Altocumulus in bands.
Figure 3716d. Altostratus.
Figure 3717b. Stratus.
Figure 3717d. Cumulonimbus.

WEATHER OBSERVATIONS
531
3716. Middle Clouds
Altocumulus (Ac) are middle level clouds consisting
of a layer of large, ball-like masses that tend to merge to-
gether. The balls or patches may vary in thickness and color
from dazzling white to dark gray, but they are more or less
regularly arranged. They may appear as distinct patches
(Figure 3716a) similar to cirrocumulus, but can be distin-
guished by having individual patches which are generally
larger, showing distinct shadows in some places. They are
often mistaken for stratocumulus. If altocumulus thickens
and lowers, it may produce thundery weather and showers,
but it does not bring prolonged bad weather. Sometimes the
patches merge to form a series of big rolls resembling ocean
waves, with streaks of blue sky between (Figure 3716b).
Because of perspective, the rolls appear to run together near
the horizon. These regular parallel bands differ from cirroc-
umulus because they occur in larger masses with shadows.
Altocumulus move in the direction of the short dimension
of the rolls, like ocean waves. Sometimes altocumulus ap-
pear briefly in the form shown in Figure 3716c, usually
before a thunderstorm. They are generally arranged in a line
with a flat horizontal base, giving the impression of turrets
on a castle. The turreted tops may look like miniature cu-
mulus and possess considerable depth and great length.
These clouds usually indicate a change to chaotic, thundery
skies.
Altostratus (As) are middle clouds having the appear-
ance of a grayish or bluish, fibrous veil or sheet (Figure
3716d). The sun or moon, when seen through these clouds,
appears as if it were shining through ground glass, with a
corona around it. Halos are not formed. If these clouds
thicken and lower, or if low, ragged “scud” or rain clouds
(nimbostratus) form below them, continuous rain or snow
may be expected within a few hours.
3717. Low Clouds
Stratocumulus (Sc) are low clouds appearing as soft,
gray, roll-shaped masses (Figure 3717a). They may be
shaped in long, parallel rolls similar to altocumulus, mov-
ing forward with the wind. The motion is in the direction of
their short dimension, like ocean waves. These clouds,
which vary greatly in altitude, are the final product of the
characteristic daily change taking place in cumulus clouds.
They are usually followed by clear skies during the night.
Stratus (St) is a low cloud in a uniform layer (Figure
3717b) resembling fog. Often the base is not more than
1,000 feet high. A veil of thin stratus gives the sky a hazy
appearance. Stratus is often quite thick, permitting so little
sunlight to penetrate that it appears dark to an observer be-
low. From above, it is white. Light mist may descend from
stratus. Strong wind sometimes breaks stratus into shreds
called “fractostratus.”
Nimbostratus (Ns) is a low, dark, shapeless cloud lay-
er, usually nearly uniform, but sometimes with ragged, wet-
looking bases. Nimbostratus is the typical rain cloud. The
precipitation which falls from this cloud is steady or inter-
mittent, but not showery.
Cumulus (Cu) are dense clouds with vertical develop-
ment formed by rising air which is cooled as it reaches
greater heights. See Figure 3717c. They have a horizontal
base and dome-shaped upper surface, with protuberances
extending above the dome. Cumulus appear in small patch-
es, and never cover the entire sky. When the vertical
development is not great, the clouds appear in patches re-
sembling tufts of cotton or wool, being popularly called
“woolpack” clouds. The horizontal bases of such clouds
may not be noticeable. These are called “fair weather” cu-
mulus because they commonly accompany good weather.
However, they may merge with altocumulus, or may grow
to cumulonimbus before a thunderstorm. Since cumulus are
formed by updrafts, they are accompanied by turbulence,
causing “bumpiness” in the air. The extent of turbulence is
proportional to the vertical extent of the clouds. Cumulus
are marked by strong contrasts of light and dark.
Cumulonimbus (Cb) is a massive cloud with great
vertical development, rising in mountainous towers to great
heights (Figure 3717d). The upper part consists of ice crys-
tals, and often spreads out in the shape of an anvil which
may be seen at such distances that the base may be below
the horizon. Cumulonimbus often produces showers of
rain, snow, or hail, frequently accompanied by lightning
and thunder. Because of this, the cloud is often popularly
called a “thundercloud” or “thunderhead.” The base is hor-
izontal, but as showers occur it lowers and becomes ragged.
3718. Cloud Height Measurement
At sea, cloud heights are often determined by estimate.
This is a difficult task, particularly at night.
The height of the base of clouds formed by vertical de-
velopment (any form of cumulus), if formed in air that has
risen from the surface of the earth, can be determined by
psychrometer, because the height to which the air must rise
before condensation takes place is proportional to the dif-
ference between surface air temperature and the dew point.
At sea, this difference multiplied by 126.3 gives the height
in meters. That is, for every degree difference between sur-
face air temperature and the dew point, the air must rise
126.3 meters before condensation will take place. Thus, if
the dry-bulb temperature is 26.8
°
C, and the wet-bulb tem-
perature is 25.0
°
C, the dew point is 24
°
C, or 2.8
°
C lower
than the surface air temperature. The height of the cloud
base is 2.8
×
126.3 = 354 meters.

532
WEATHER OBSERVATIONS
OTHER OBSERVATIONS
3719. Visibility Measurement
Visibility is the horizontal distance at which prominent
objects can be seen and identified by the unaided eye. It is
usually measured directly by the human eye. Ashore, the
distances of various buildings, trees, lights, and other ob-
jects can be used as a guide in estimating the visibility. At
sea, however, such an estimate is difficult to make with ac-
curacy. Other ships and the horizon may be of some
assistance. See Table 12, Distance of the Horizon.
Ashore, visibility is sometimes measured by a trans-
missometer, a device which measures the transparency of
the atmosphere by passing a beam of light over a known
short distance, and comparing it with a reference light.
3720. Upper Air Observations
Upper air information provides the third dimension to
the weather map. Unfortunately, the equipment necessary
to obtain such information is quite expensive, and the ob-
servations are time consuming. Consequently, the network
of observing stations is quite sparse compared to that for
surface observations, particularly over the oceans and in
isolated land areas. Where facilities exist, upper air obser-
vations are made by means of unmanned balloons, in
conjunction with theodolites, radiosondes, radar, and radio
direction finders.
3721. New Technologies In Weather Observing
Radar and satellite observations are now almost uni-
versally used to forecast weather for both the short and long
term. New techniques such as Doppler radar, and the inte-
gration of data from many different sites into complex
computer algorithms provide a method of predicting storm
tracks with a high degree of accuracy. Tornadoes, line
squalls, individual thunderstorms, and entire storm systems
can be continuously tracked and their paths predicted with
unprecedented accuracy. At sea, the mariner has immediate
access to this data through facsimile transmission of synop-
tic charts and actual satellite photographs, and through
radio or communications satellite contact with weather
routing services.
Automated weather stations and buoy systems provide
regular transmissions of meteorological and oceanographic
information by radio. They are generally used at isolated
and relatively inaccessible locations from which weather
and ocean data are of great importance. Depending on the
type of system used, the elements usually measured include
wind direction and speed, atmospheric pressure, air and sea
surface temperature, spectral wave data, and a temperature
profile from the sea surface to a predetermined depth.
Regardless of advances in the technology of observing
and forecasting, the shipboard weather report remains the
cornerstone upon which the accuracy of many forecasts is
based. Each of the new observing methods is subject to lim-
itations and occasional failures. The most reliable and
complete source of weather data for offshore areas remains
the shipboard observer.
3722. Recording Observations
Instructions for recording weather observations aboard
vessels of the United States Navy are given in NAVME-
TOCCOMINST 3144.1 (series), Shipboard Weather
Observations. Instructions for recording observations
aboard merchant vessels are given in the National Weather
Service Observing Handbook No. 1, Marine Surface
Observations.
WEATHER OBSERVATIONS
533
Force 0. Wind Speed less than 1 knot.
Sea: Sea like a mirror.
Force 1:Wind Speed 1-3 knots.
Sea: Wave height .1m (.25 ft); Ripples with appearance of scales, no foam crests.
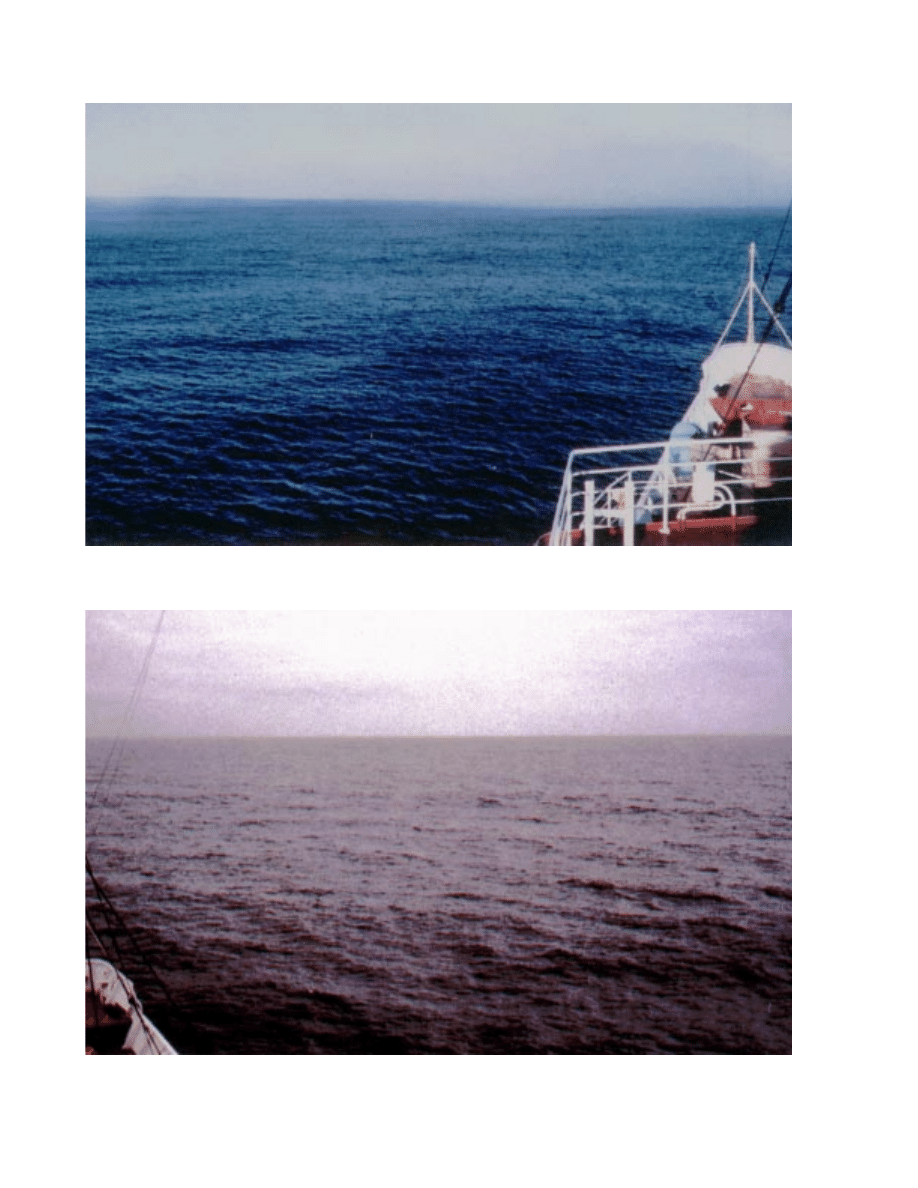
534
WEATHER OBSERVATIONS
Force 2: Wind Speed 4-6 knots.
Sea: Wave height .2-.3m (.5-1 ft); Small wavelets, crests of glassy appearance, not breaking.
Force 3:
Wind Speed 7-10 knots.
Sea: Wave height .6-1m (2-3 ft); Large wavelets, crests begin to break, scattered whitecaps.
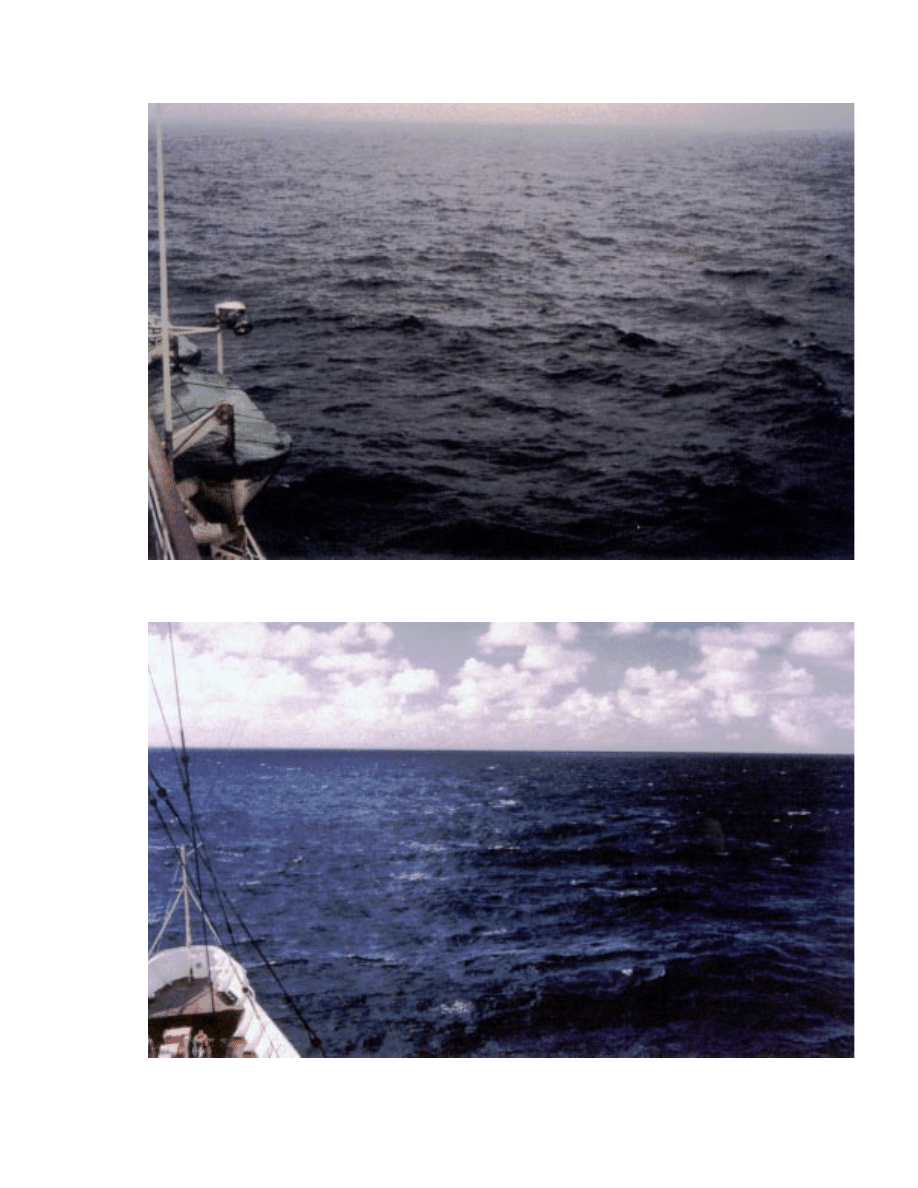
WEATHER OBSERVATIONS
535
Force 4: Wind Speed 11-16 knots.
Sea: Wave height 1-1.5m (3.5-5 ft); Small waves becoming longer, numerous whitecaps.
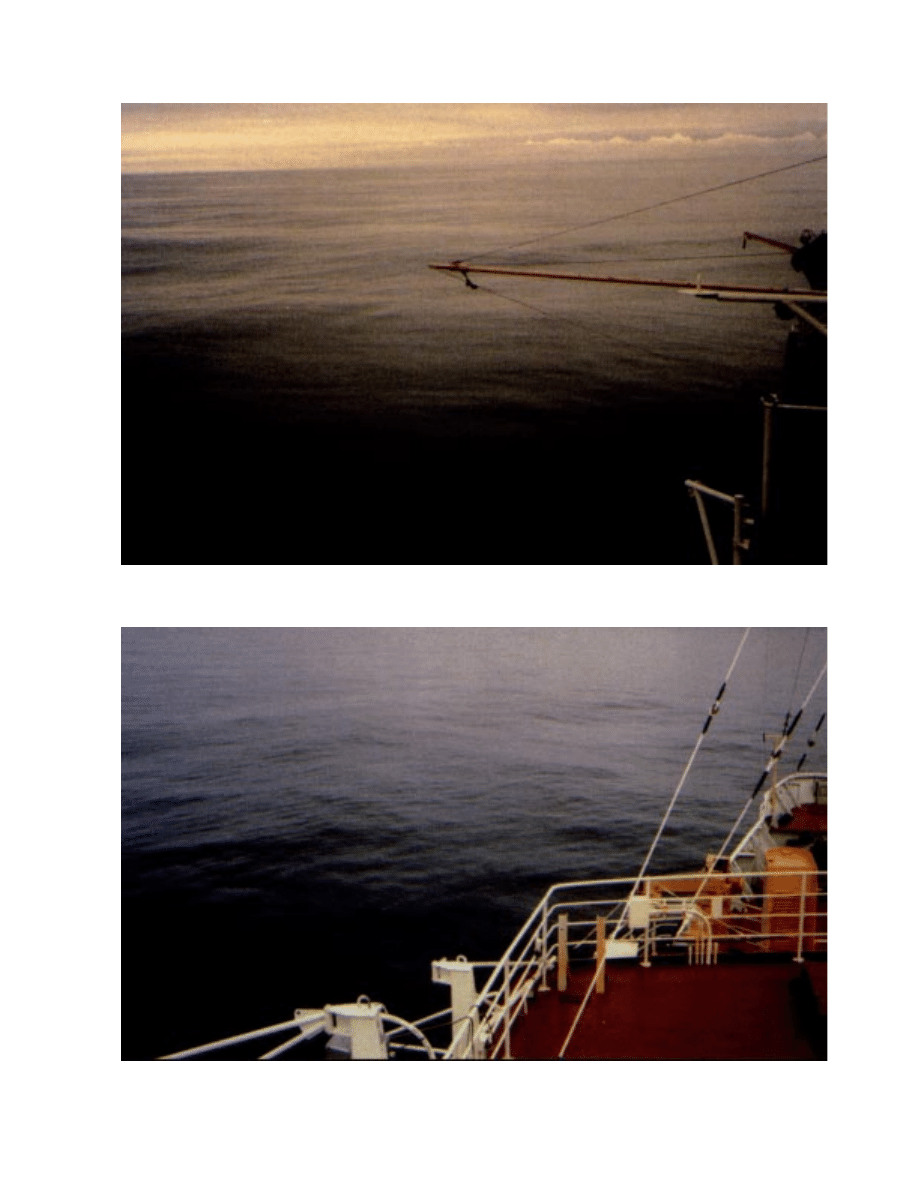
Force 5: Wind Speed 17-21 knots.
Sea: Wave height 2-2.5m (6-8 ft); Moderate waves, taking longer form, many whitecaps, some spray.
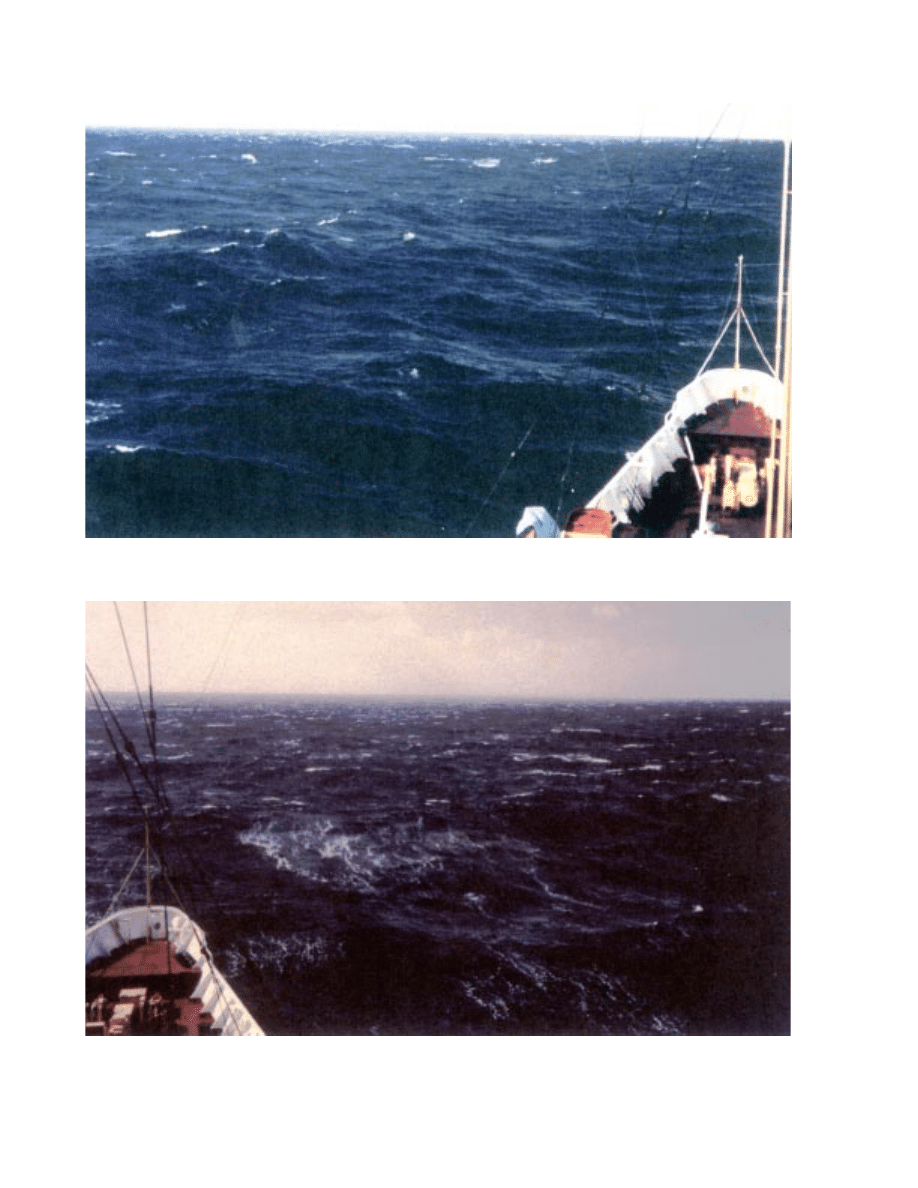
536
WEATHER OBSERVATIONS
Force 6: Wind Speed 22-27 knots.
Sea: Wave height 3-4m (9.5-13 ft); Larger waves forming, whitecaps everywhere, more spray.
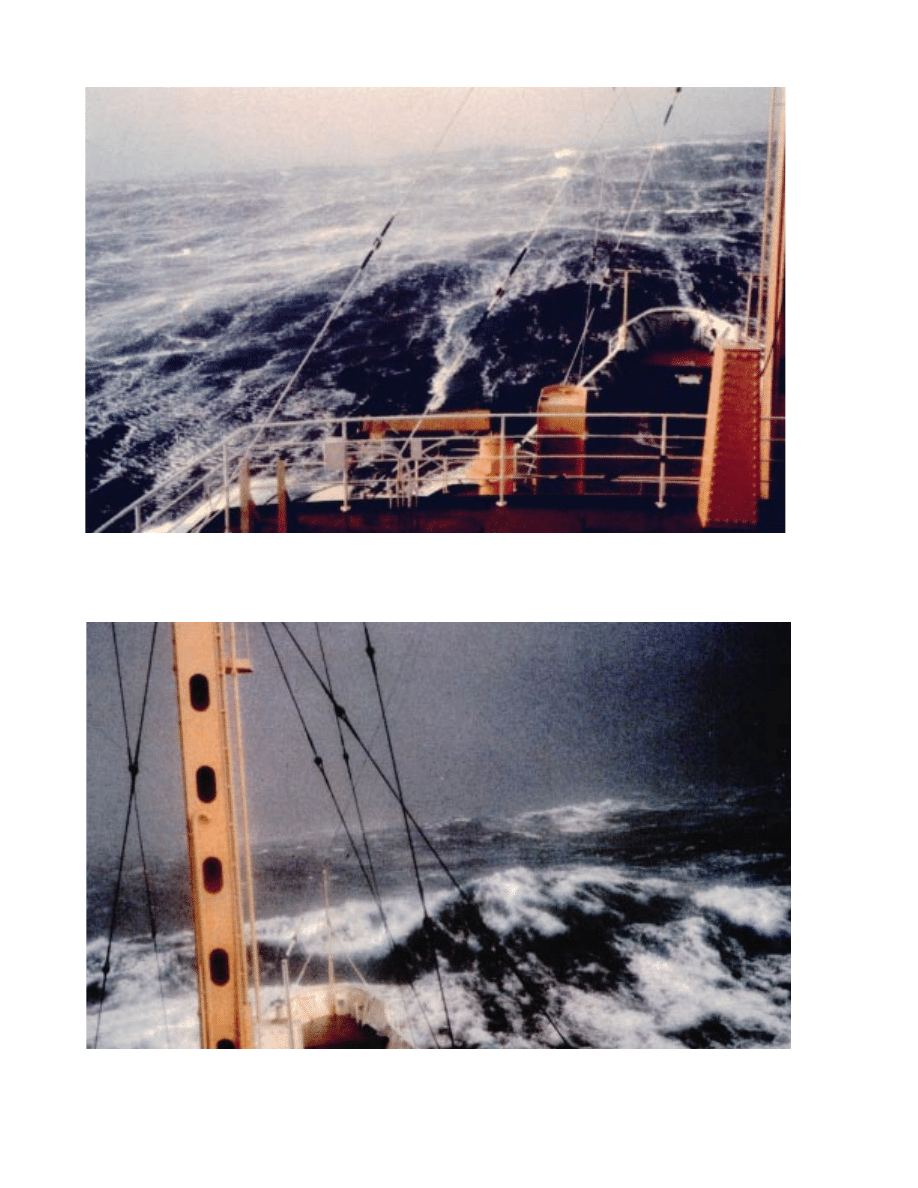
Force 7: Wind Speed 28-33 knots.
Sea: Wave height 4-5.5m (13.5-19 ft); sea heaps up, white foam from breaking waves begins to be
blown in streaks along direction of wind.
WEATHER OBSERVATIONS
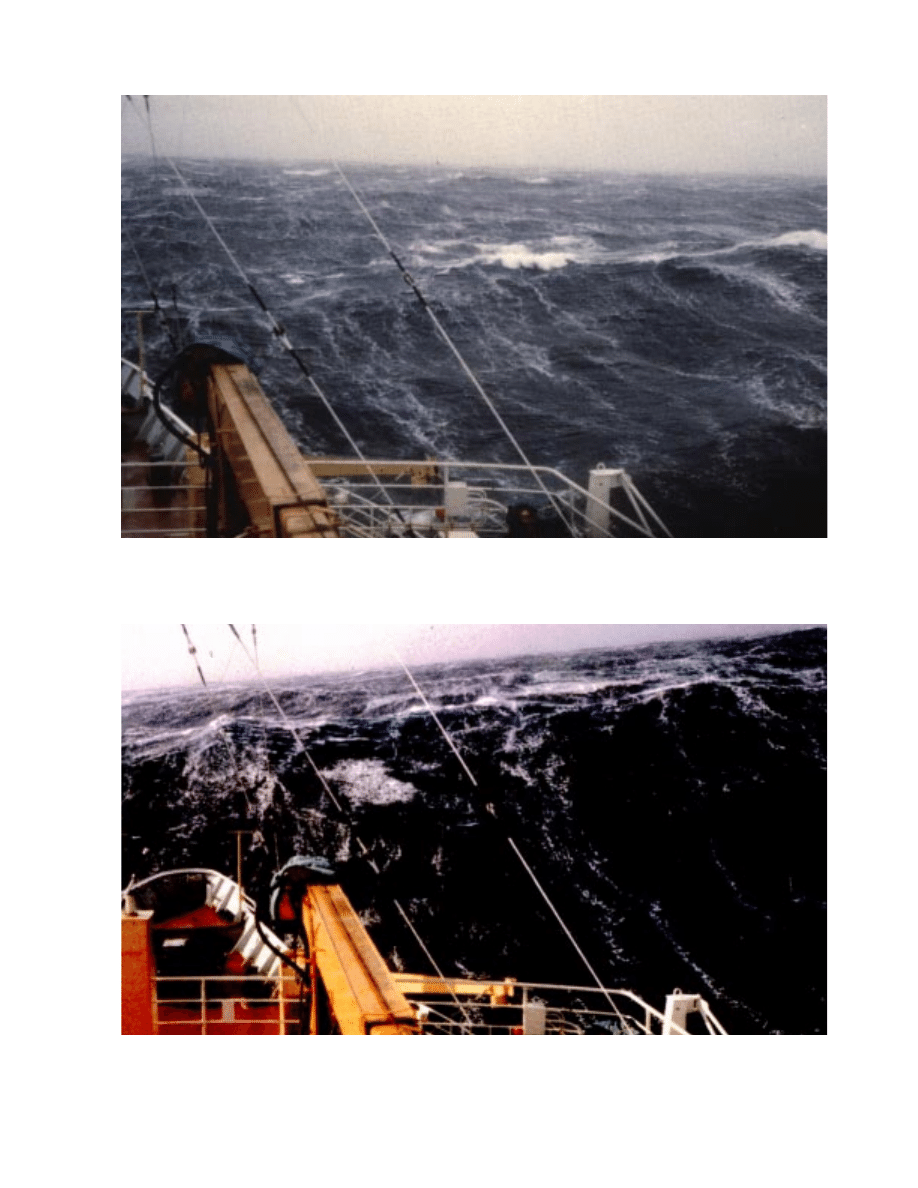
537
Force 8: Wind Speed 34-40 knots.
Sea: Wave height 5.5-7.5m (18-25 ft); Moderately high waves of greater length, edges of crests begin
to break into spindrift, foam is blown in well marked streaks.
Force 9: Wind Speed 41-47 knots.
Sea:
Wave height 7-10m (23-32 ft); High waves, sea begins to roll, dense streaks of foam along wind
direction, spray may reduce visibility.
538
WEATHER OBSERVATIONS
Force 10:
Wind Speed 48-55 knots.
Sea: Wave height 9-12.5m (29-41 ft); Very high waves with overhanging crests, sea takes white
appearance as foam is blown in very dense streaks, rolling is heavy and shocklike, visibility is reduced.
Force 11:
Wind Speed 56-63 knots.
Sea:
Wave height 11.5-16m (37-52 ft); Exceptionally high waves, sea covered with white foam
patches, visibility still more reduced.
Document Outline
- Chapter 37
Wyszukiwarka
Podobne podstrony:
CHAPT35 weather elements
myPhone 6650 Skr cona instrukcja obs ugi PL
DSC PC5010 v2 0 obs lcd
dsc pc1550 obs
instrukcja obs ugi do ekspresu do kawy JURA Impressa XS90 One Touch black PL (videotesty pl)
DSC PC1550 v3 0 obs
Everfocus EQ150 v1 1 inst obs
ins obs RRTC1
DSC Pc5008 obs v2 1
obs
DSC PC5010 v2 0 obs
myPhone 3350 D uga instrukcja obs ugi PL
Chapt3
15 Weather in our country
Instrukcja obs ugi do konsoli Xbox 360 Kinect PL
04 Weather Hazards at Sea
VA 023 Navigation Weather, STW
15 Weather and enviroment
więcej podobnych podstron