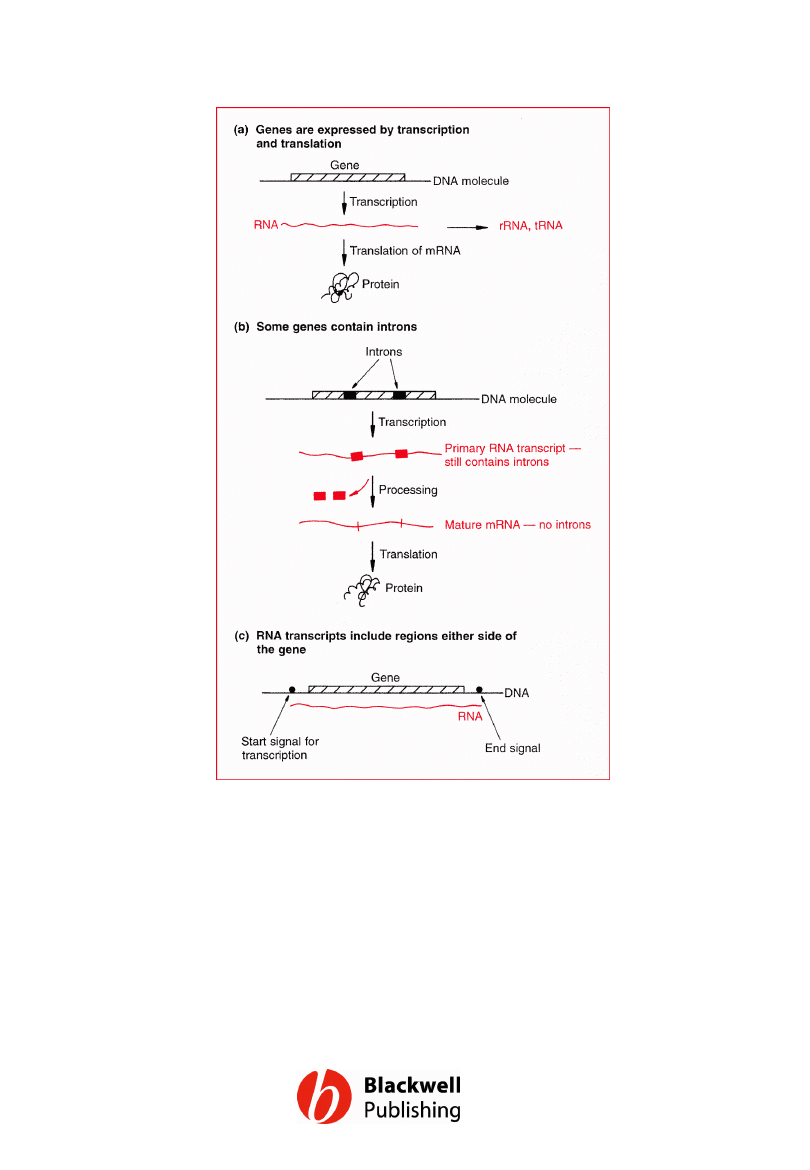
Figure 11.1 Some fundamentals of gene
expression. mRNA = messenger RNA, tRNA =
transfer RNA, rRNA = ribosomal RNA.
Gene Cloning and DNA Analysis by T.A. Brown. © 2006 T.A.
Brown.
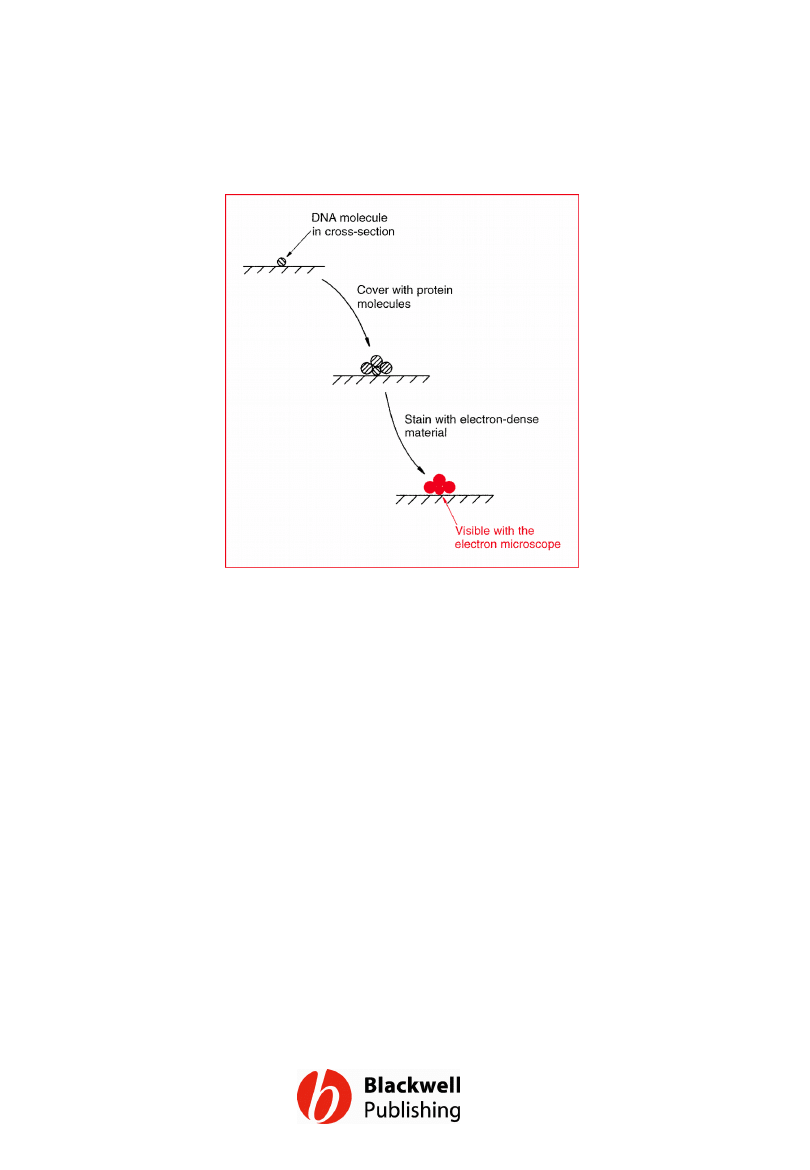
Figure 11.2 Preparing a DNA molecule for
observation with the electron microscope.
Gene Cloning and DNA Analysis by T.A. Brown. © 2006 T.A.
Brown.
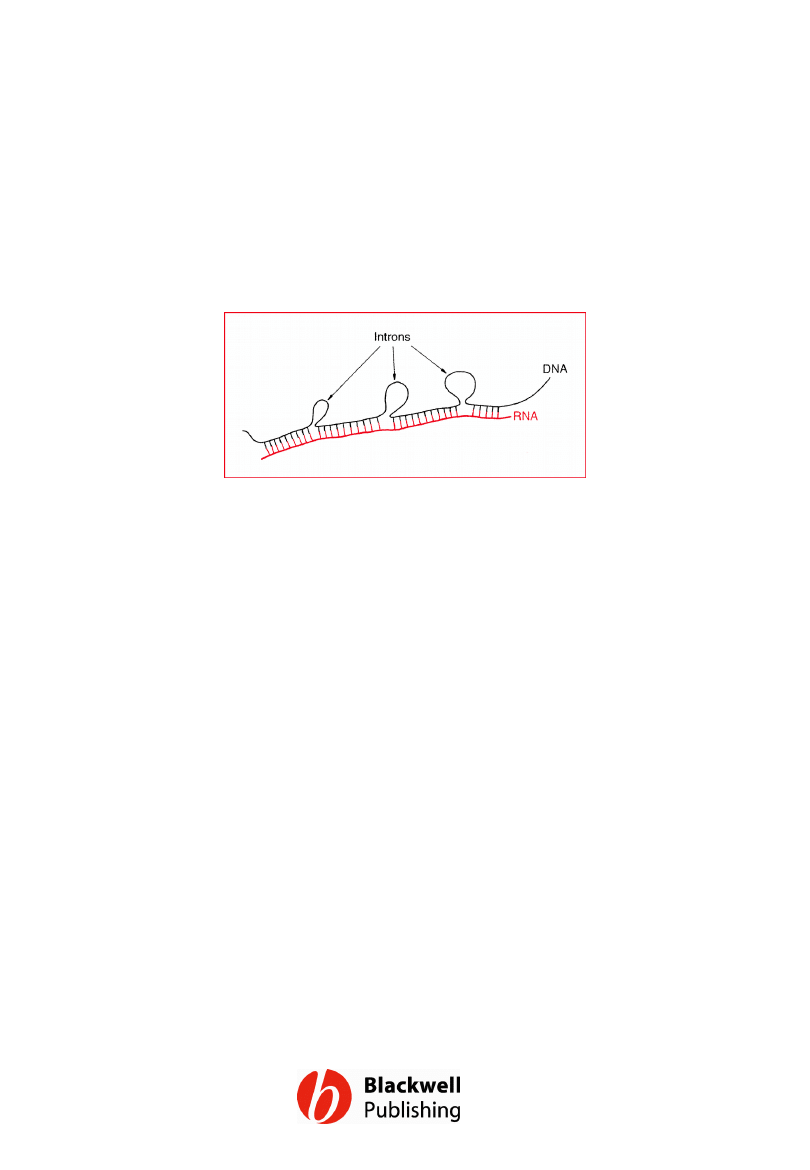
Figure 11.3 The appearance under the
electron microscope of a DNA–RNA hybrid
formed between a gene containing an intron
and its processed transcript.
Gene Cloning and DNA Analysis by T.A. Brown. © 2006 T.A.
Brown.
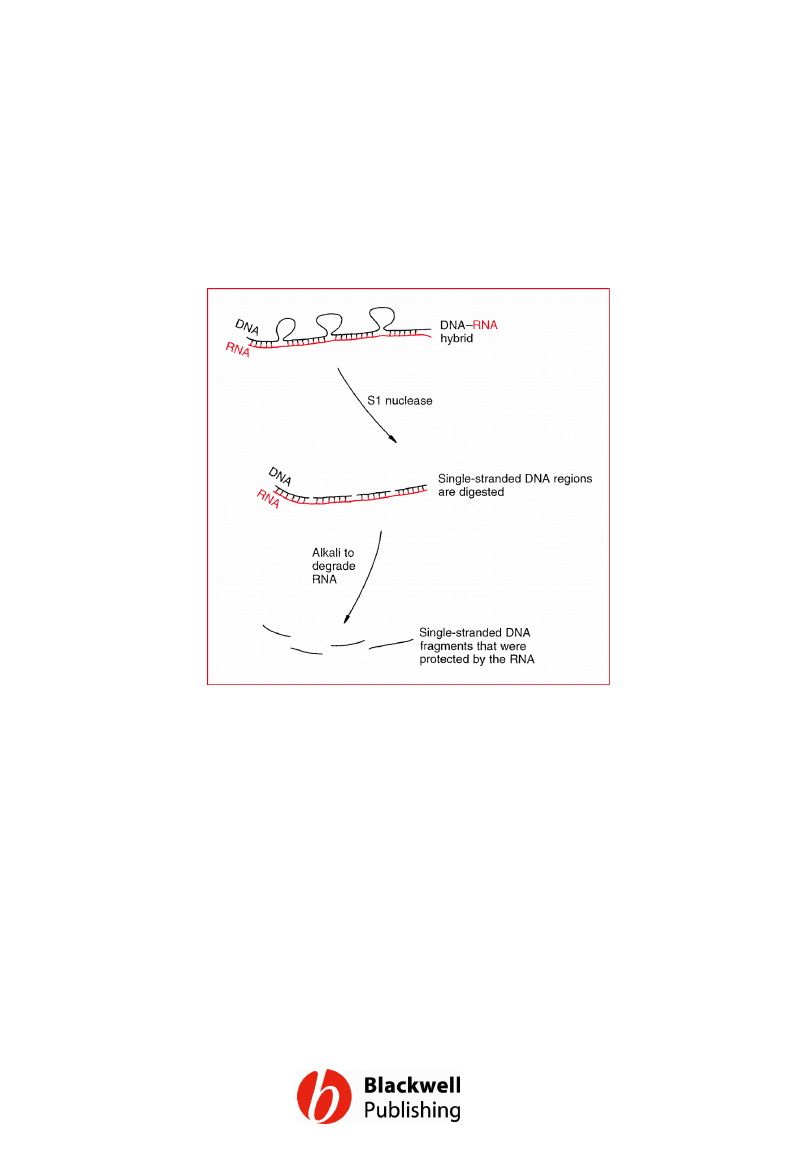
Figure 11.4 The effect of S1 nuclease on a
DNA–RNA hybrid.
Gene Cloning and DNA Analysis by T.A. Brown. © 2006 T.A.
Brown.
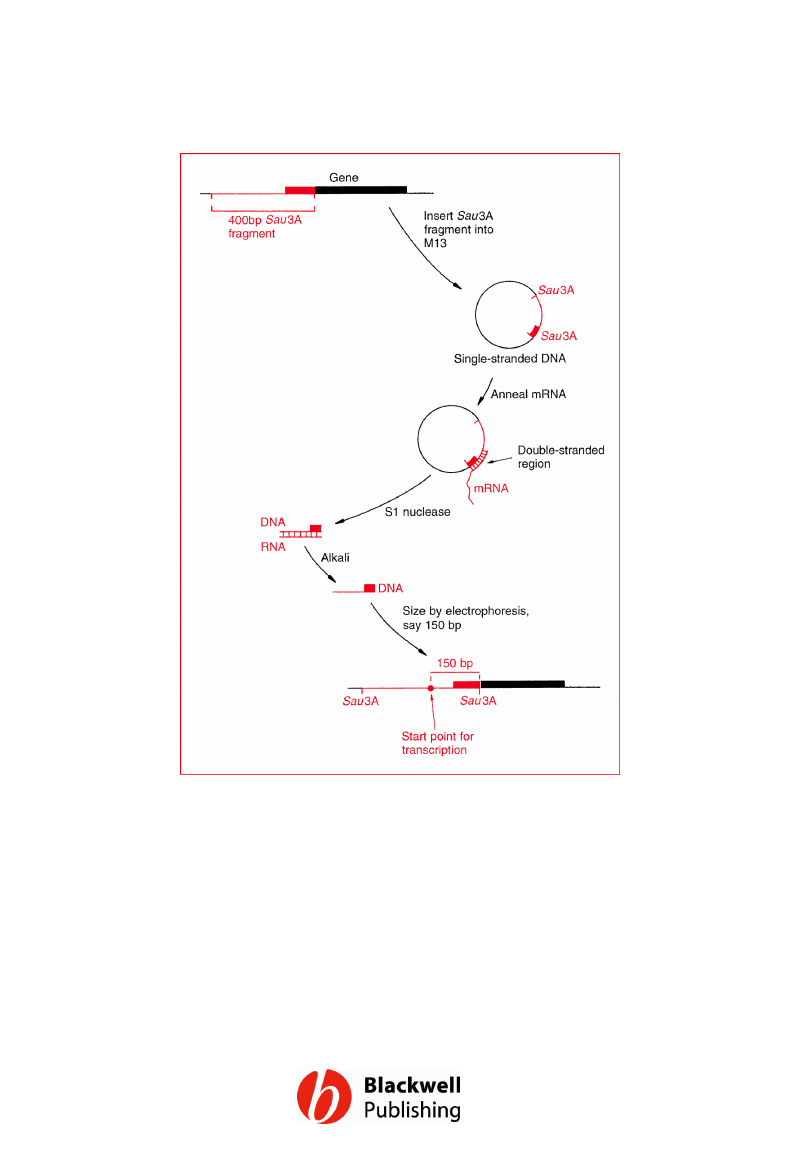
Figure 11.5 Locating a transcription start
point by S1 nuclease mapping.
Gene Cloning and DNA Analysis by T.A. Brown. © 2006 T.A.
Brown.
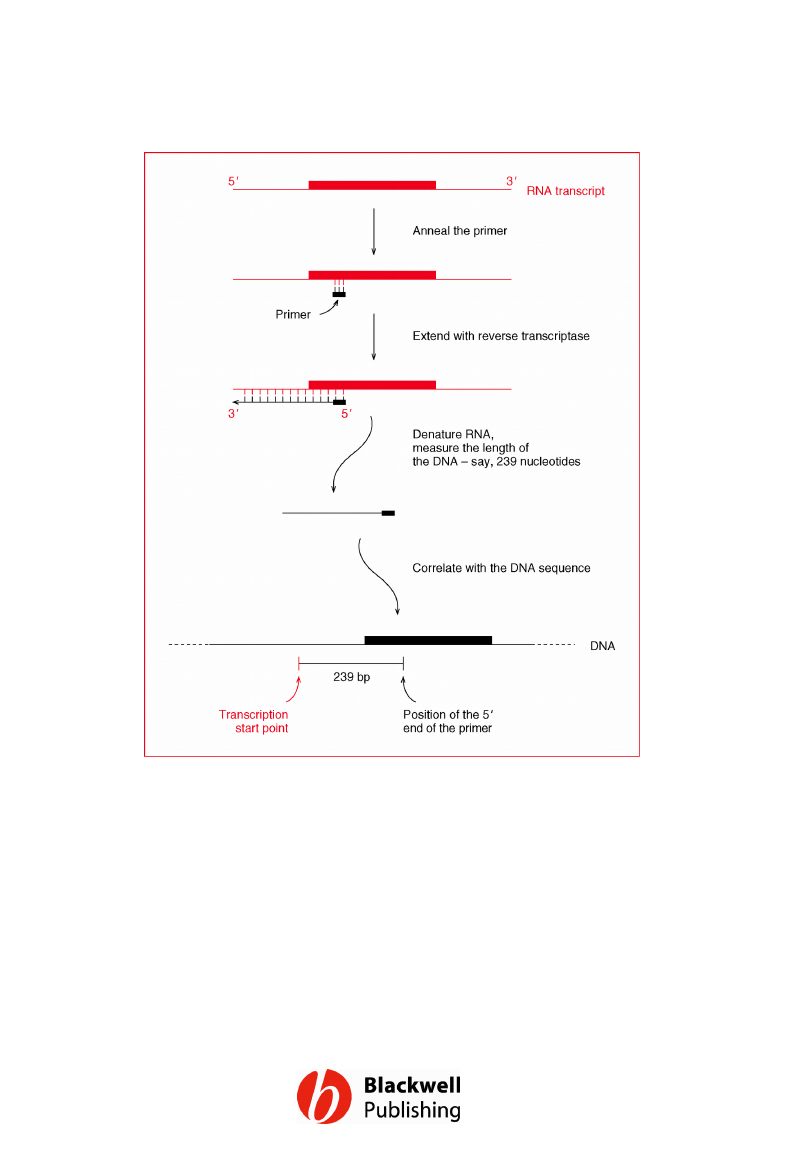
Figure 11.6 Locating a transcription start
point by primer extension.
Gene Cloning and DNA Analysis by T.A. Brown. © 2006 T.A.
Brown.
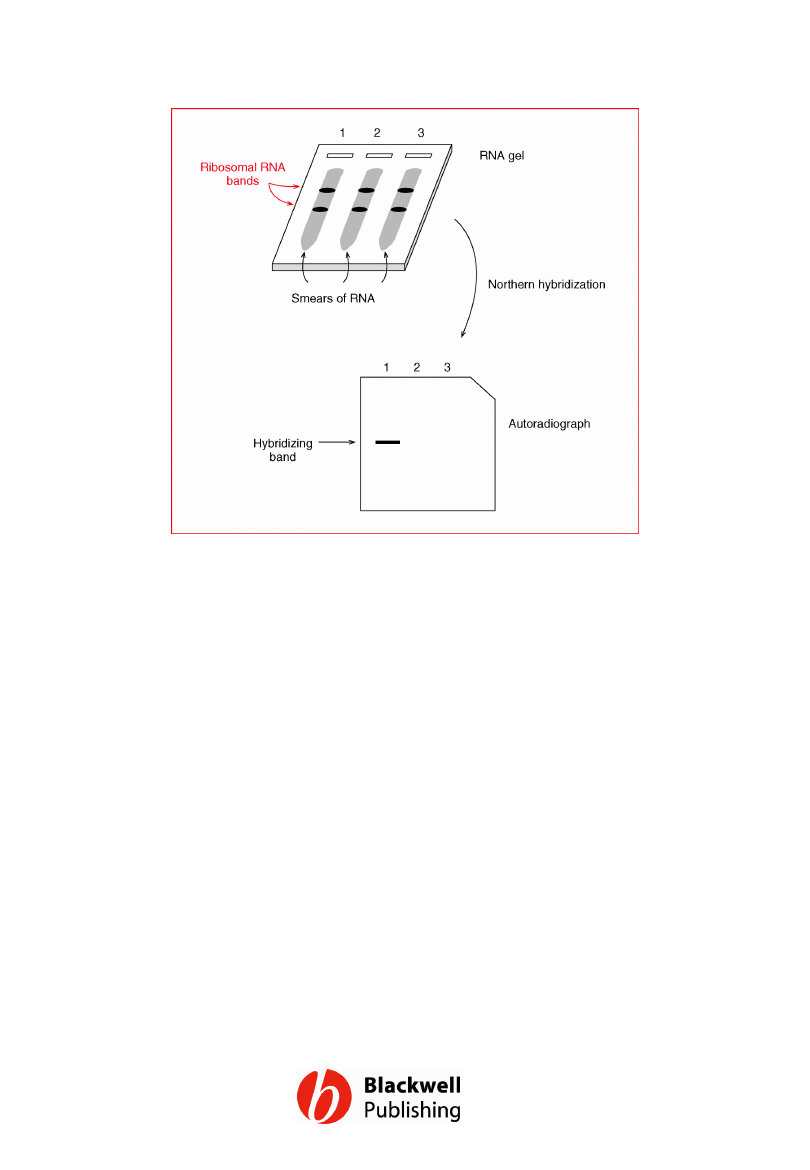
Figure 11.7 Northern hybridization. Three RNA
extracts from different tissues have been
electrophoresed in an agarose gel. The extracts are
made up of many RNAs of different lengths so each
gives a smear of RNA, but two distinct bands are
seen, one for each of the abundant ribosomal
RNAs. The sizes of these rRNAs are known (e.g.
4718 and 1874 nucleotides in mammals) so they
can be used as internal size markers. The gel is
transferred to a membrane, probed with a cloned
gene, and the results visualized by
autoradiography. Only lane 1 gives a band,
showing that the cloned gene is expressed only in
the tissue from which this RNA extract was
obtained.
Gene Cloning and DNA Analysis by T.A. Brown. © 2006 T.A.
Brown.
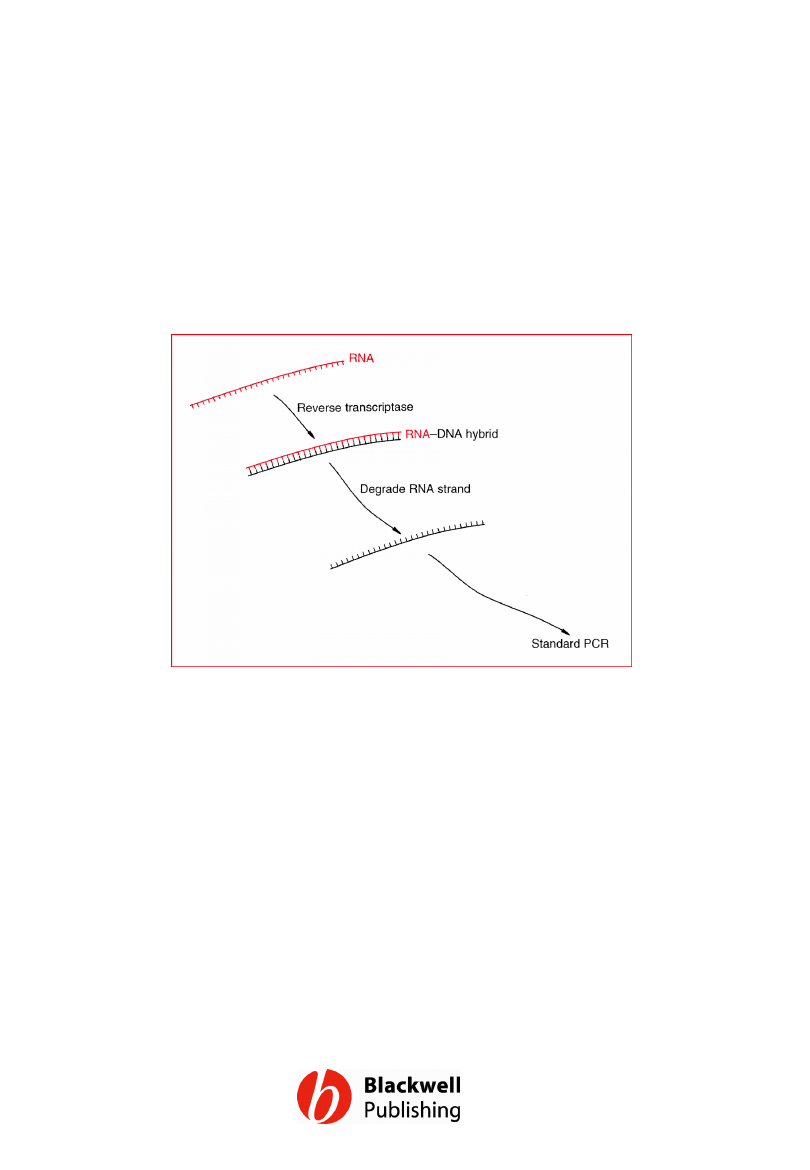
Figure 11.8 Reverse transcription–PCR (RT–
PCR).
Gene Cloning and DNA Analysis by T.A. Brown. © 2006 T.A.
Brown.
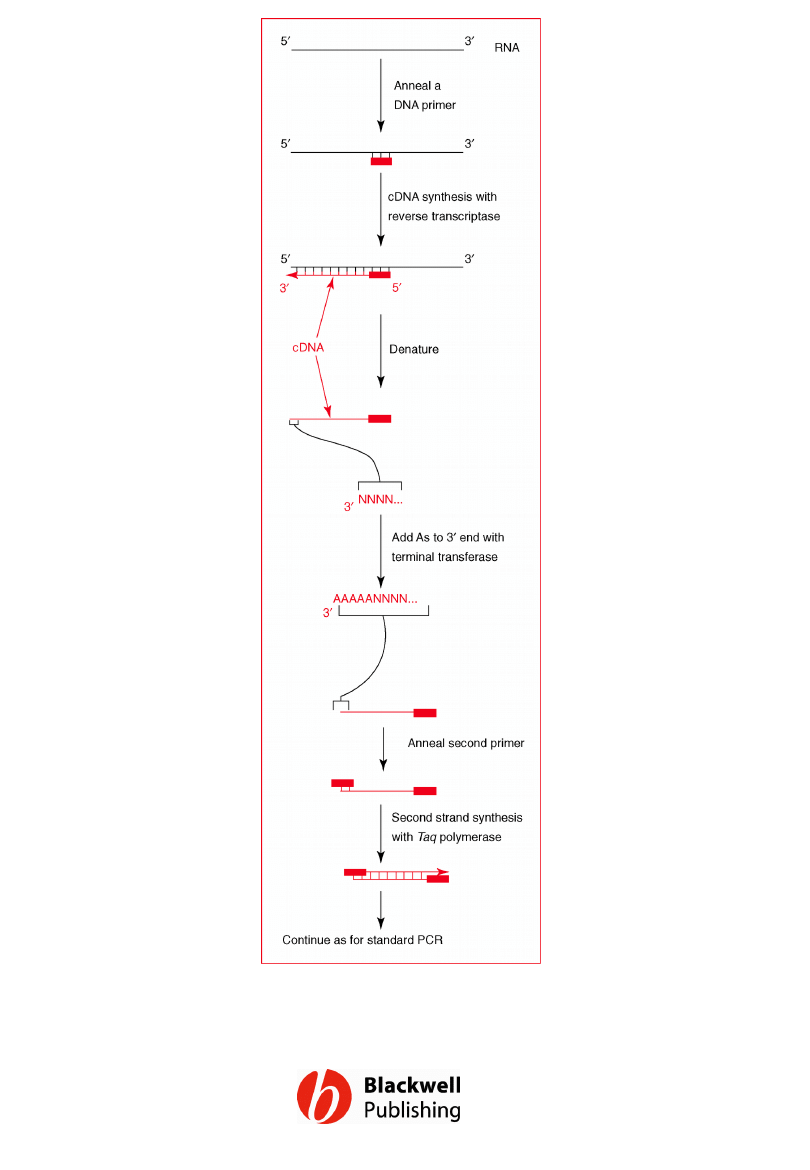
Figure 11.9 One version of RACE.
Gene Cloning and DNA Analysis by T.A. Brown. © 2006 T.A.
Brown.
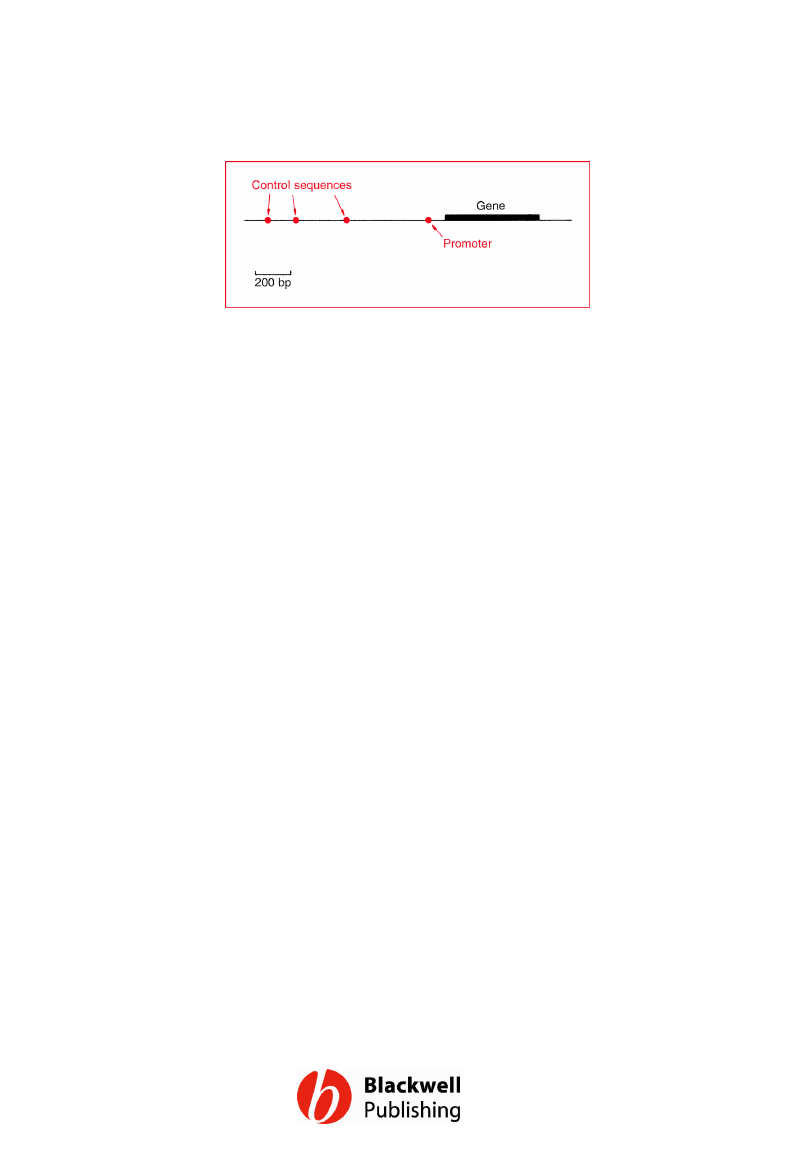
Figure 11.10 Possible positions for control
sequences in the region upstream of a gene.
Gene Cloning and DNA Analysis by T.A. Brown. © 2006 T.A.
Brown.

Figure 11.11 A bound protein decreases the
mobility of a DNA fragment during gel
electrophoresis.
Gene Cloning and DNA Analysis by T.A. Brown. © 2006 T.A.
Brown.
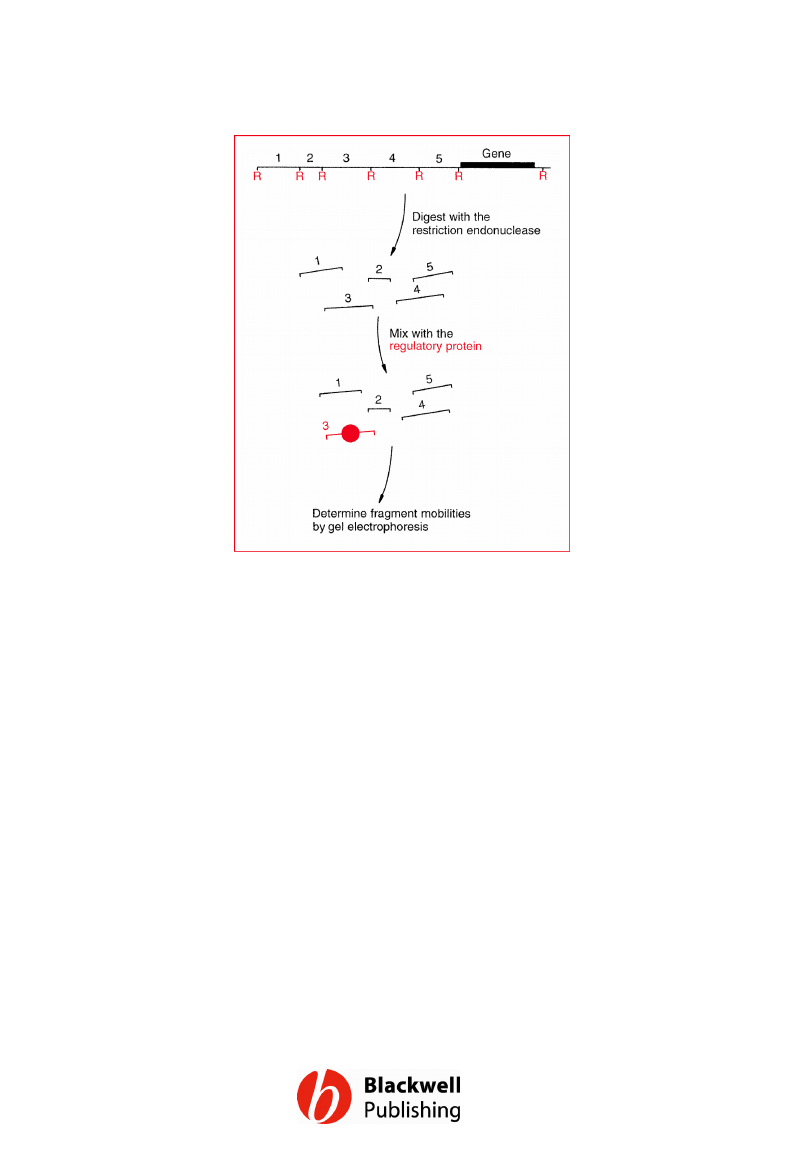
Figure 11.12 Carrying out a gel retardation
experiment.
Gene Cloning and DNA Analysis by T.A. Brown. © 2006 T.A.
Brown.
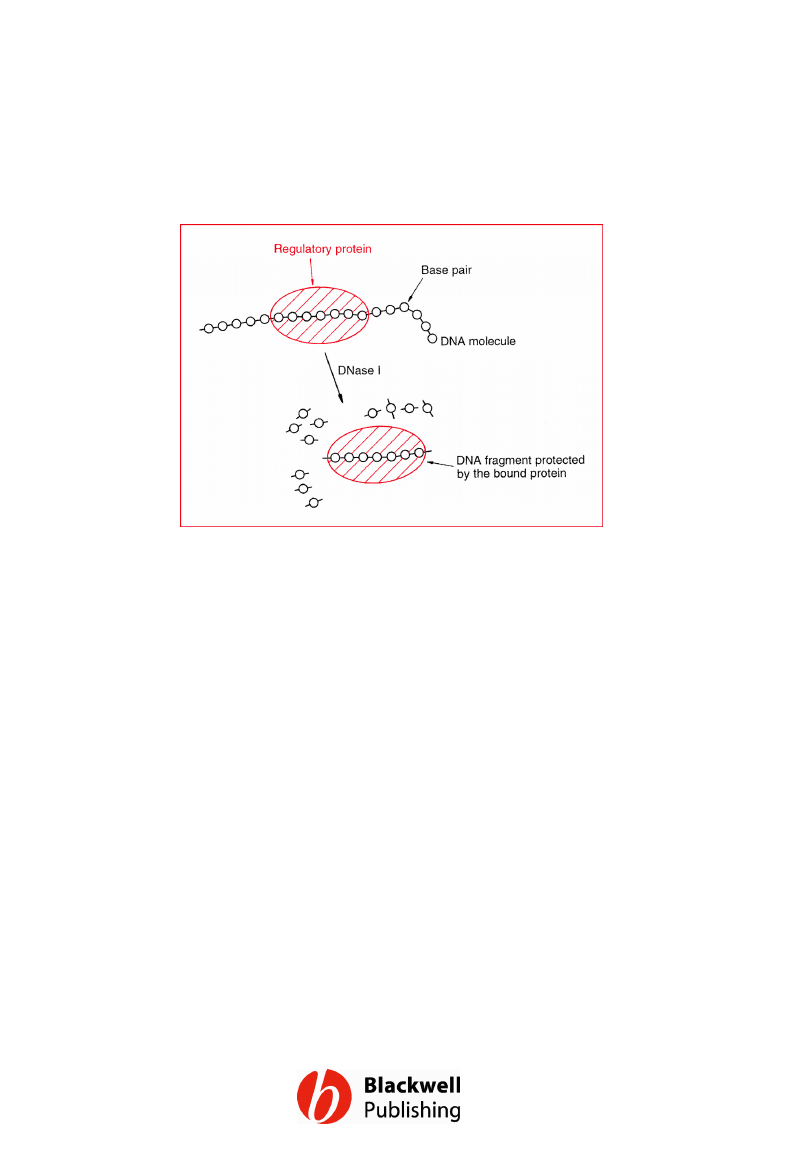
Figure 11.13 A bound protein protects a
region of a DNA molecule from degradation
by a nuclease such as DNase I.
Gene Cloning and DNA Analysis by T.A. Brown. © 2006 T.A.
Brown.
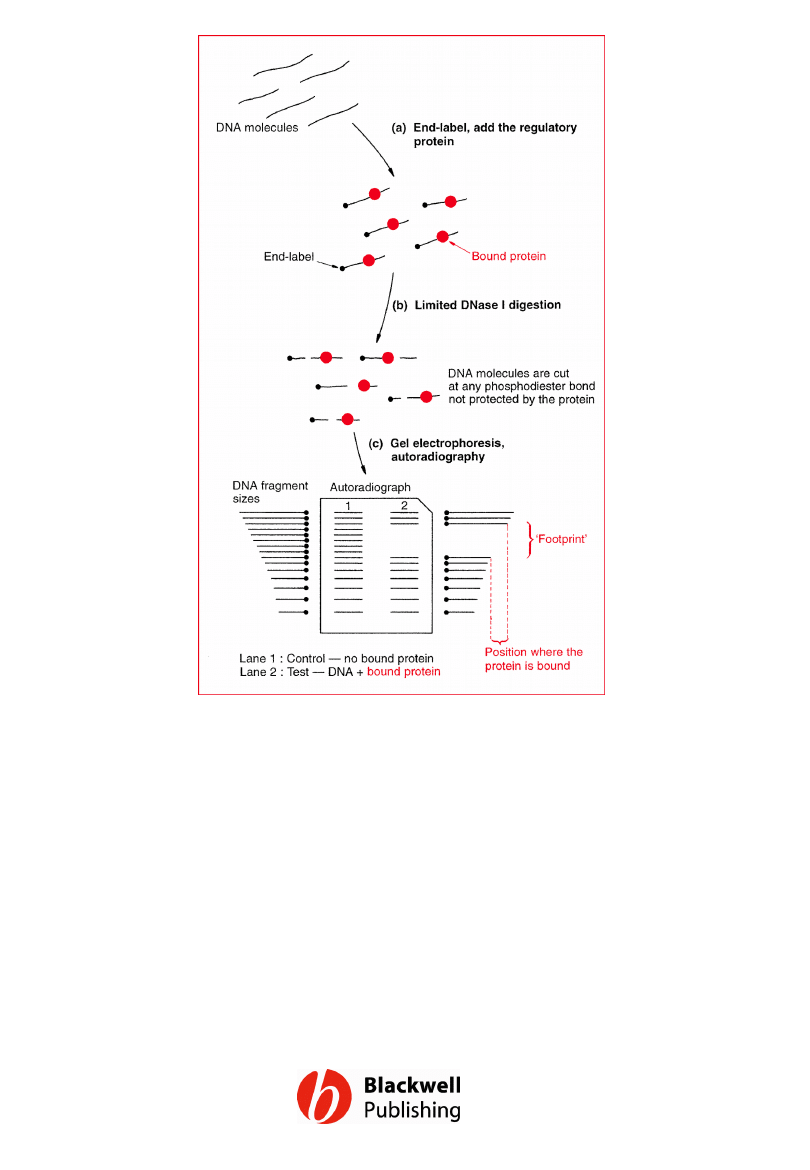
Figure 11.14 DNase I footprinting.
Gene Cloning and DNA Analysis by T.A. Brown. © 2006 T.A.
Brown.
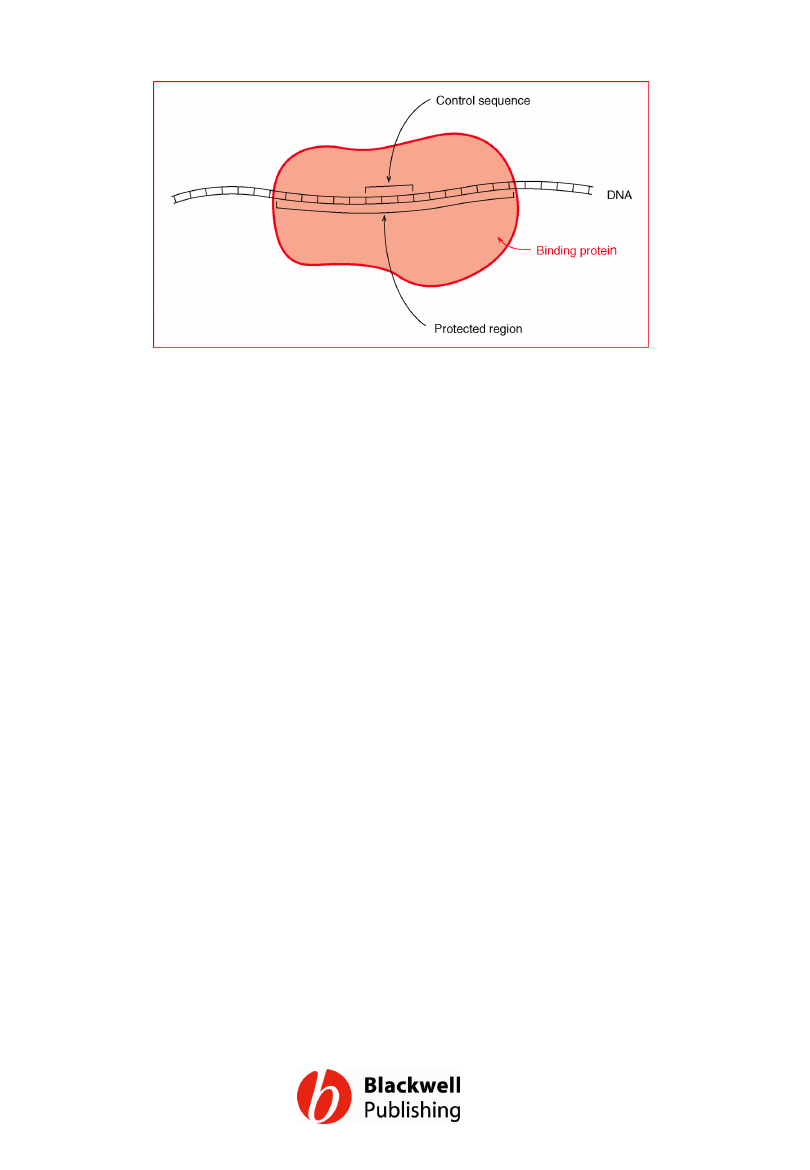
Figure 11.15 A bound protein can protect a
region of DNA that is much longer than the
control sequence.
Gene Cloning and DNA Analysis by T.A. Brown. © 2006 T.A.
Brown.
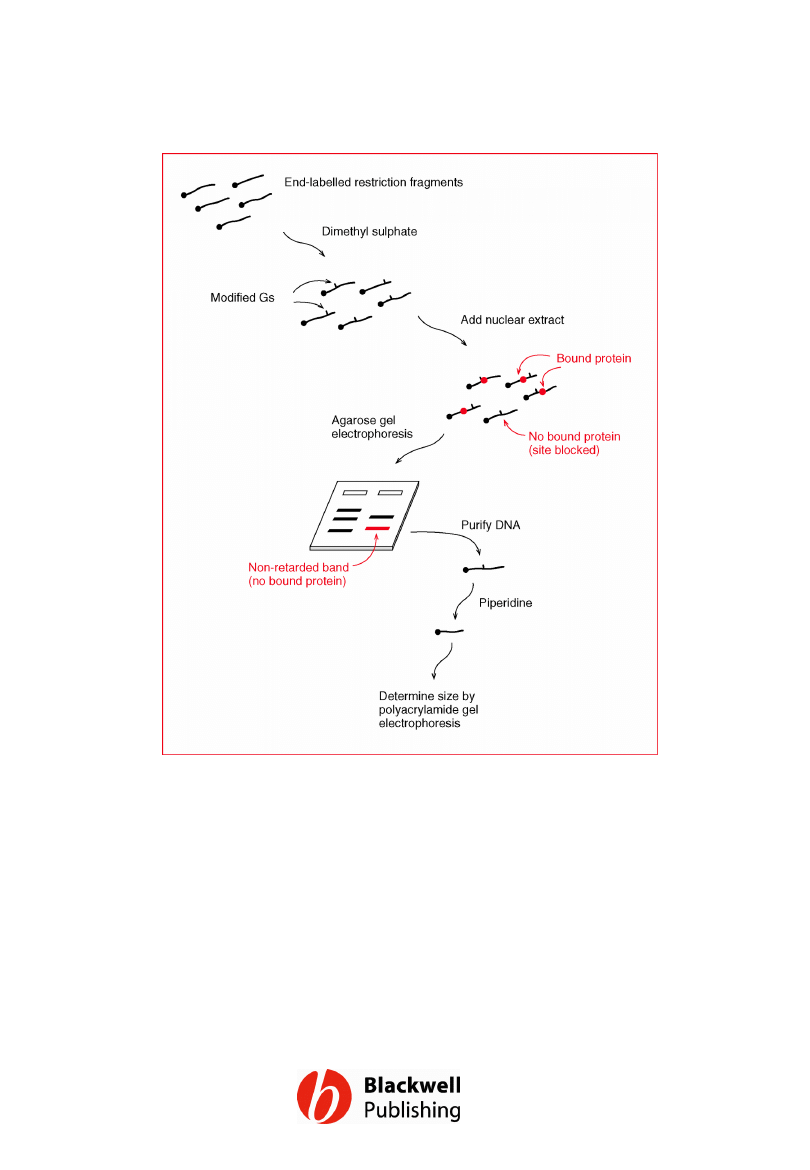
Figure 11.16 A modification interference
assay.
Gene Cloning and DNA Analysis by T.A. Brown. © 2006 T.A.
Brown.
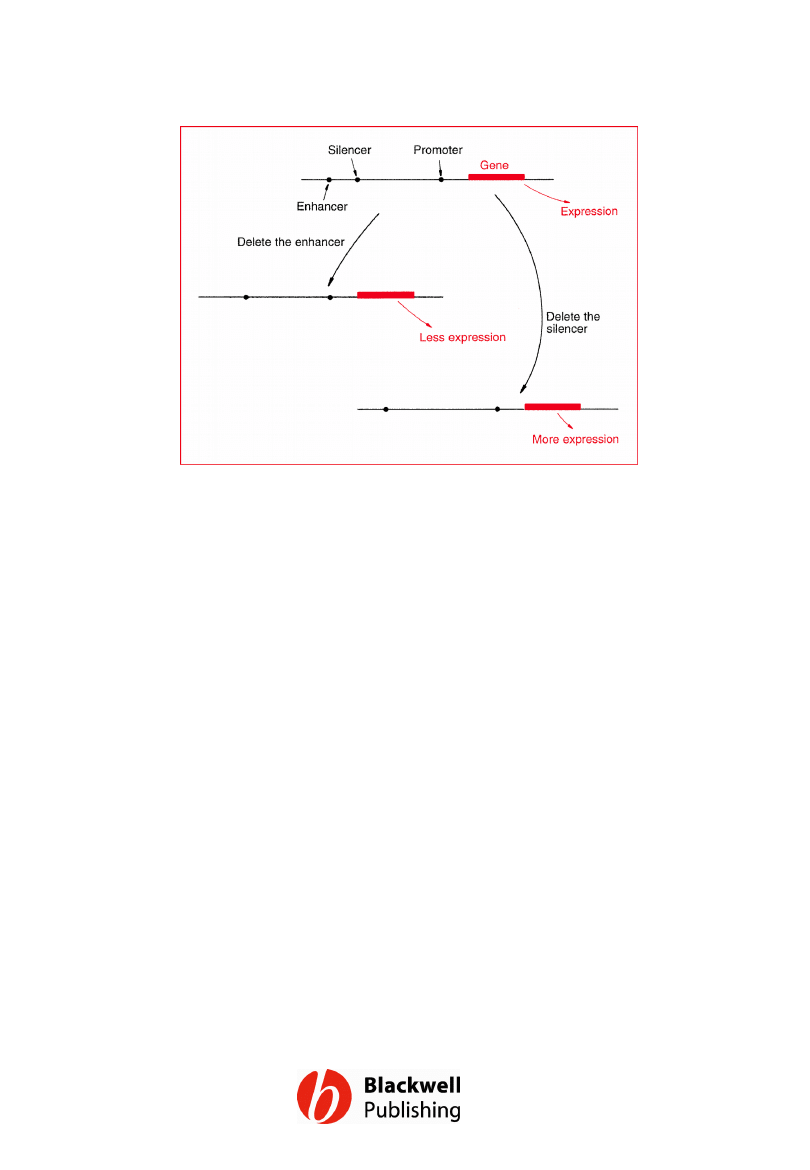
Figure 11.17 The principle behind deletion
analysis.
Gene Cloning and DNA Analysis by T.A. Brown. © 2006 T.A.
Brown.
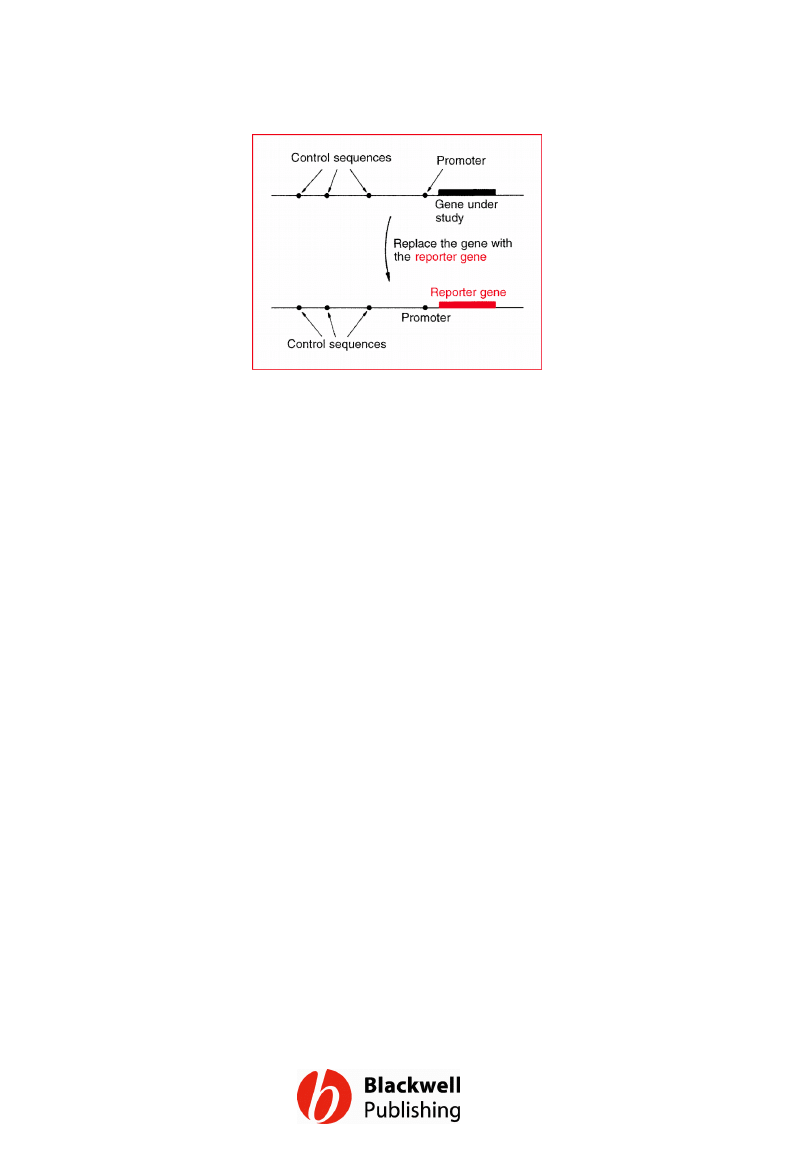
Figure 11.18 A reporter gene.
Gene Cloning and DNA Analysis by T.A. Brown. © 2006 T.A.
Brown.
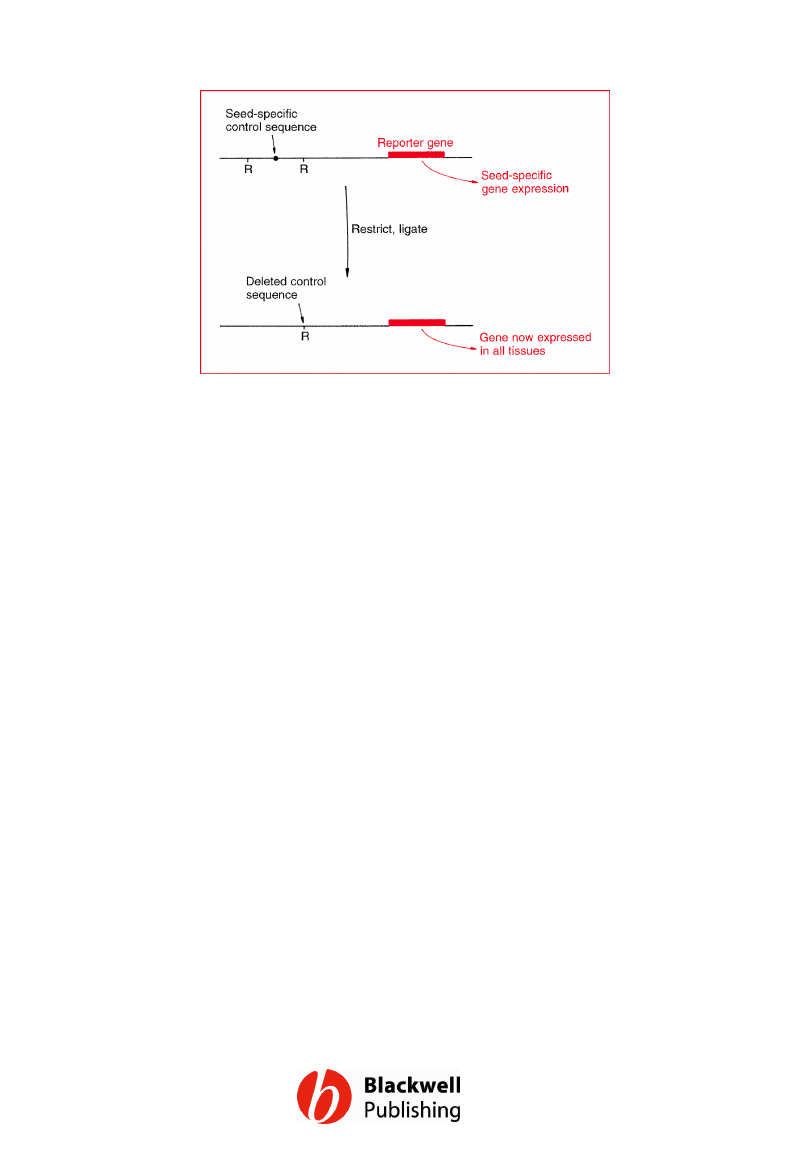
Figure 11.19 Deletion analysis. A reporter
gene has been attached to the upstream
region of a seed-specific gene from a plant.
Removal of the restriction fragment bounded
by the sites R deletes the control sequence
that mediates seed-specific gene expression,
so that the reporter gene is now expressed in
all tissues of the plant.
Gene Cloning and DNA Analysis by T.A. Brown. © 2006 T.A.
Brown.
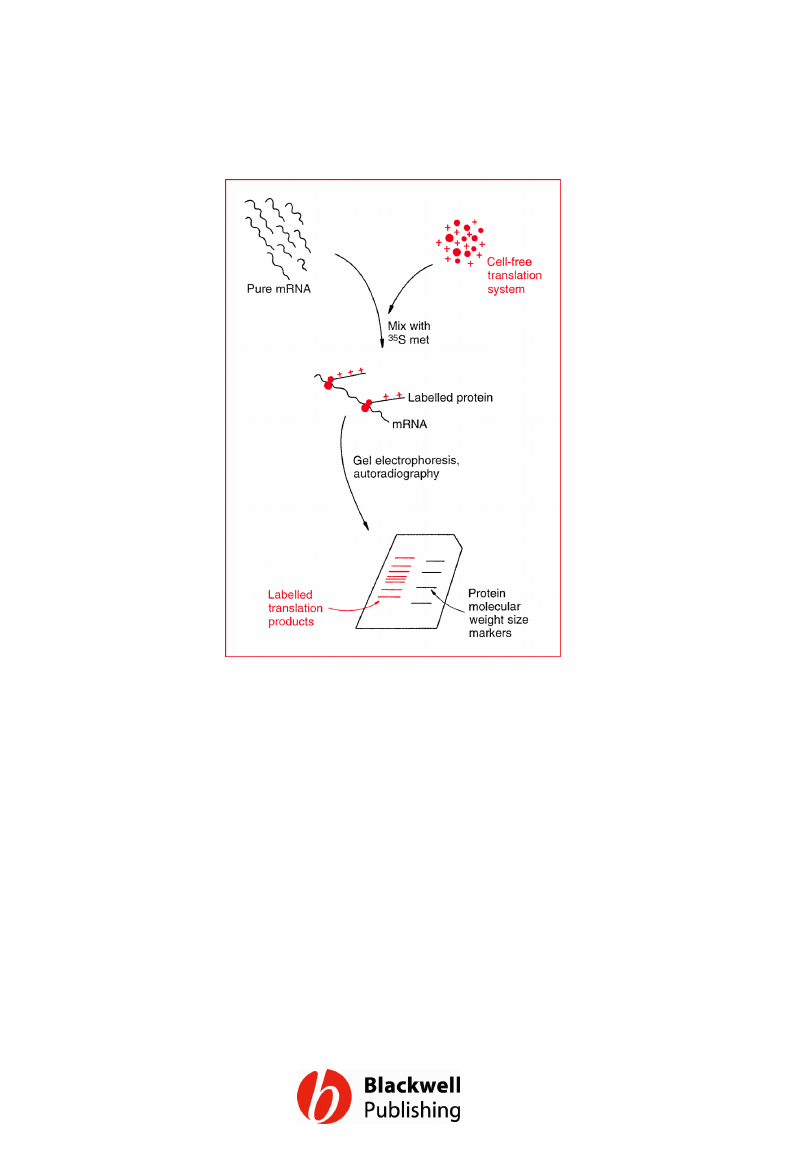
Figure 11.20 Cell-free translation.
Gene Cloning and DNA Analysis by T.A. Brown. © 2006 T.A.
Brown.
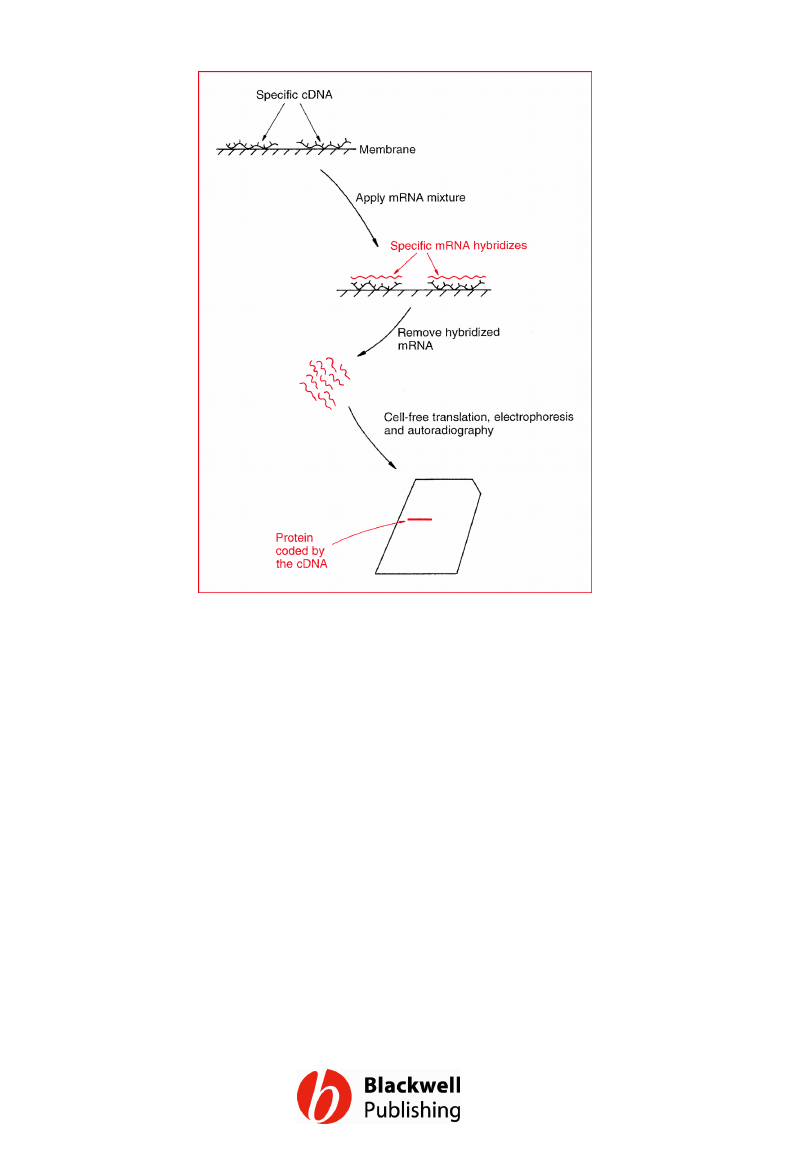
Figure 11.21 Hybrid-release translation.
Gene Cloning and DNA Analysis by T.A. Brown. © 2006 T.A.
Brown.
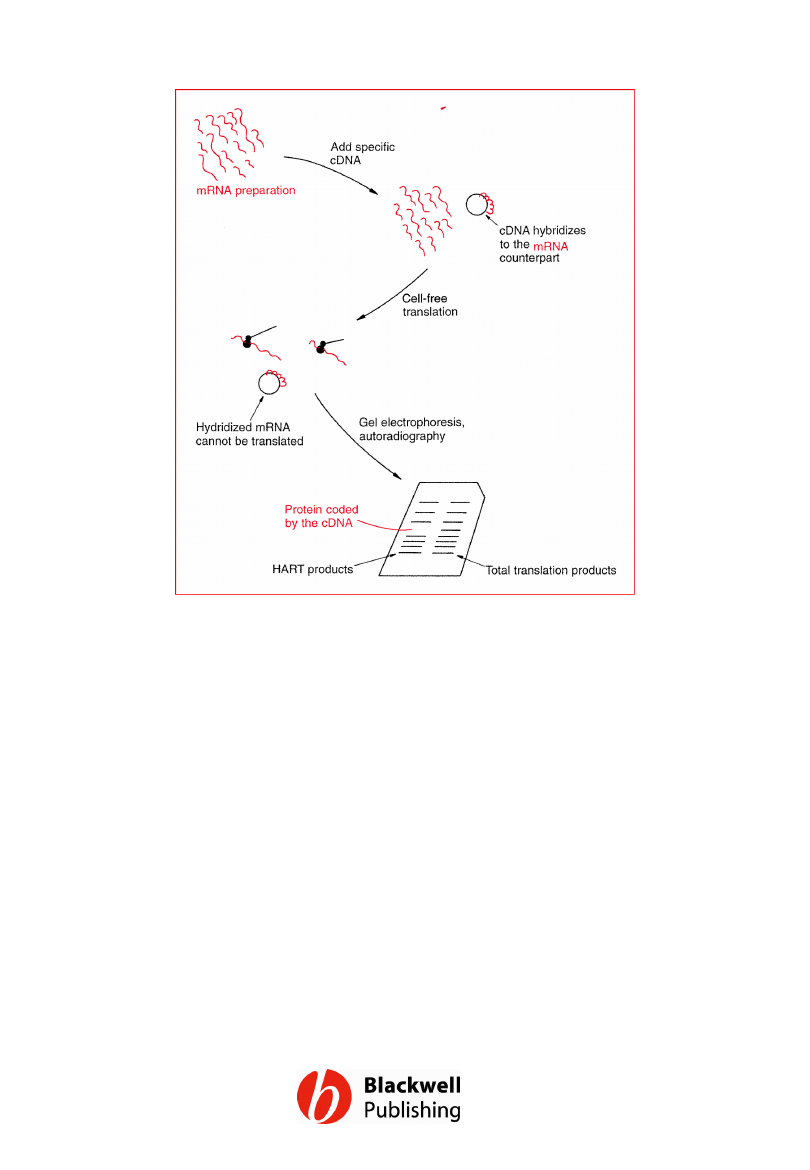
Figure 11.22 Hybrid-arrest translation.
Gene Cloning and DNA Analysis by T.A. Brown. © 2006 T.A.
Brown.
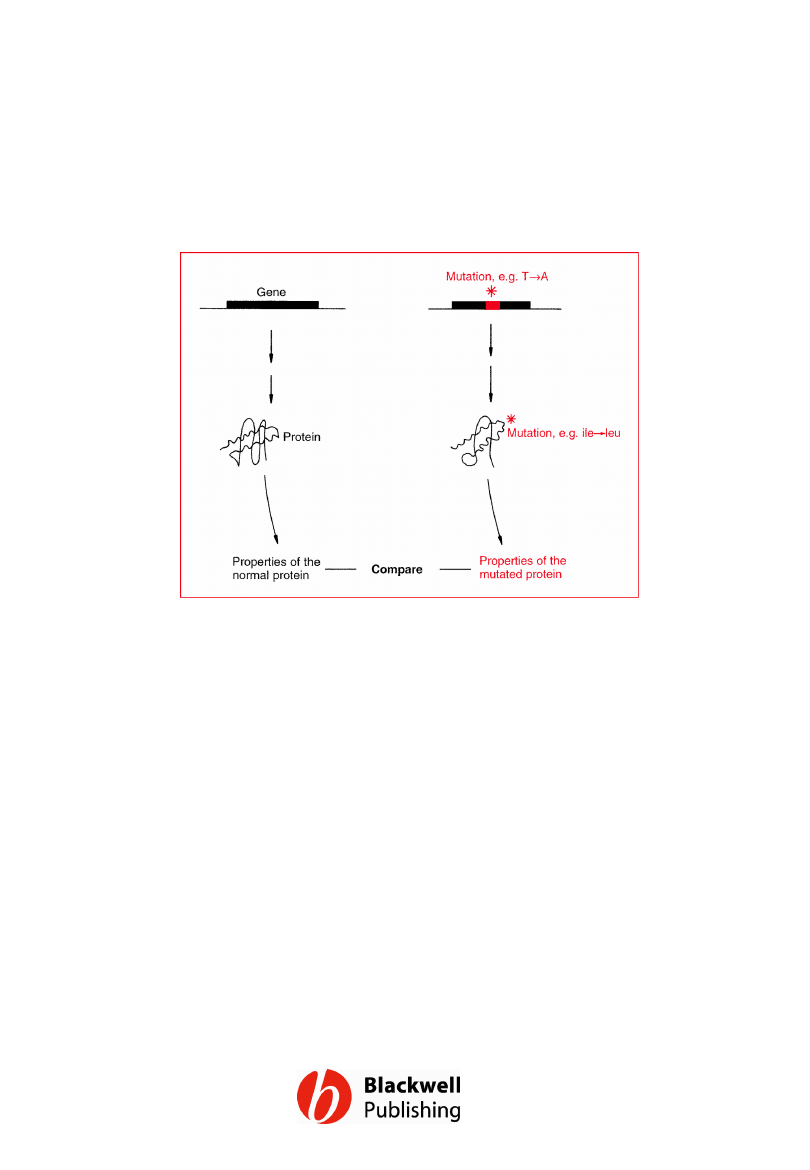
Figure 11.23 A mutation may change the
amino acid sequence of a protein, possibly
affecting its properties.
Gene Cloning and DNA Analysis by T.A. Brown. © 2006 T.A.
Brown.
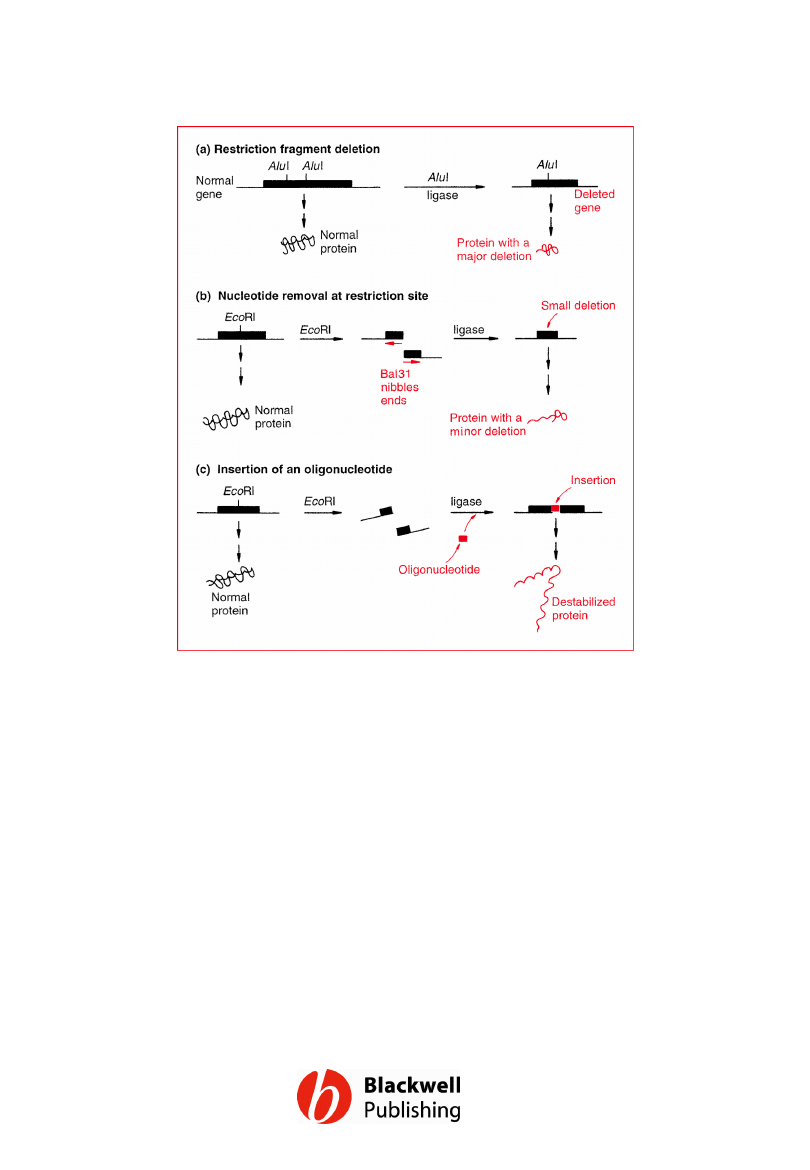
Figure 11.24 Various in vitro mutagenesis
techniques.
Gene Cloning and DNA Analysis by T.A. Brown. © 2006 T.A.
Brown.
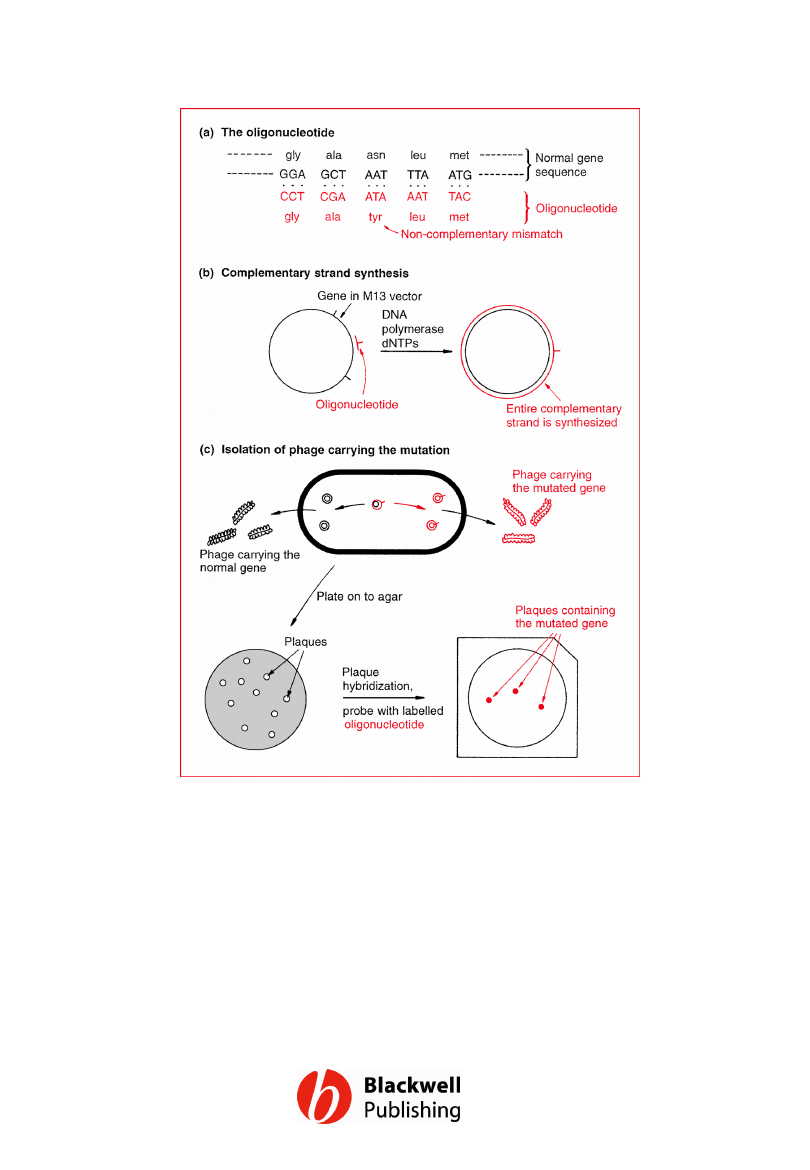
Figure 11.25 One method for
oligonucleotide-directed mutagenesis.
Gene Cloning and DNA Analysis by T.A. Brown. © 2006 T.A.
Brown.
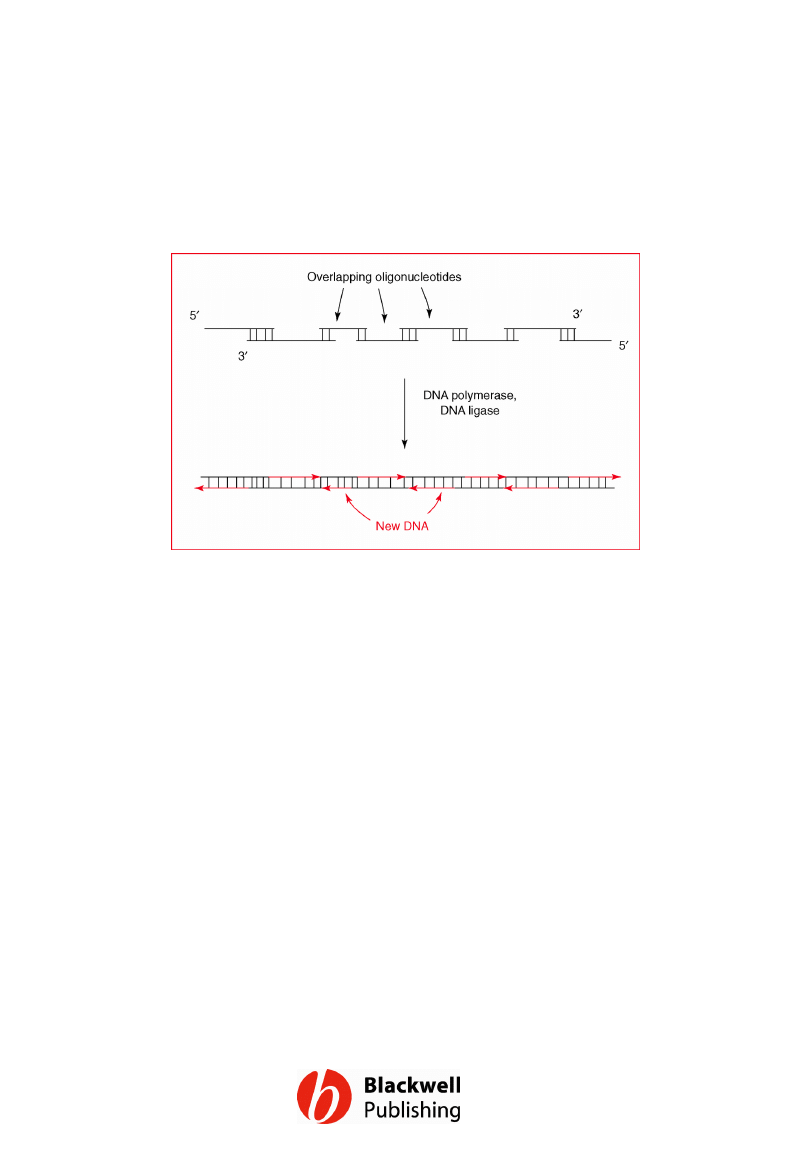
Figure 11.26 Artificial gene synthesis.
Gene Cloning and DNA Analysis by T.A. Brown. © 2006 T.A.
Brown.
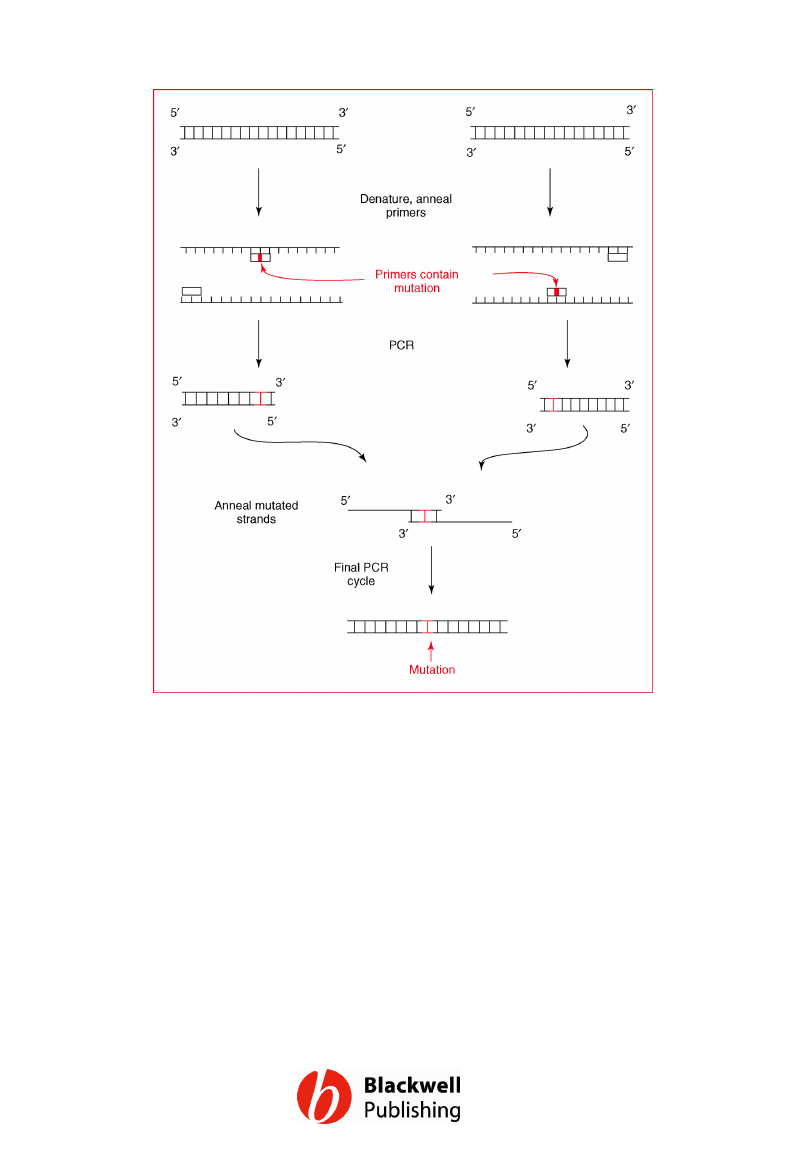
Figure 11.27 One method for using PCR to
create a directed mutation.
Gene Cloning and DNA Analysis by T.A. Brown. © 2006 T.A.
Brown.
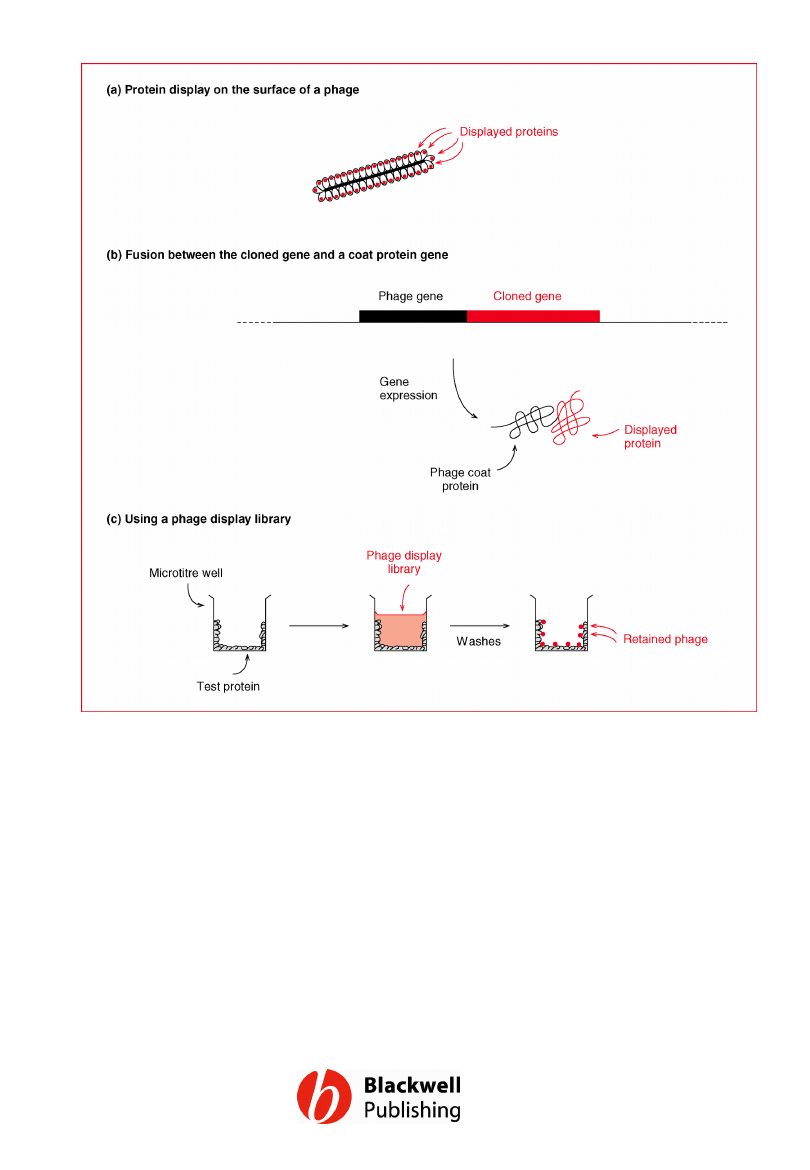
Figure 11.28 Phage display. (a) Display of
proteins on the surface of a recombinant
filamentous phage. (b) The gene fusion used
to display a protein. (c) One way of detecting
interactions between a test protein and a
phage from within a display library.
Gene Cloning and DNA Analysis by T.A. Brown. © 2006 T.A.
Brown.
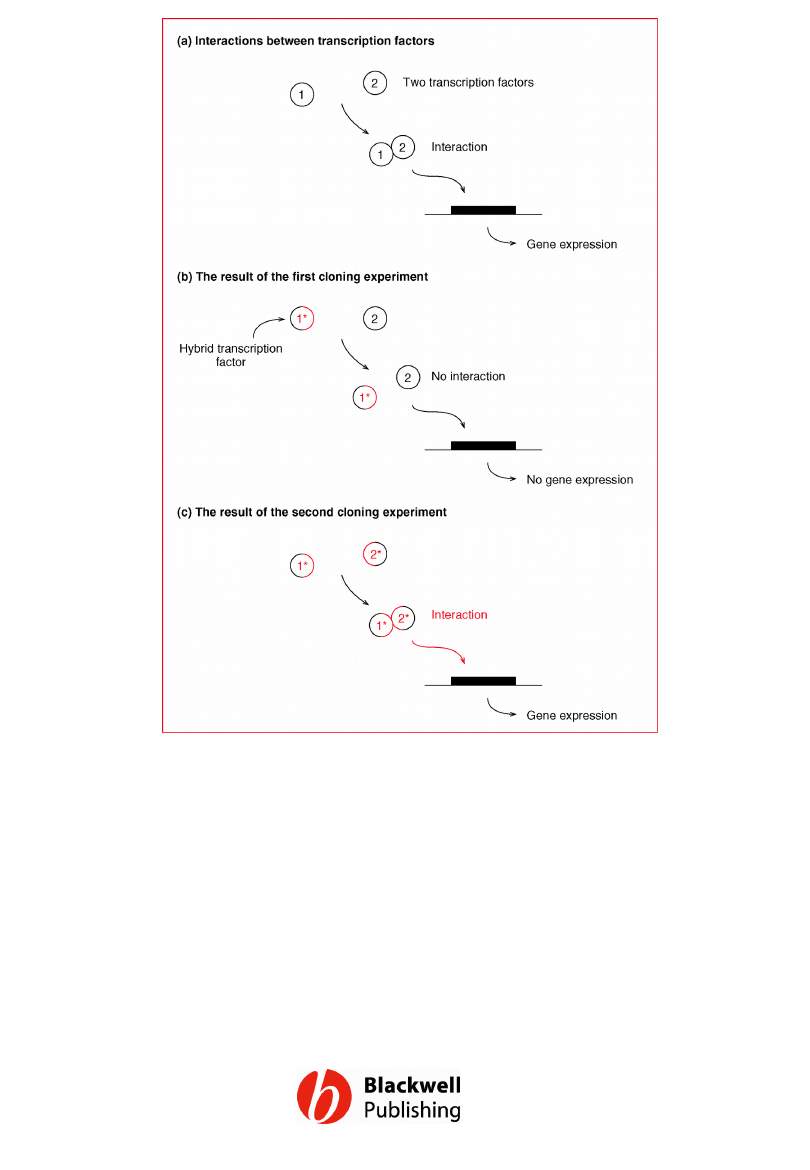
Figure 11.29 The yeast two hybrid system. (a) A
pair of transcription factors that must interact in
order for a yeast gene to be expressed. (b)
Replacement of transcription factor 1 with the
hybrid protein 1* abolishes gene expression as 1*
cannot interact with transcription factor 2. (c)
Replacement of transcription factor 2 with the
hybrid protein 2* restores gene expression if the
hybrid parts of 1* and 2* are able to interact.
Gene Cloning and DNA Analysis by T.A. Brown. © 2006 T.A.
Brown.
Document Outline
- Figure 11.1 Some fundamentals of gene expression. mRNA = messenger RNA, tRNA = transfer RNA, rRNA = ribosomal RNA.
- Figure 11.2 Preparing a DNA molecule for observation with the electron microscope.
- Figure 11.3 The appearance under the electron microscope of a DNA–RNA hybrid formed between a gene containing an intron and its processed transcript.
- Figure 11.4 The effect of S1 nuclease on a DNA–RNA hybrid.
- Figure 11.5 Locating a transcription start point by S1 nuclease mapping.
- Figure 11.6 Locating a transcription start point by primer extension.
- Figure 11.7 Northern hybridization. Three RNA extracts from different tissues have been electrophoresed in an agarose gel. The extracts are made up of many RNAs of different lengths so each gives a smear of RNA, but two distinct bands are seen, one for each of the abundant ribosomal RNAs. The sizes of these rRNAs are known (e.g. 4718 and 1874 nucleotides in mammals) so they can be used as internal size markers. The gel is transferred to a membrane, probed with a cloned gene, and the results visualized by autoradiography. Only lane 1 gives a band, showing that the cloned gene is expressed only in the tissue from which this RNA extract was obtained.
- Figure 11.8 Reverse transcription–PCR (RT–PCR).
- Figure 11.9 One version of RACE.
- Figure 11.10 Possible positions for control sequences in the region upstream of a gene.
- Figure 11.11 A bound protein decreases the mobility of a DNA fragment during gel electrophoresis.
- Figure 11.12 Carrying out a gel retardation experiment.
- Figure 11.13 A bound protein protects a region of a DNA molecule from degradation by a nuclease such as DNase I.
- Figure 11.14 DNase I footprinting.
- Figure 11.15 A bound protein can protect a region of DNA that is much longer than the control sequence.
- Figure 11.16 A modification interference assay.
- Figure 11.17 The principle behind deletion analysis.
- Figure 11.18 A reporter gene.
- Figure 11.19 Deletion analysis. A reporter gene has been attached to the upstream region of a seed-specific gene from a plant. Removal of the restriction fragment bounded by the sites R deletes the control sequence that mediates seed-specific gene expression, so that the reporter gene is now expressed in all tissues of the plant.
- Figure 11.20 Cell-free translation.
- Figure 11.21 Hybrid-release translation.
- Figure 11.22 Hybrid-arrest translation.
- Figure 11.23 A mutation may change the amino acid sequence of a protein, possibly affecting its properties.
- Figure 11.24 Various in vitro mutagenesis techniques.
- Figure 11.25 One method for oligonucleotide-directed mutagenesis.
- Figure 11.26 Artificial gene synthesis.
- Figure 11.27 One method for using PCR to create a directed mutation.
- Figure 11.28 Phage display. (a) Display of proteins on the surface of a recombinant filamentous phage. (b) The gene fusion used to display a protein. (c) One way of detecting interactions between a test protein and a phage from within a display library.
- Figure 11.29 The yeast two hybrid system. (a) A pair of transcription factors that must interact in order for a yeast gene to be expressed. (b) Replacement of transcription factor 1 with the hybrid protein 1* abolishes gene expression as 1* cannot interact with transcription factor 2. (c) Replacement of transcription factor 2 with the hybrid protein 2* restores gene expression if the hybrid parts of 1* and 2* are able to interact.
Wyszukiwarka
Podobne podstrony:
Figures for chapter 5
Figures for chapter 12
Figures for chapter 6
Figures for chapter 14
Figures for chapter 10
Figures for chapter 8
Figures for chapter 9
Figures for chapter 2
Figures for chapter 16
Figures for chapter 13
Figures for chapter 3
Figures for chapter 7
Figures for chapter 15
Figures for chapter 1
Figures for chapter 5
Figures for chapter 12
Figures for chapter 6
Figures for chapter 14
Figures for chapter 10
więcej podobnych podstron