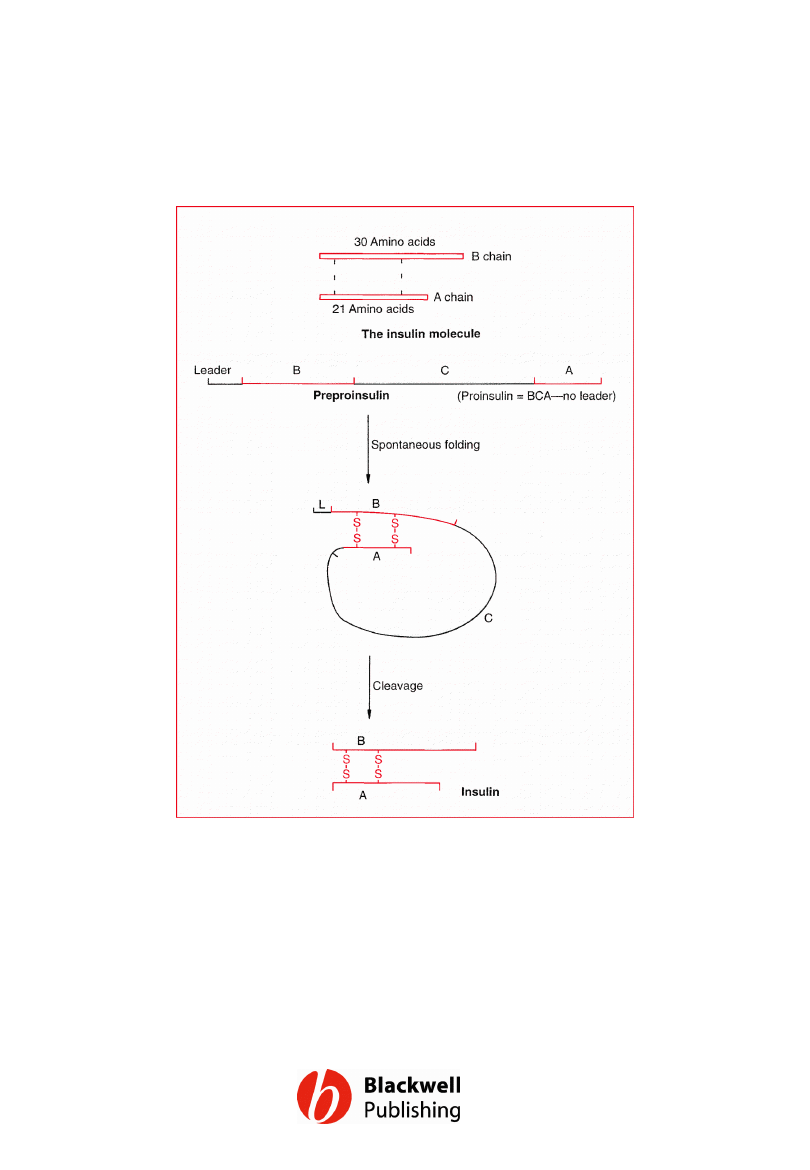
Figure 14.1 The structure of the insulin
molecule and a summary of its synthesis by
processing from preproinsulin.
Gene Cloning and DNA Analysis by T.A. Brown. © 2006 T.A.
Brown.
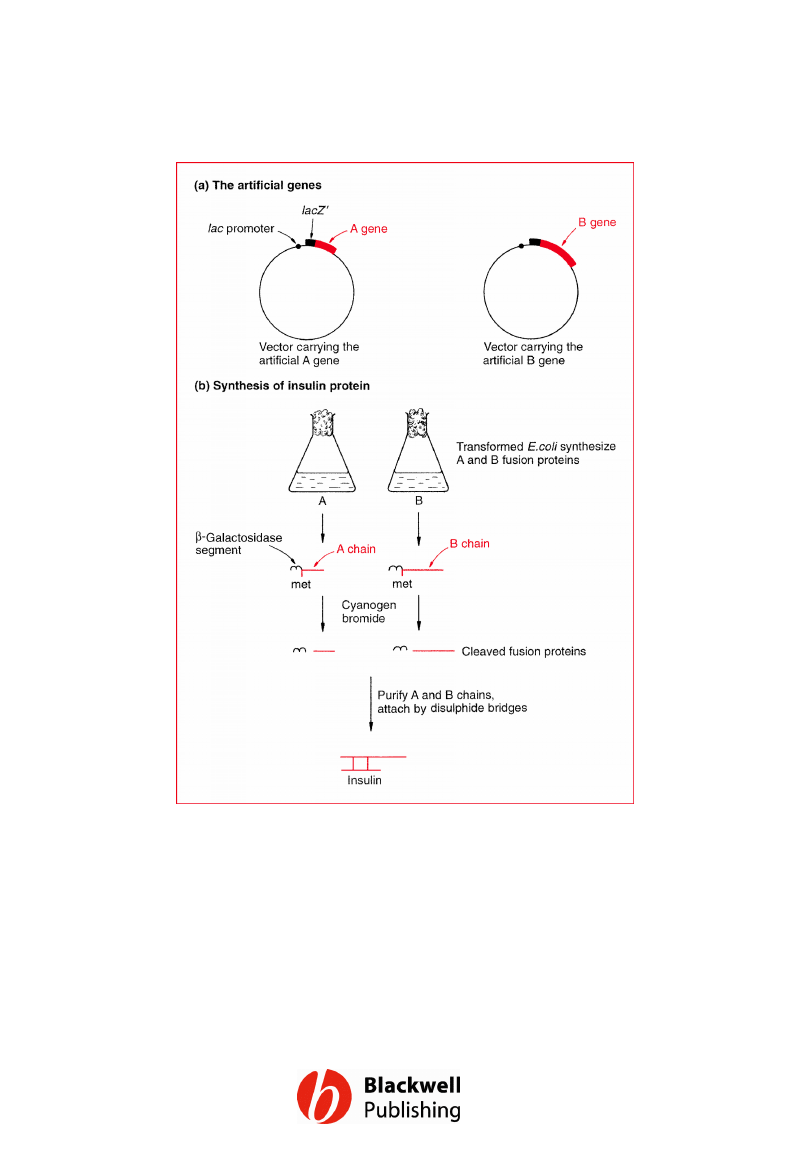
Figure 14.2 The synthesis of recombinant
insulin from artificial A and B chain genes.
Gene Cloning and DNA Analysis by T.A. Brown. © 2006 T.A.
Brown.
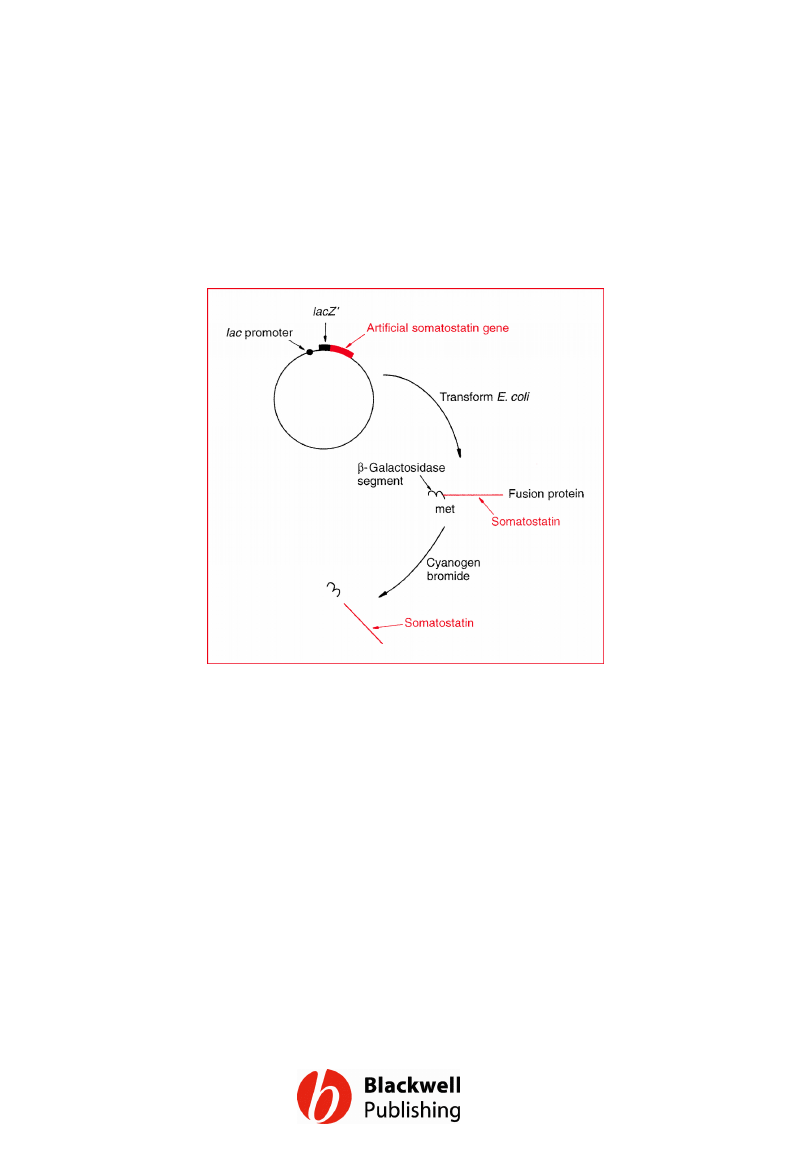
Figure 14.3 Production of recombinant
somatostatin.
Gene Cloning and DNA Analysis by T.A. Brown. © 2006 T.A.
Brown.
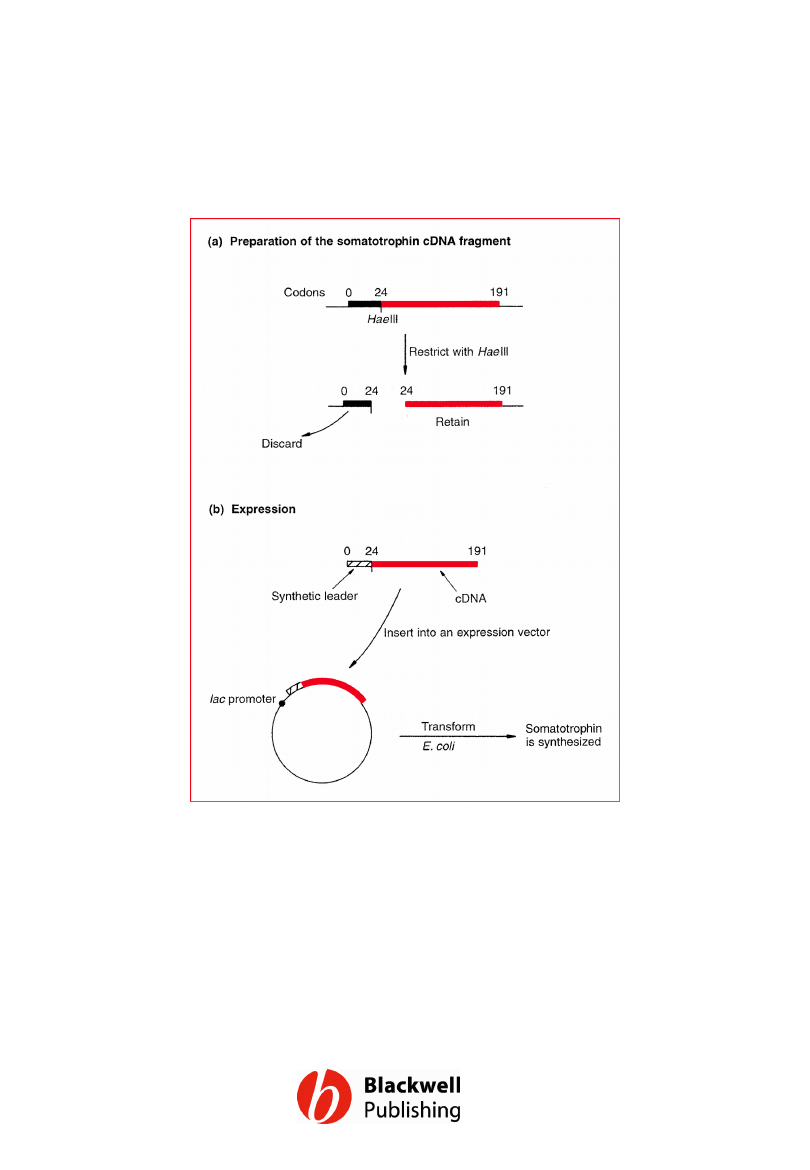
Figure 14.4 Production of recombinant
somatotrophin.
Gene Cloning and DNA Analysis by T.A. Brown. © 2006 T.A.
Brown.
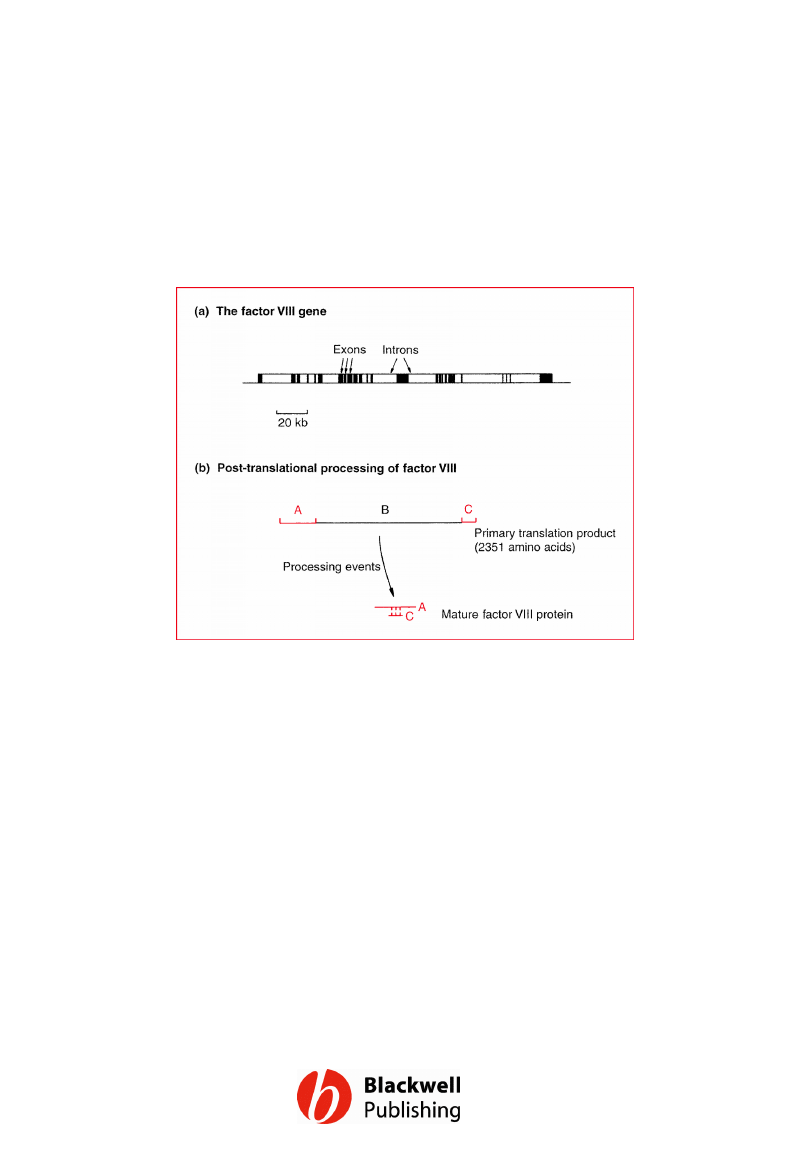
Figure 14.5 The factor VIII gene and its
translation product.
Gene Cloning and DNA Analysis by T.A. Brown. © 2006 T.A.
Brown.
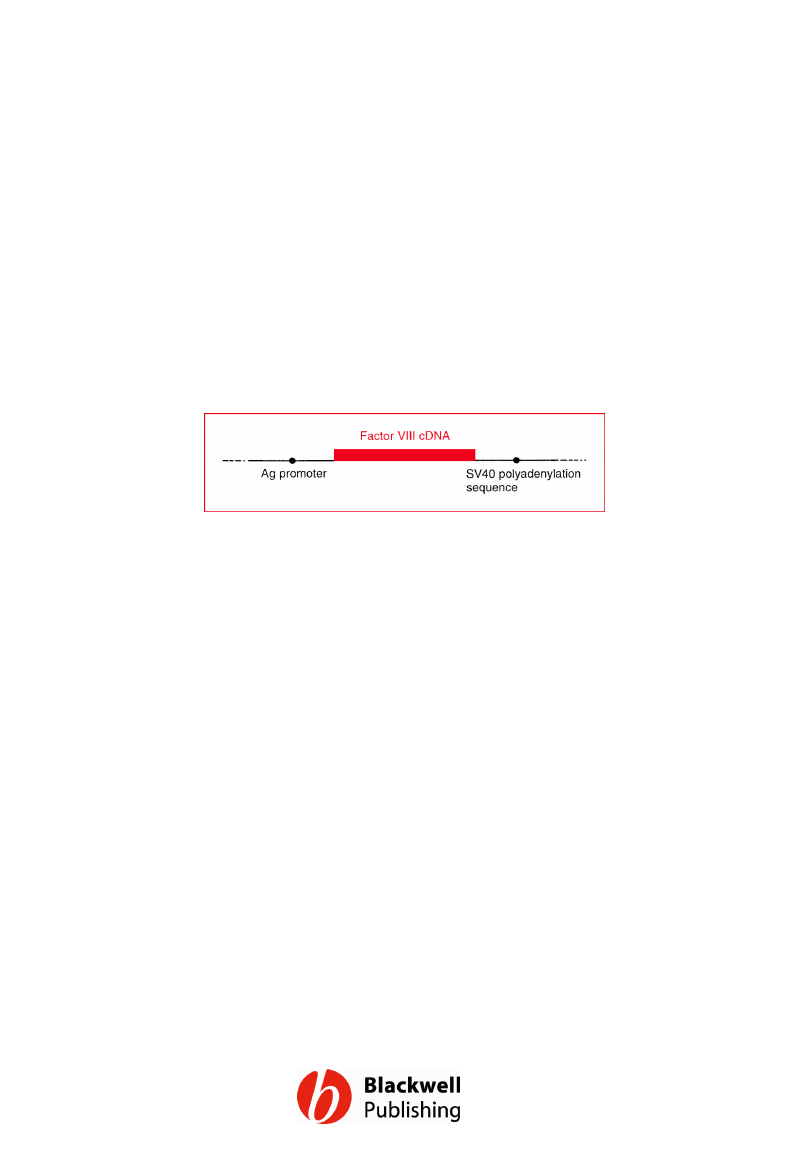
Figure 14.6 The expression signals used in
production of recombinant factor VIII. The
promoter is an artificial hybrid of the chicken
b-actin and rabbit b-globin sequences, and
the polyadenylation signal (needed for correct
processing of the mRNA before translation
into protein) is obtained from SV40 virus.
Gene Cloning and DNA Analysis by T.A. Brown. © 2006 T.A.
Brown.
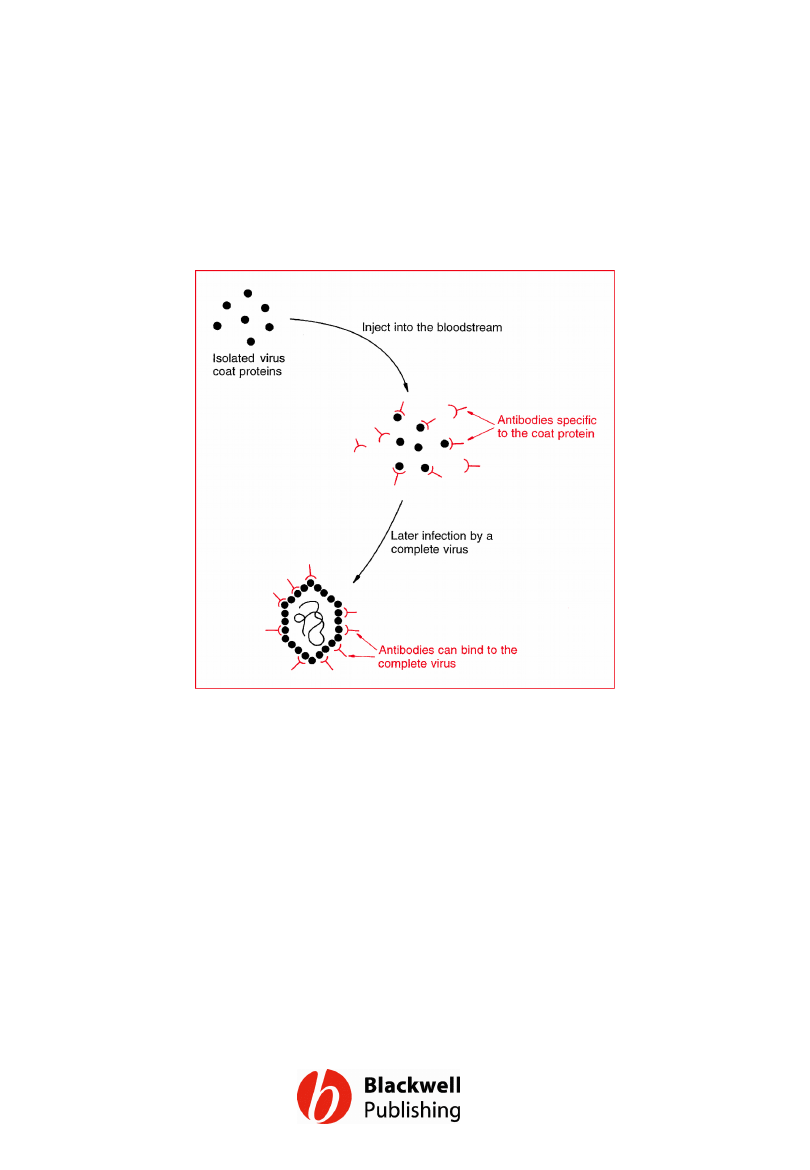
Figure 14.7 The principle behind the use of
a preparation of isolated virus coat proteins
as a vaccine.
Gene Cloning and DNA Analysis by T.A. Brown. © 2006 T.A.
Brown.
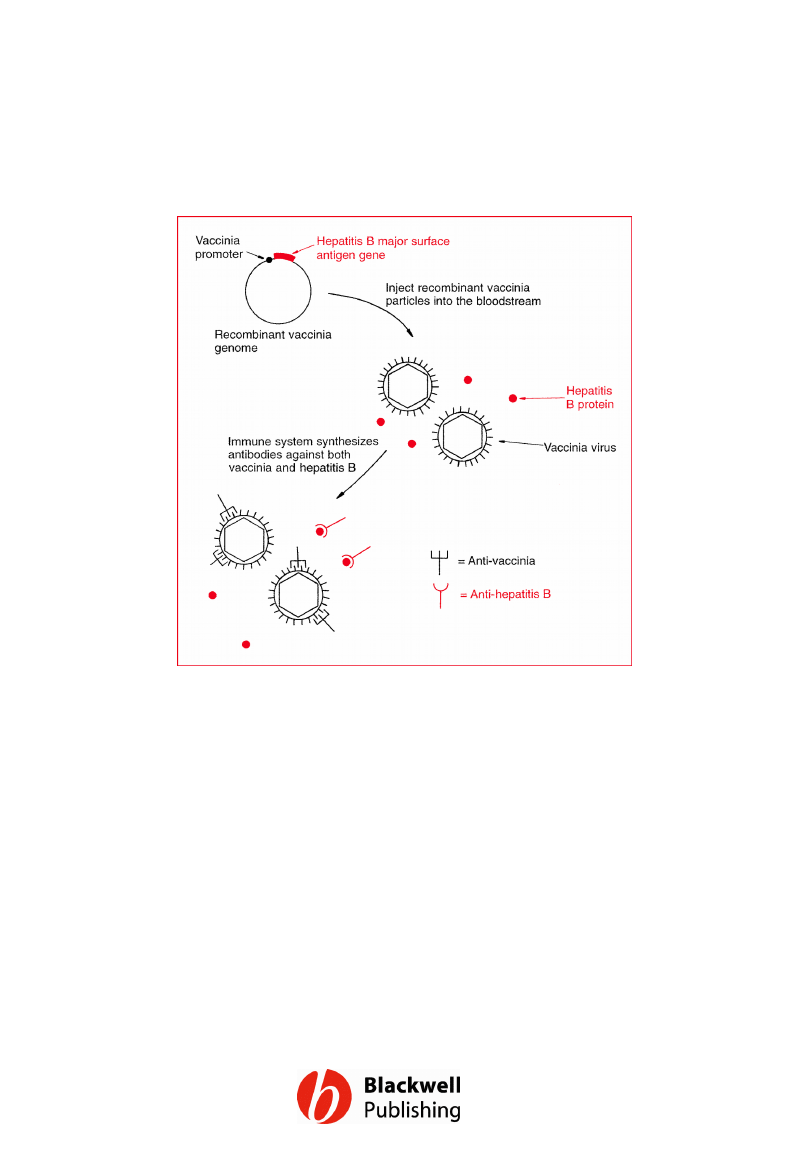
Figure 14.8 The rationale behind the
potential use of a recombinant vaccinia virus.
Gene Cloning and DNA Analysis by T.A. Brown. © 2006 T.A.
Brown.
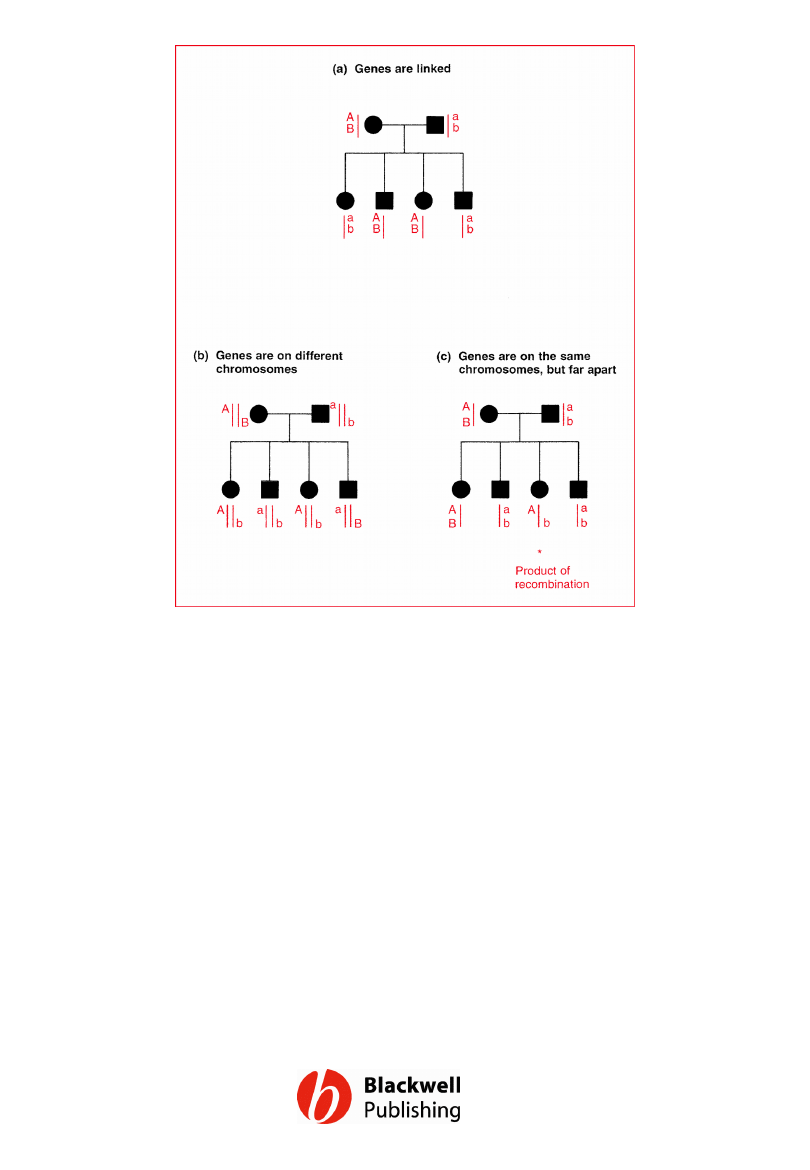
Figure 14.9 Inheritance patterns for linked
and unlinked genes. Three families are
shown, circles representing females and
squares representing males. (a) Two closely
linked genes are almost always inherited
together. (b) Two genes on different
chromosomes display random segregation.
(c) Two genes that are far apart on a single
chromosome are often inherited together, but
recombination may unlink them.
Gene Cloning and DNA Analysis by T.A. Brown. © 2006 T.A.
Brown.
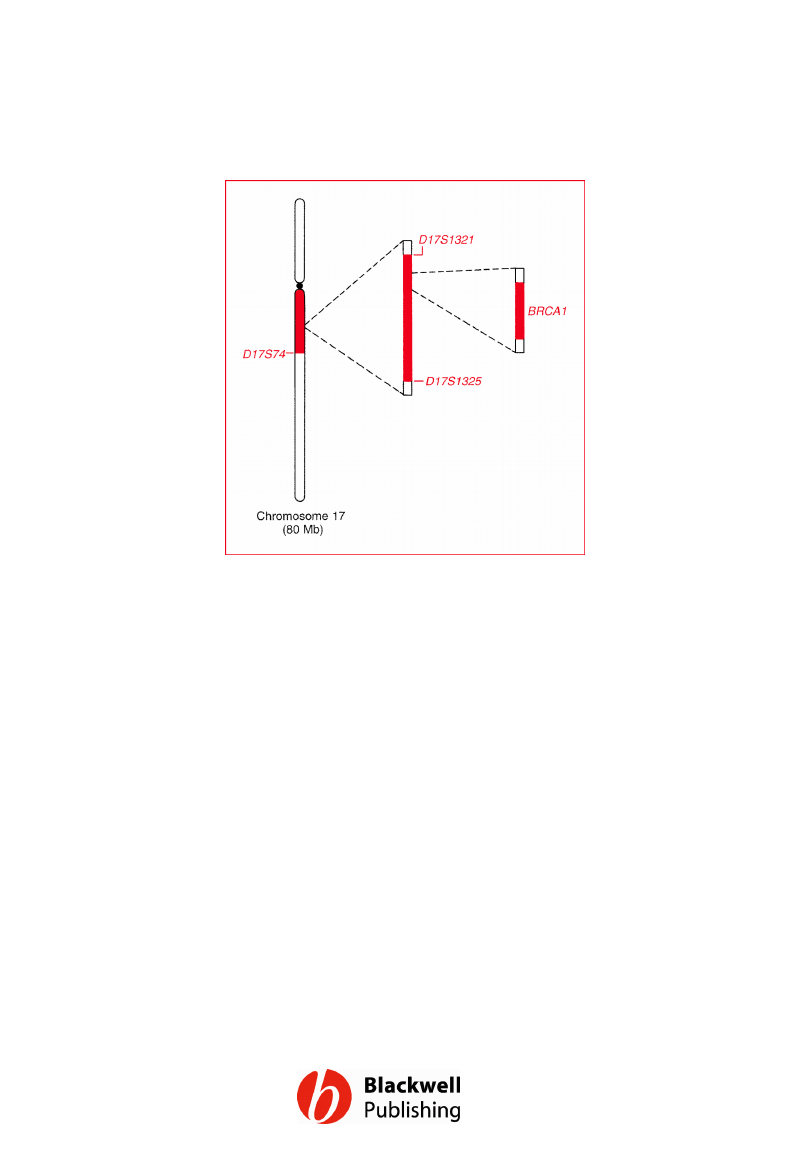
Figure 14.10 Mapping the breast cancer
gene. Initially the gene was mapped to a
20Mb segment of chromosome 17
(highlighted region in the left drawing).
Additional mapping experiments narrowed
this down to a 600kb region flanked by two
previously mapped loci, D17S1321 and
D17S1325 (middle drawing). After
examination of expressed sequences, a
strong candidate for BRCA1 was eventually
identified (right drawing).
Gene Cloning and DNA Analysis by T.A. Brown. © 2006 T.A.
Brown.
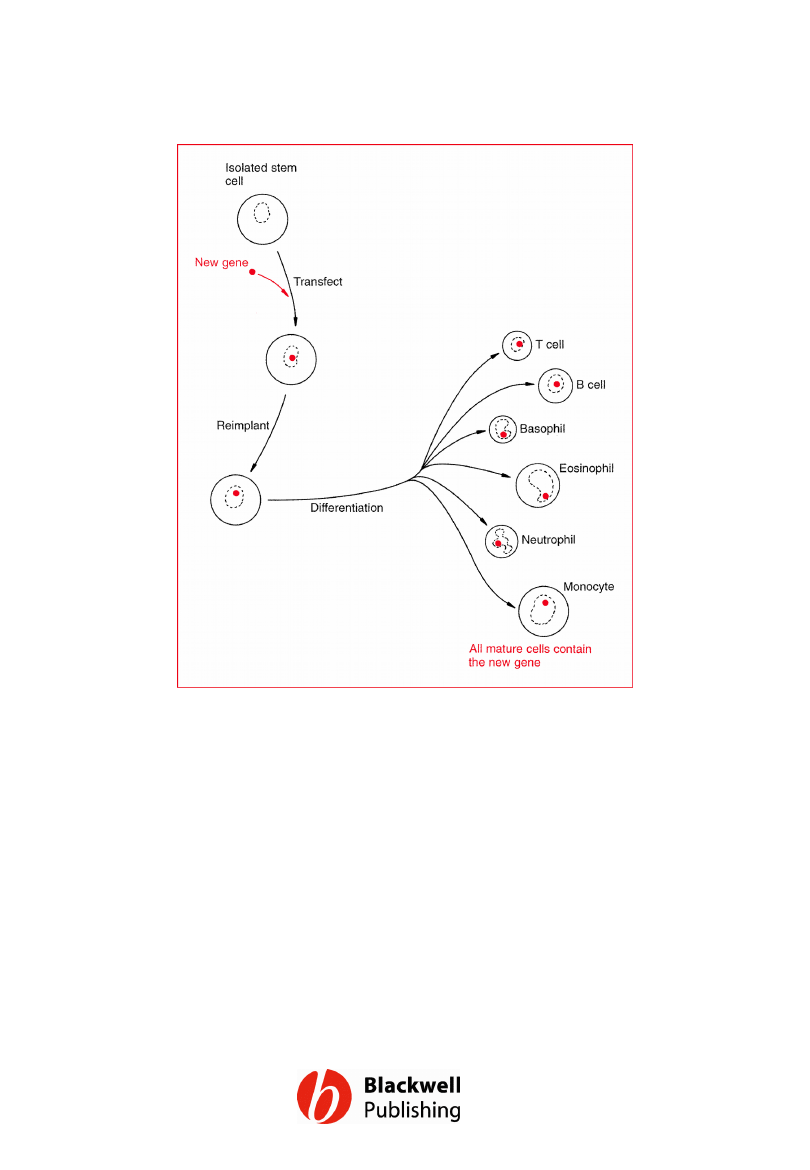
Figure 14.11 Differentiation of a transfected
stem cell leads to the new gene being present
in all the mature blood cells.
Gene Cloning and DNA Analysis by T.A. Brown. © 2006 T.A.
Brown.
Document Outline
- Figure 14.1 The structure of the insulin molecule and a summary of its synthesis by processing from preproinsulin.
- Figure 14.2 The synthesis of recombinant insulin from artificial A and B chain genes.
- Figure 14.3 Production of recombinant somatostatin.
- Figure 14.4 Production of recombinant somatotrophin.
- Figure 14.5 The factor VIII gene and its translation product.
- Figure 14.6 The expression signals used in production of recombinant factor VIII. The promoter is an artificial hybrid of the chicken b-actin and rabbit b-globin sequences, and the polyadenylation signal (needed for correct processing of the mRNA before translation into protein) is obtained from SV40 virus.
- Figure 14.7 The principle behind the use of a preparation of isolated virus coat proteins as a vaccine.
- Figure 14.8 The rationale behind the potential use of a recombinant vaccinia virus.
- Figure 14.9 Inheritance patterns for linked and unlinked genes. Three families are shown, circles representing females and squares representing males. (a) Two closely linked genes are almost always inherited together. (b) Two genes on different chromosomes display random segregation. (c) Two genes that are far apart on a single chromosome are often inherited together, but recombination may unlink them.
- Figure 14.10 Mapping the breast cancer gene. Initially the gene was mapped to a 20Mb segment of chromosome 17 (highlighted region in the left drawing). Additional mapping experiments narrowed this down to a 600kb region flanked by two previously mapped loci, D17S1321 and D17S1325 (middle drawing). After examination of expressed sequences, a strong candidate for BRCA1 was eventually identified (right drawing).
- Figure 14.11 Differentiation of a transfected stem cell leads to the new gene being present in all the mature blood cells.
Wyszukiwarka
Podobne podstrony:
Figures for chapter 5
Figures for chapter 12
Figures for chapter 6
Figures for chapter 10
Figures for chapter 11
Figures for chapter 8
Figures for chapter 9
Figures for chapter 2
Figures for chapter 16
Figures for chapter 13
Figures for chapter 3
Figures for chapter 7
Figures for chapter 15
Figures for chapter 1
Figures for chapter 5
Figures for chapter 12
Figures for chapter 6
Figures for chapter 10
więcej podobnych podstron