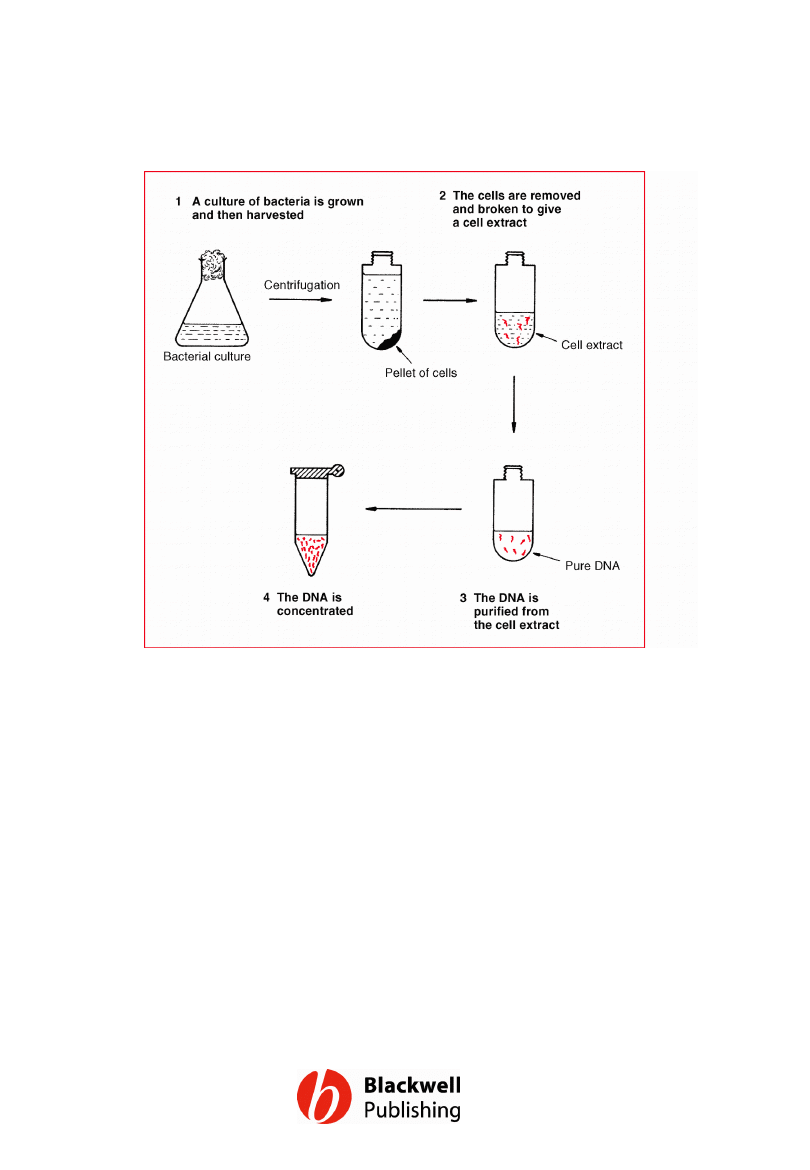
Figure 3.1 The basic steps in preparation of
total cell DNA from a culture of bacteria.
Gene Cloning and DNA Analysis by T.A. Brown. © 2006 T.A.
Brown.
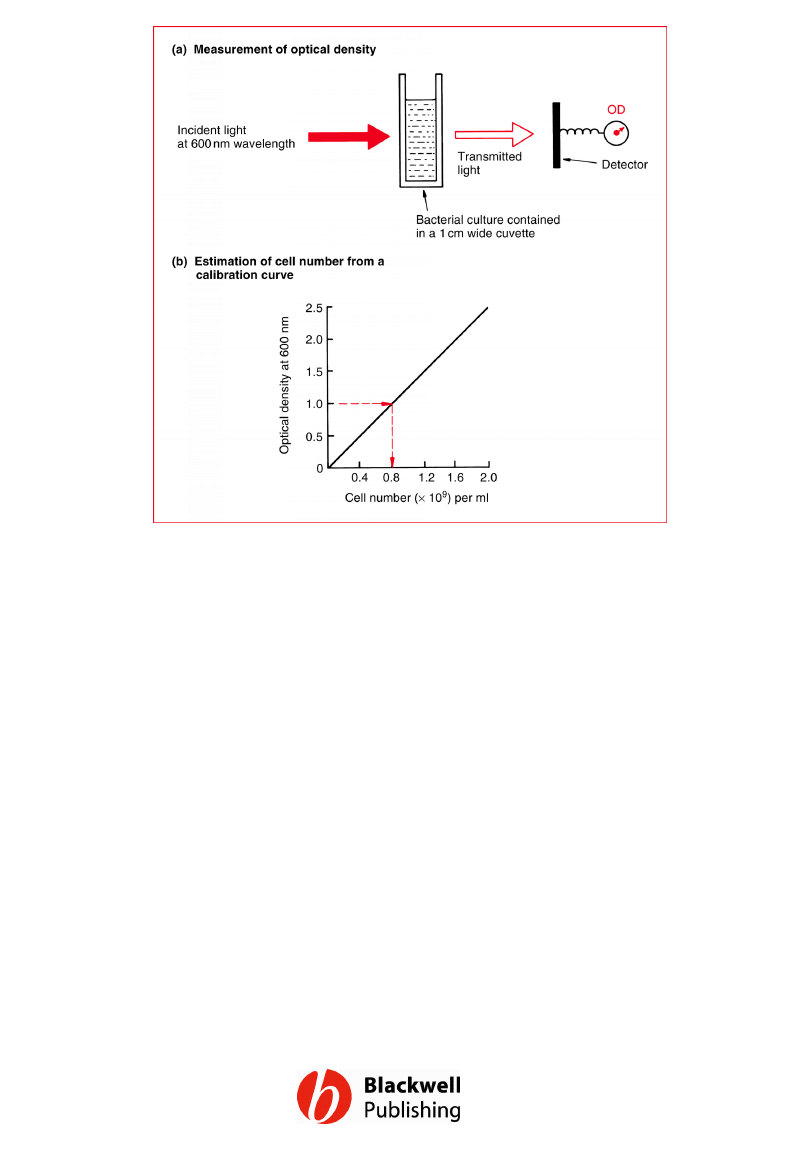
Figure 3.2 Estimation of bacterial cell number by
measurement of optical density (OD). (a) A sample
of the culture is placed in a glass cuvette and light
with a wavelength of 600nm shone through. The
amount of light that passes through the culture is
measured and the OD (also called the absorbance)
calculated as 1 OD unit = -log10 (intensity of
transmitted light)/(intensity of incident light). The
operation is performed with a spectrophotometer.
(b) The cell number corresponding to the OD
reading is calculated from a calibration curve. This
curve is plotted from the OD values of a series of
cultures of known cell density. For E. coli, 1 OD unit
= 0.8 ´ 109 cells/ml.
Gene Cloning and DNA Analysis by T.A. Brown. © 2006 T.A.
Brown.
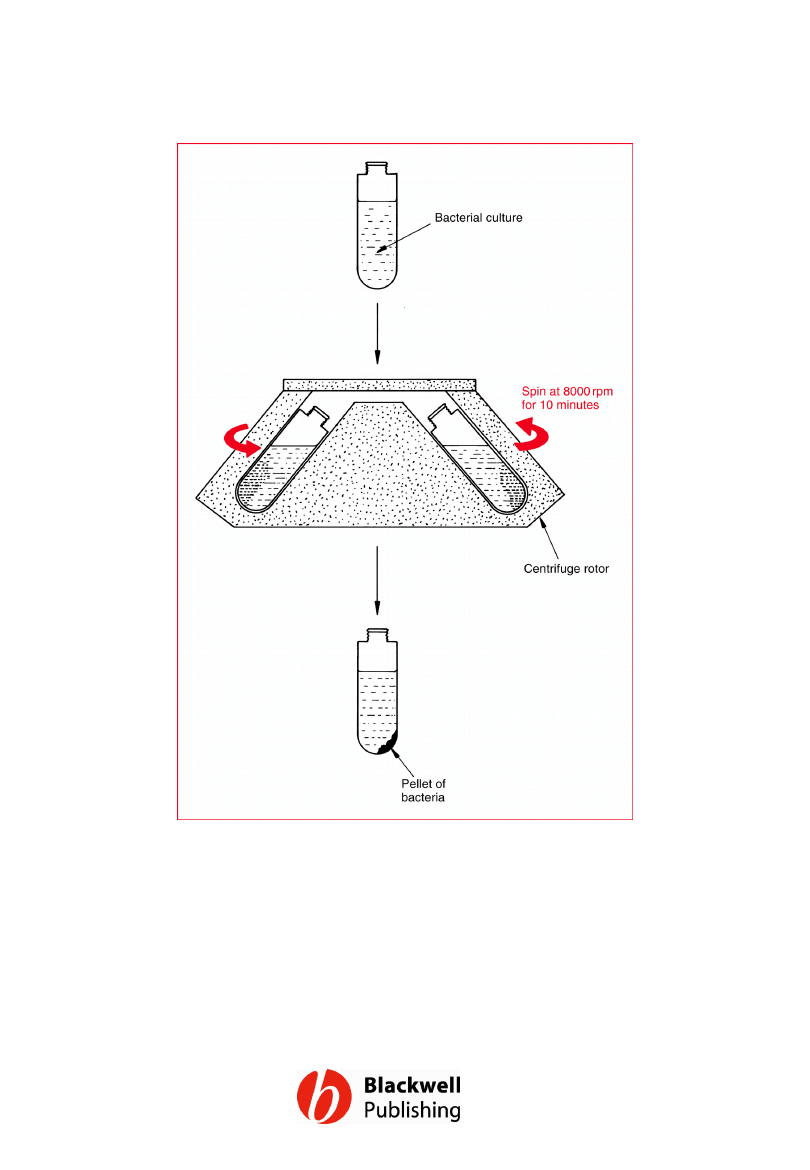
Figure 3.3 Harvesting bacteria by
centrifugation.
Gene Cloning and DNA Analysis by T.A. Brown. © 2006 T.A.
Brown.
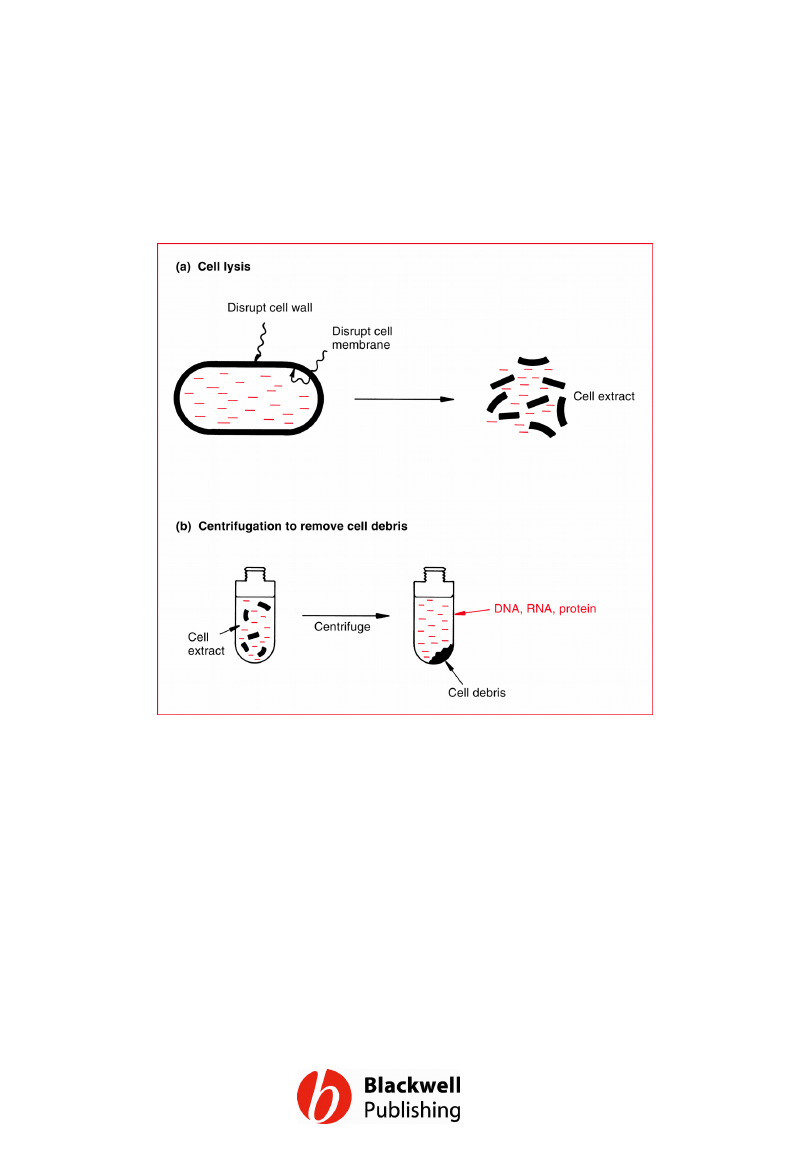
Figure 3.4 Preparation of a cell extract. (a)
Cell lysis. (b) Centrifugation of the cell extract
to remove insoluble debris.
Gene Cloning and DNA Analysis by T.A. Brown. © 2006 T.A.
Brown.
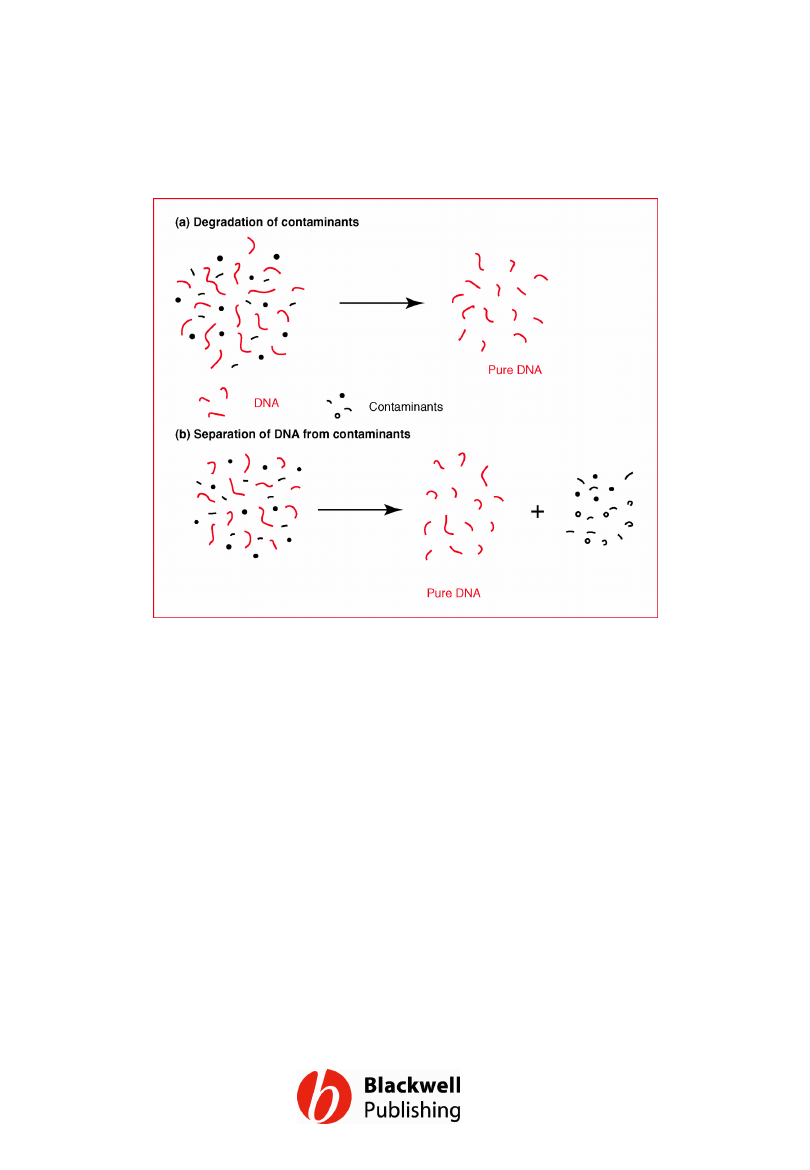
Figure 3.5 Two approaches to DNA
purification. (a) Treating the mixture with
reagents which degrade the contaminants,
leaving a pure solution of DNA. (b) Separating
the mixture into different fractions, one of
which is pure DNA.
Gene Cloning and DNA Analysis by T.A. Brown. © 2006 T.A.
Brown.
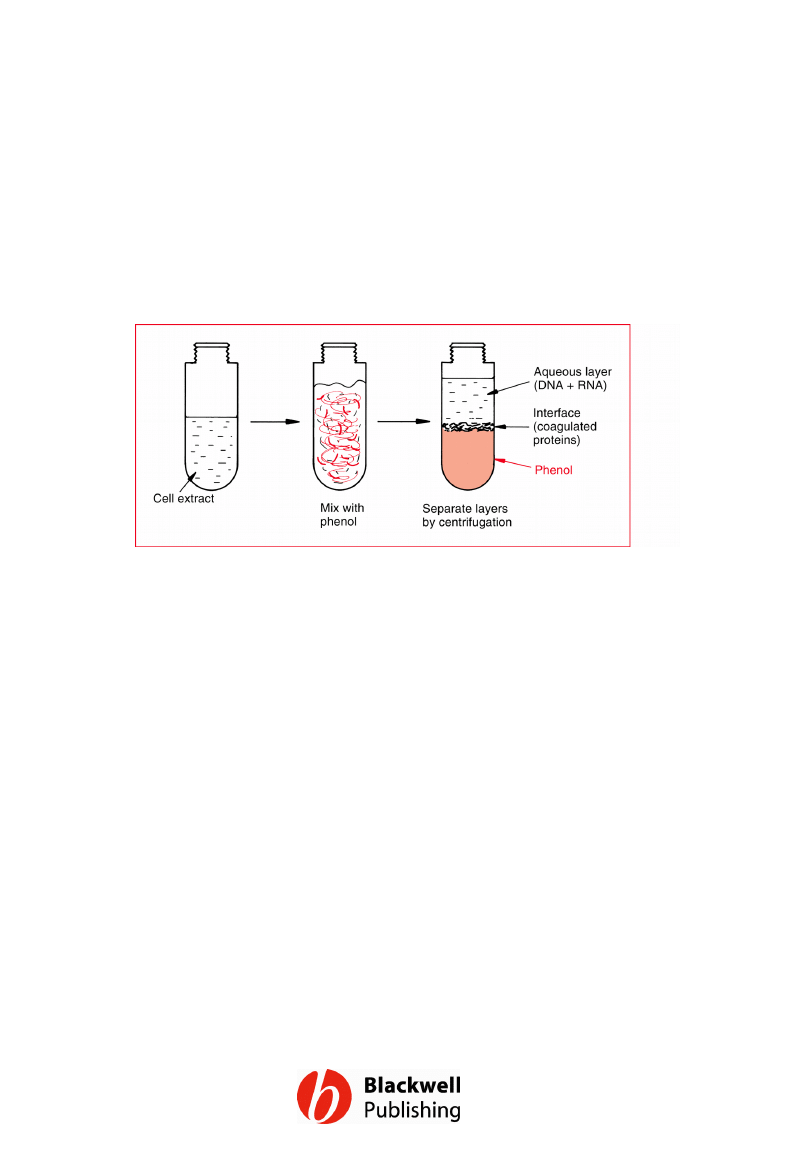
Figure 3.6 Removal of protein contaminants
by phenol extraction.
Gene Cloning and DNA Analysis by T.A. Brown. © 2006 T.A.
Brown.
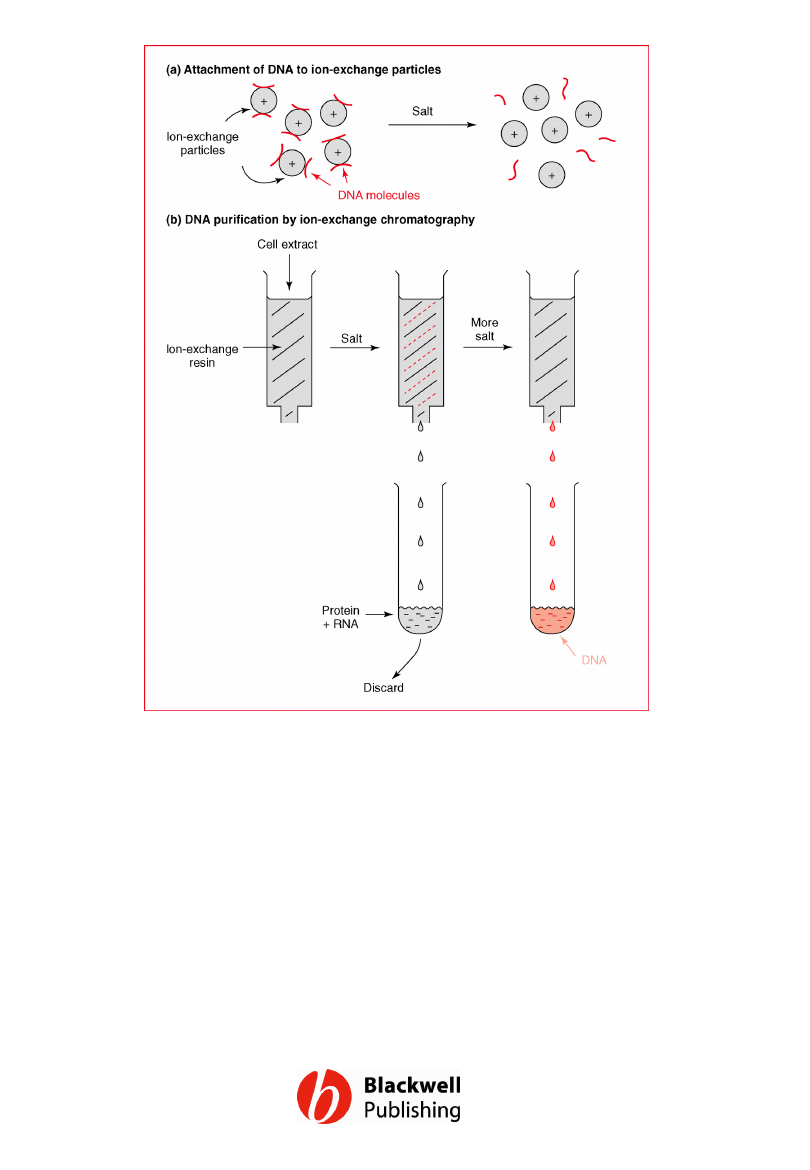
Figure 3.7 DNA purification by ion-exchange
chromatography. (a) Attachment of DNA to
ion-exchange particles. (b) DNA is purified by
column chromatography. The solutions
passing through the column can be collected
by gravity flow or by the spin column
method, in which the column is placed in a
low-speed centrifuge.
Gene Cloning and DNA Analysis by T.A. Brown. © 2006 T.A.
Brown.
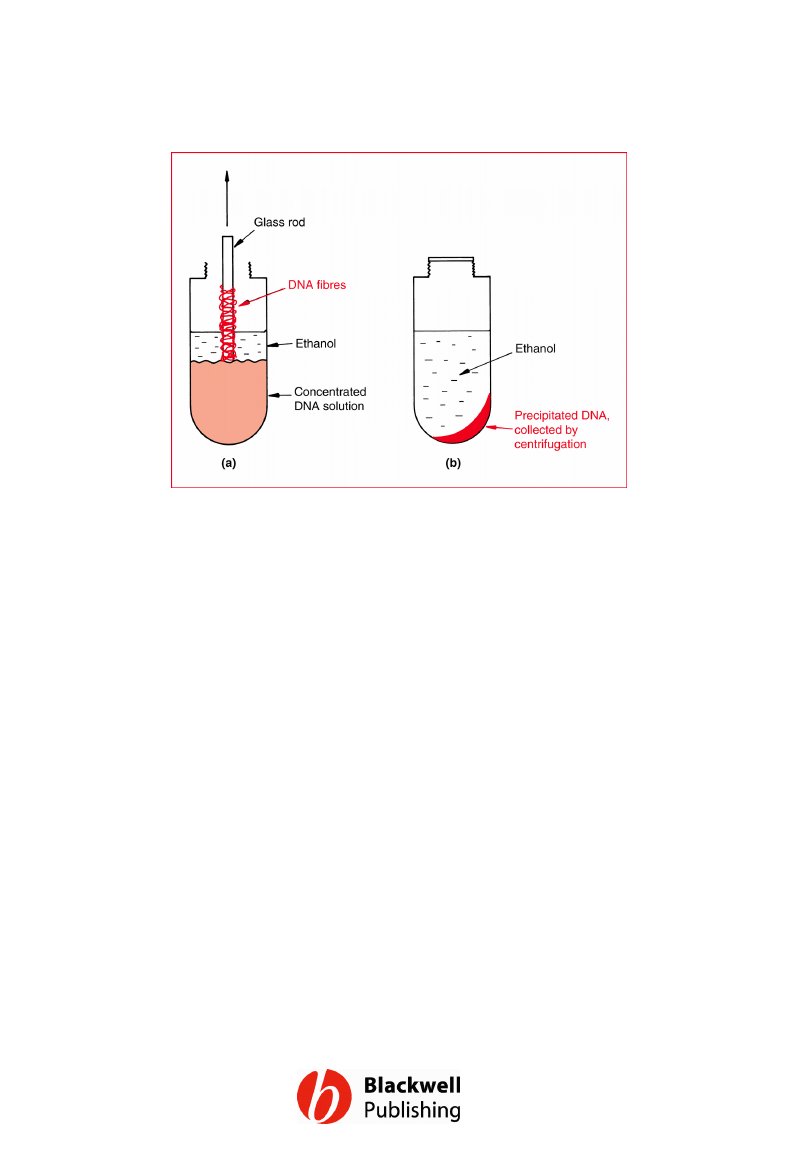
Figure 3.8 Collecting DNA by ethanol
precipitation. (a) Absolute ethanol is layered
on top of a concentrated solution of DNA.
Fibres of DNA can be withdrawn with a glass
rod. (b) For less concentrated solutions
ethanol is added (at a ratio of 2.5 volumes of
absolute ethanol to 1 volume of DNA solution)
and precipitated DNA collected by
centrifugation.
Gene Cloning and DNA Analysis by T.A. Brown. © 2006 T.A.
Brown.
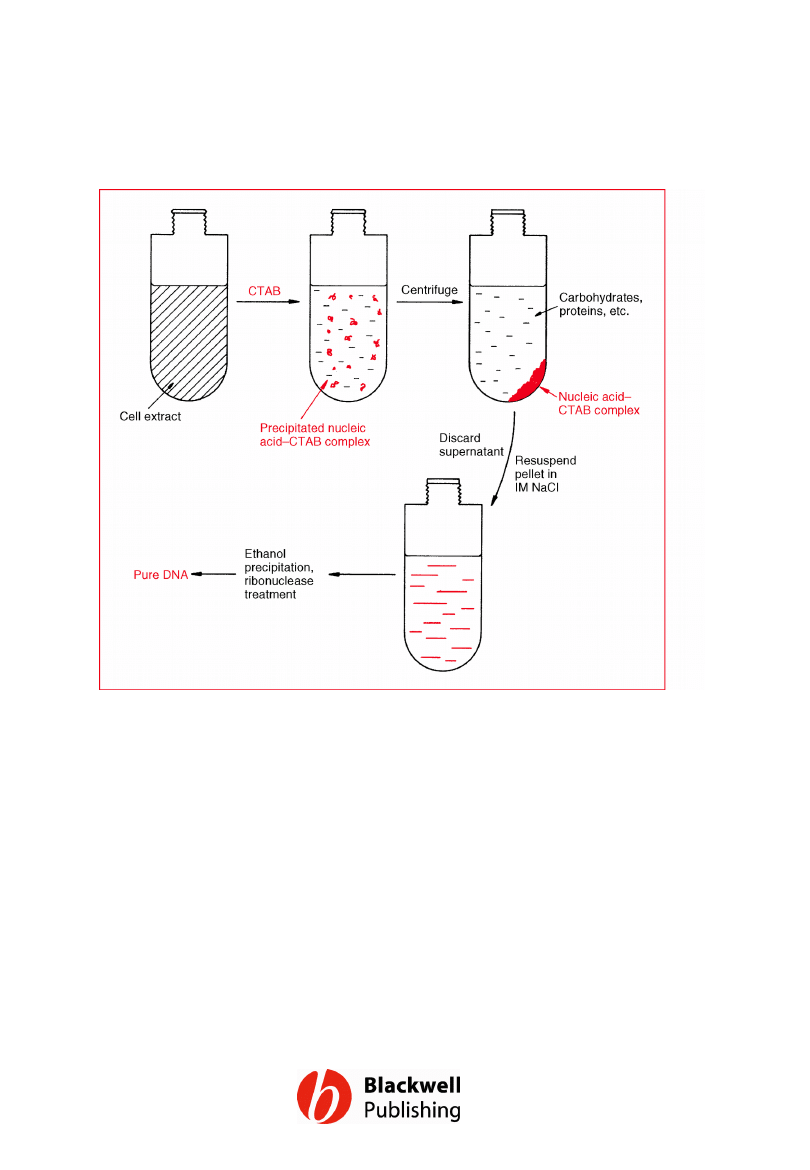
Figure 3.9 The CTAB method for purification
of plant DNA.
Gene Cloning and DNA Analysis by T.A. Brown. © 2006 T.A.
Brown.
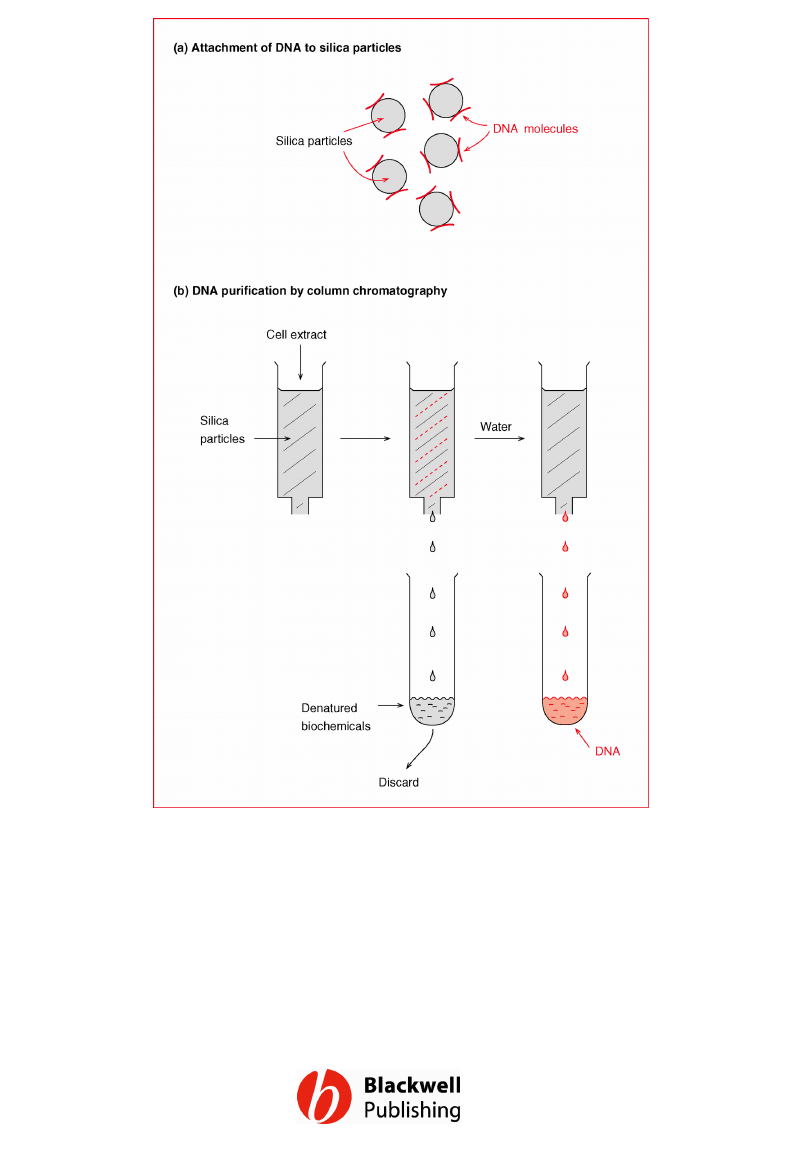
Figure 3.10 DNA purification by the
guanidinium thiocyanate and silica method.
(a) In the presence of guanidinium
thiocyanate, DNA binds to silica particles. (b)
DNA is purified by column chromatography.
Gene Cloning and DNA Analysis by T.A. Brown. © 2006 T.A.
Brown.
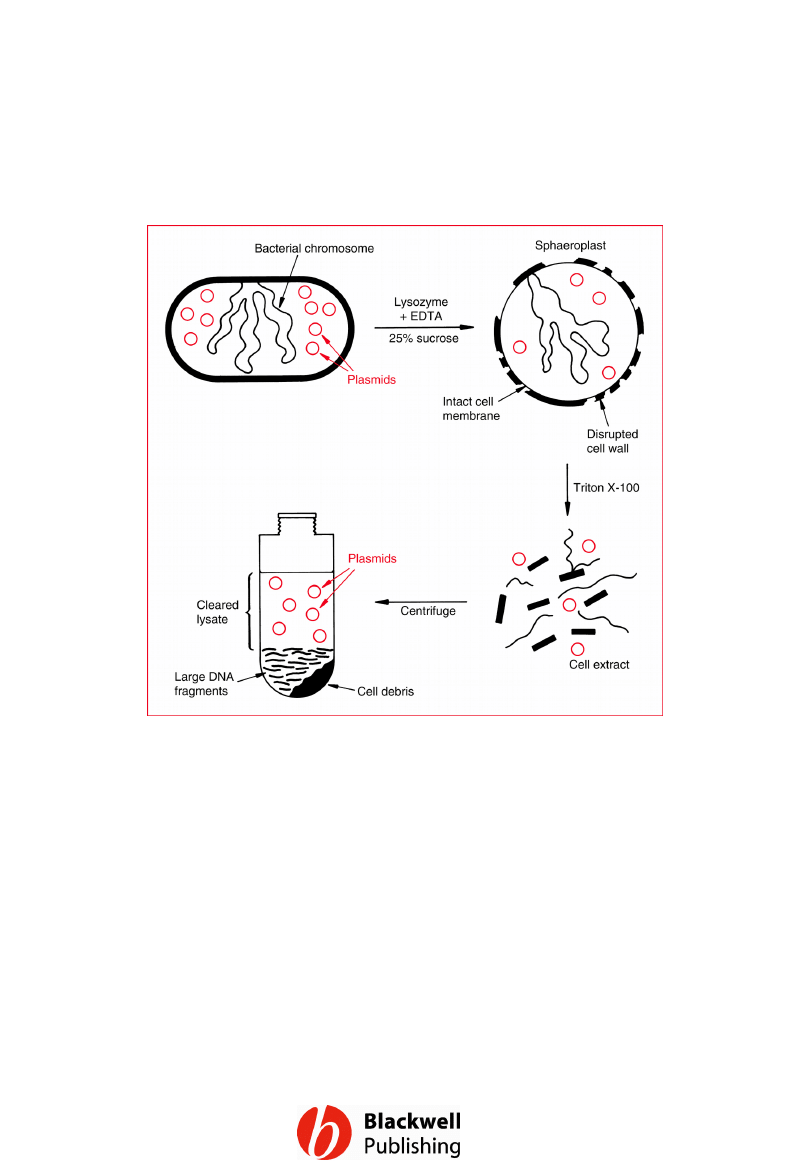
Figure 3.11 Preparation of a cleared lysate.
Gene Cloning and DNA Analysis by T.A. Brown. © 2006 T.A.
Brown.
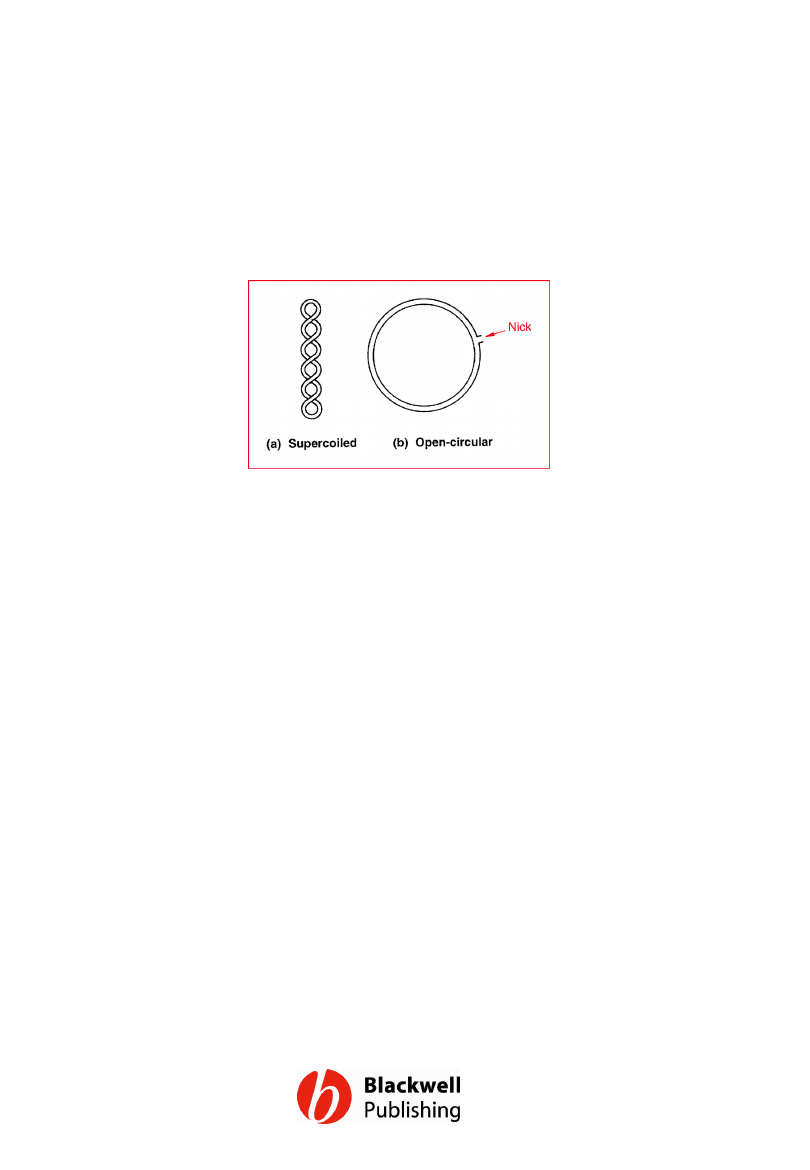
Figure 3.12 Two conformations of circular
double-stranded DNA: (a) supercoiled – both
strands are intact; (b) open-circular – one or
both strands are nicked.
Gene Cloning and DNA Analysis by T.A. Brown. © 2006 T.A.
Brown.
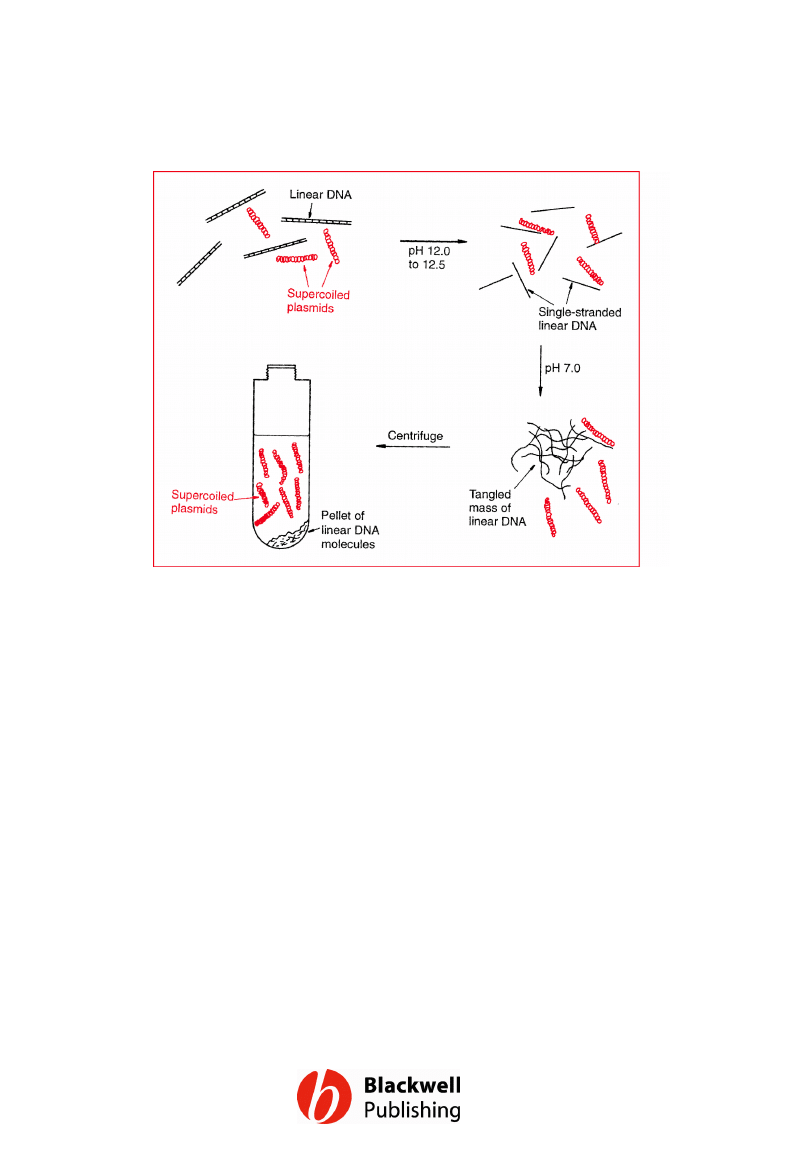
Figure 3.13 Plasmid purification by the
alkaline denaturation method.
Gene Cloning and DNA Analysis by T.A. Brown. © 2006 T.A.
Brown.
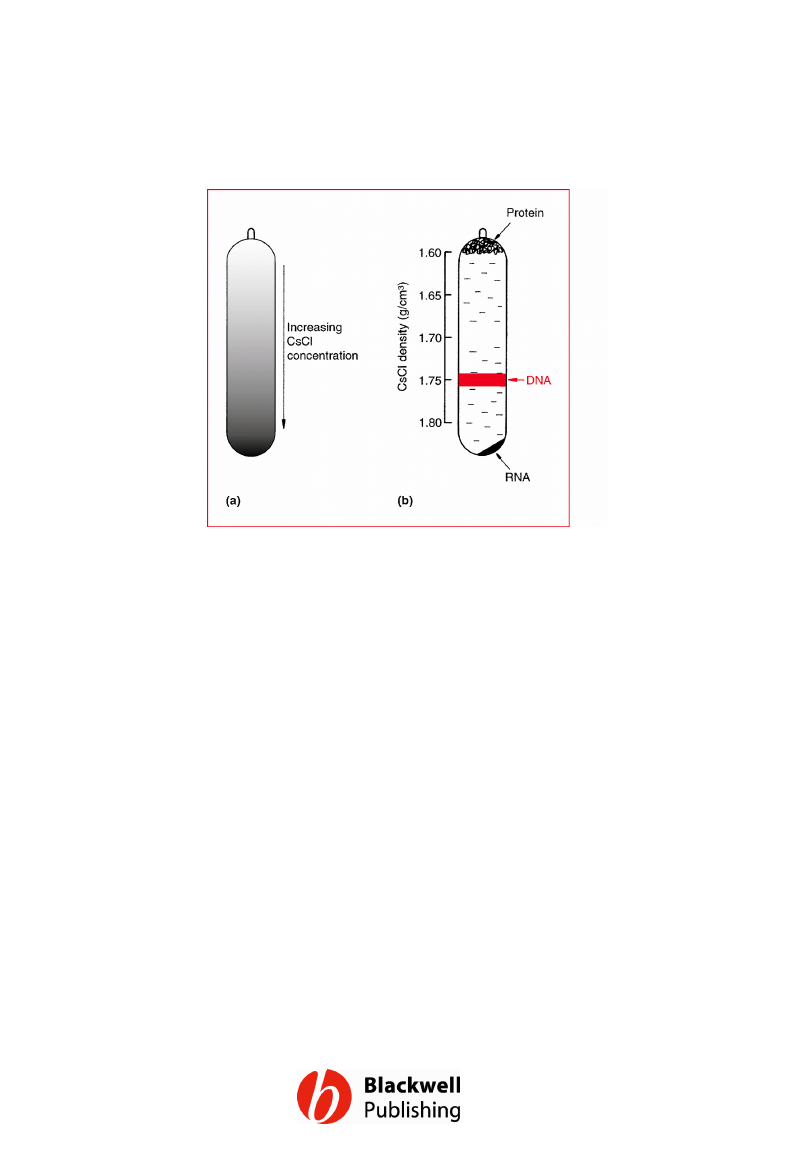
Figure 3.14 Caesium chloride density
gradient centrifugation. (a) A CsCl density
gradient produced by high speed
centrifugation. (b) Separation of protein, DNA
and RNA in a density gradient.
Gene Cloning and DNA Analysis by T.A. Brown. © 2006 T.A.
Brown.
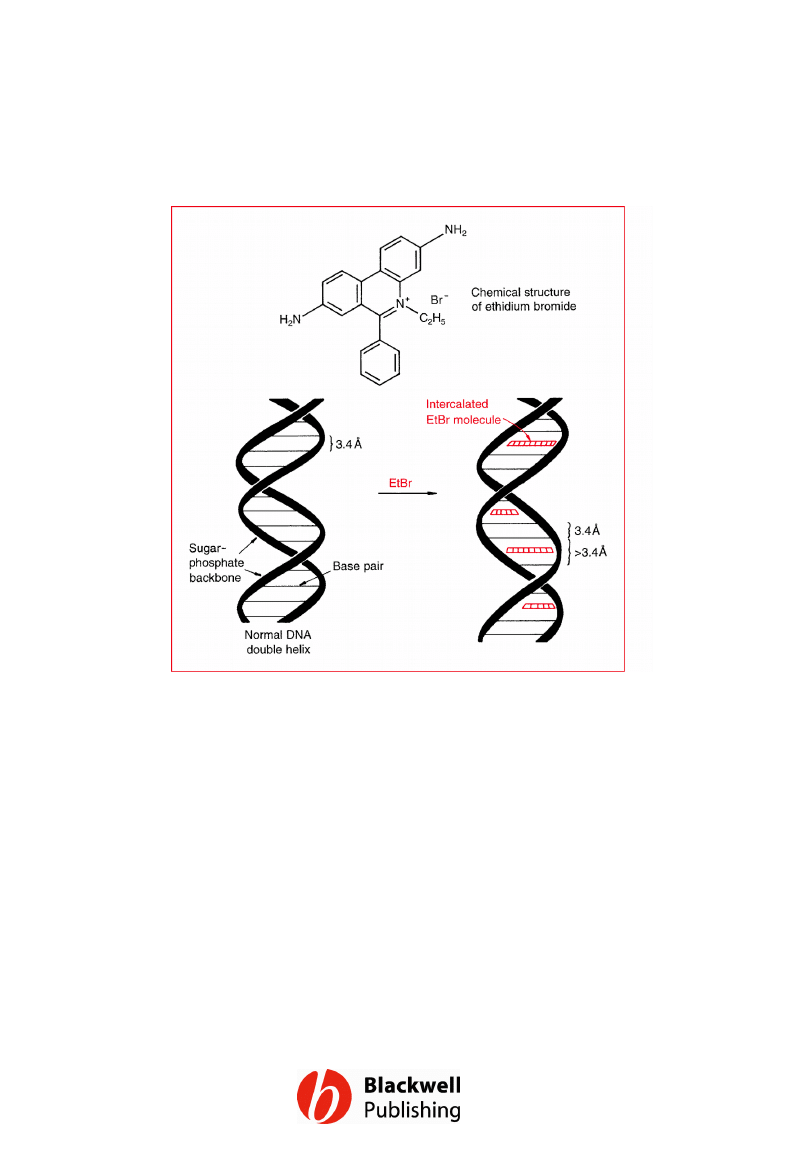
Figure 3.15 Partial unwinding of the DNA
double helix by EtBr intercalation between
adjacent base pairs. The normal DNA molecule
shown on the left is partially unwound by
taking up four EtBr molecules, resulting in the
‘stretched’ structure on the right.
Gene Cloning and DNA Analysis by T.A. Brown. © 2006 T.A.
Brown.
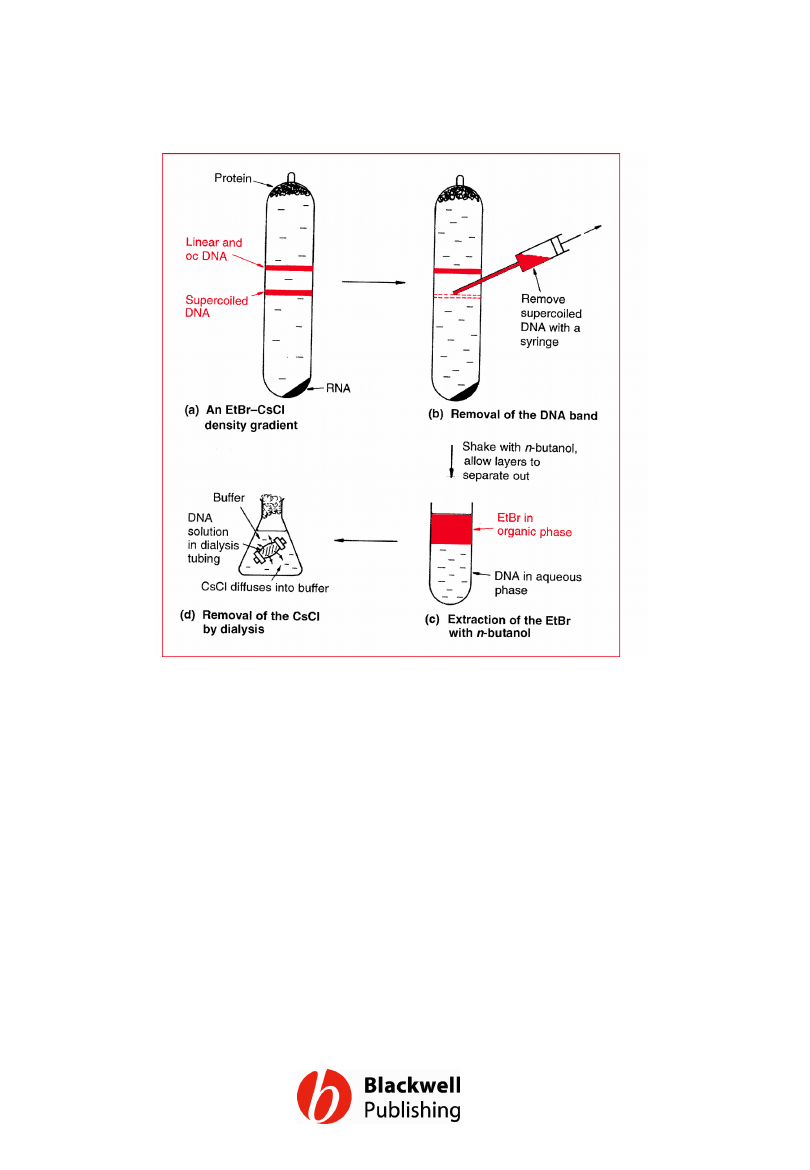
Figure 3.16 Purification of plasmid DNA by
EtBr–CsCl density gradient centrifugation.
Gene Cloning and DNA Analysis by T.A. Brown. © 2006 T.A.
Brown.
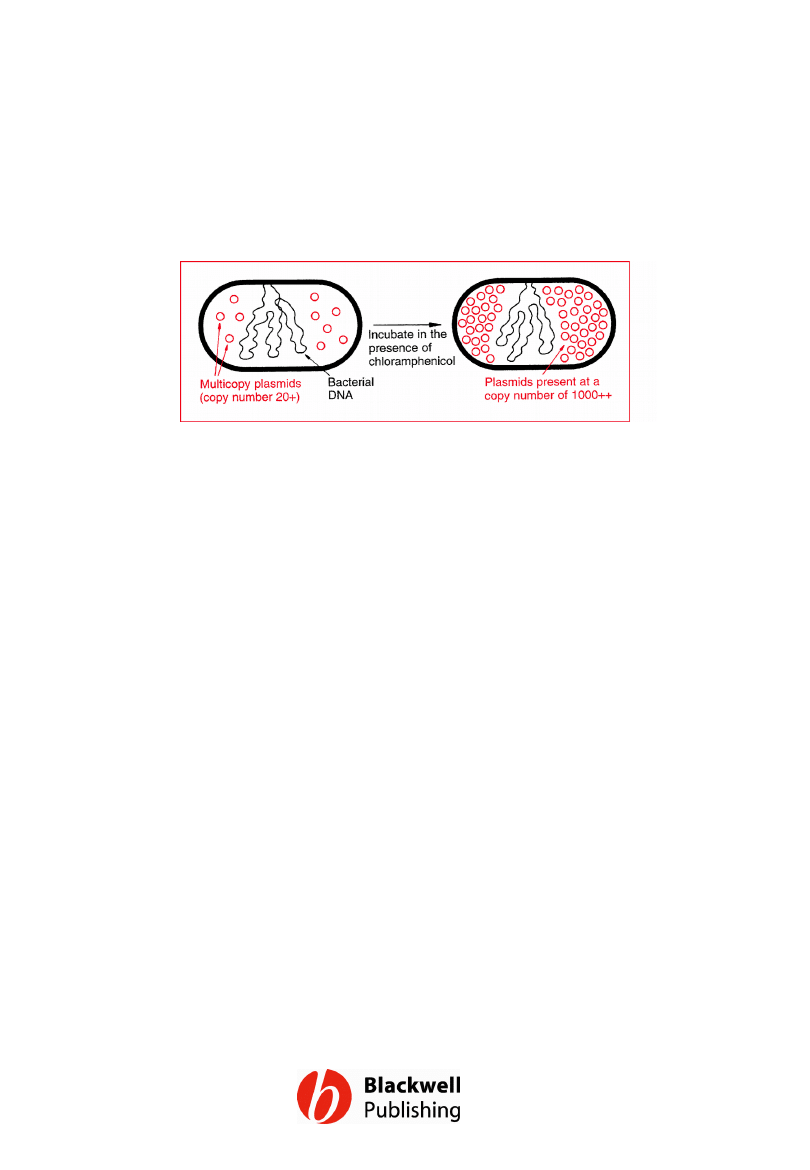
Figure 3.17 Plasmid amplification.
Gene Cloning and DNA Analysis by T.A. Brown. © 2006 T.A.
Brown.
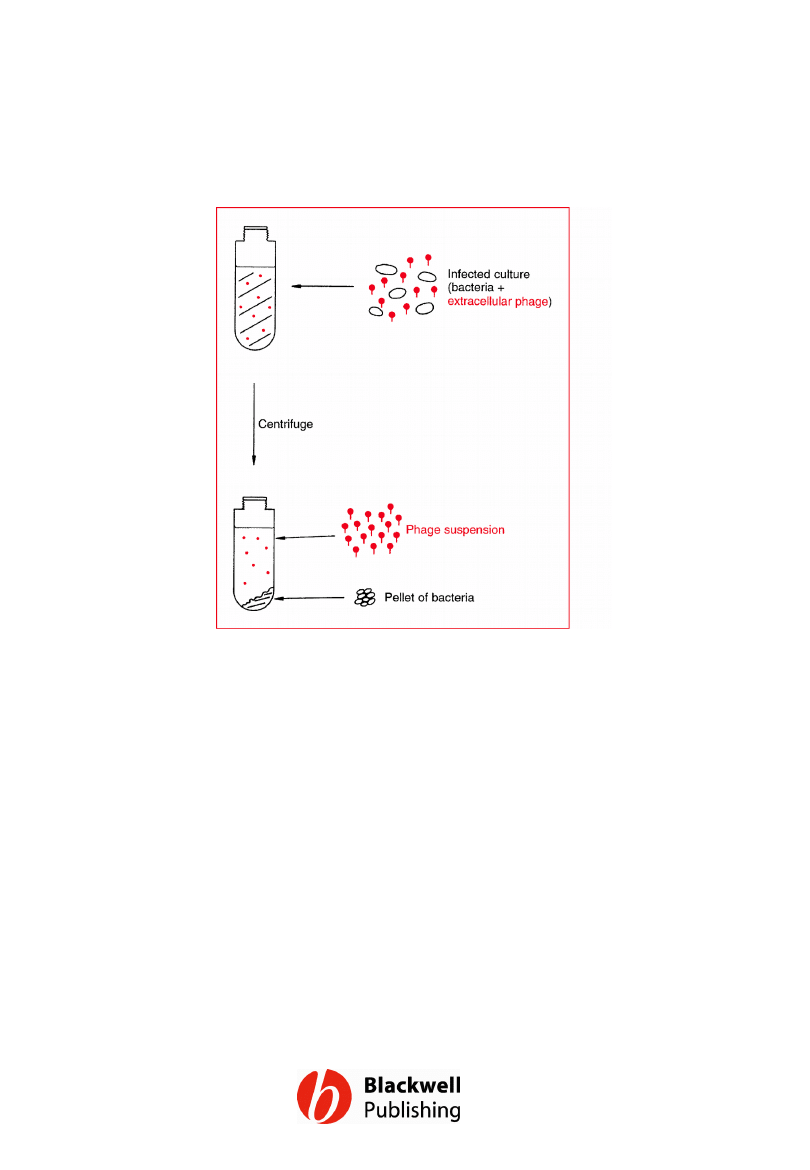
Figure 3.18 Preparation of a phage
suspension from an infected culture of
bacteria.
Gene Cloning and DNA Analysis by T.A. Brown. © 2006 T.A.
Brown.
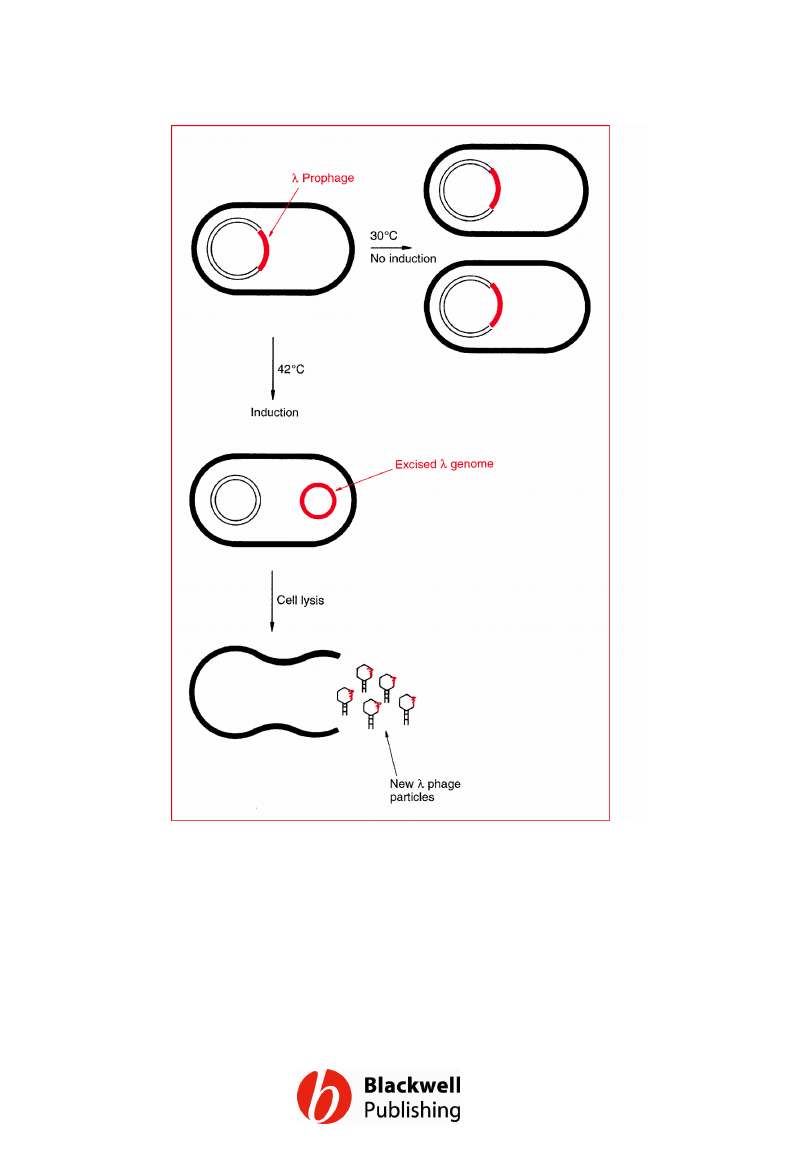
Figure 3.19 Induction of a l cIts lysogen by
transferring from 30°C to 42°C.
Gene Cloning and DNA Analysis by T.A. Brown. © 2006 T.A.
Brown.
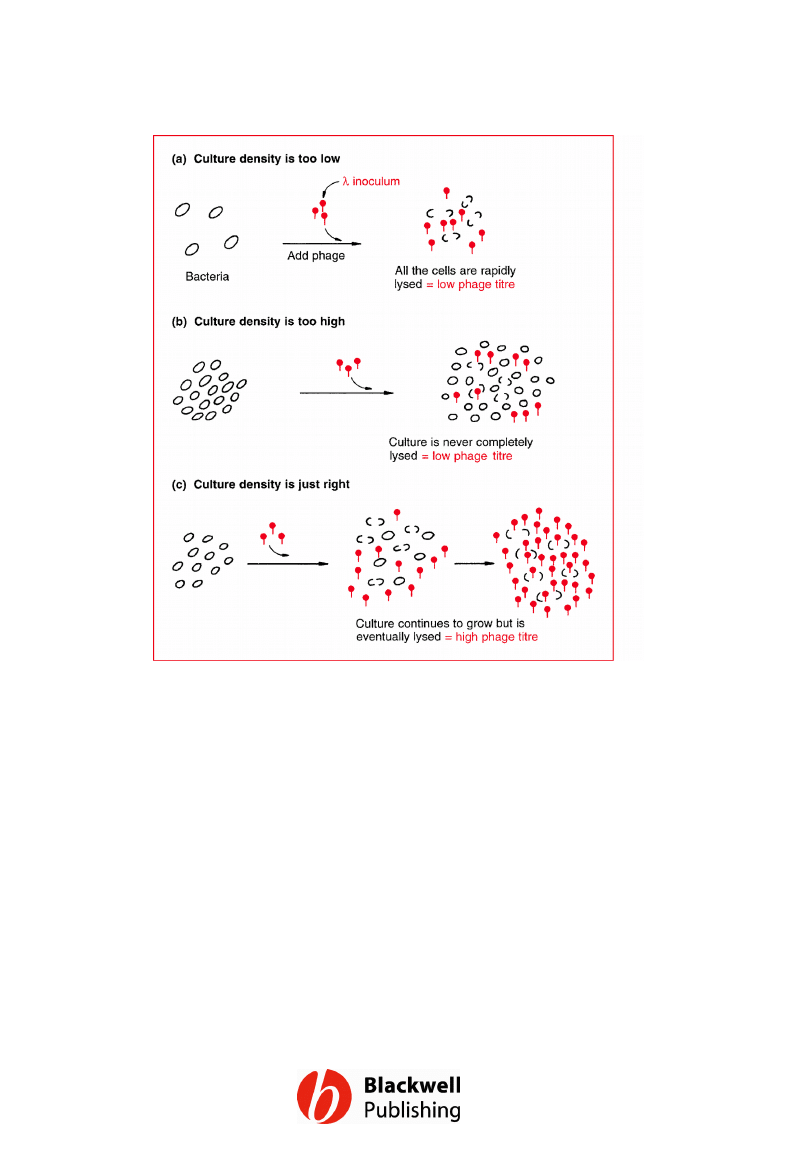
Figure 3.20 Achieving the right balance
between culture age and inoculum size when
preparing a sample of a non-lysogenic phage.
Gene Cloning and DNA Analysis by T.A. Brown. © 2006 T.A.
Brown.
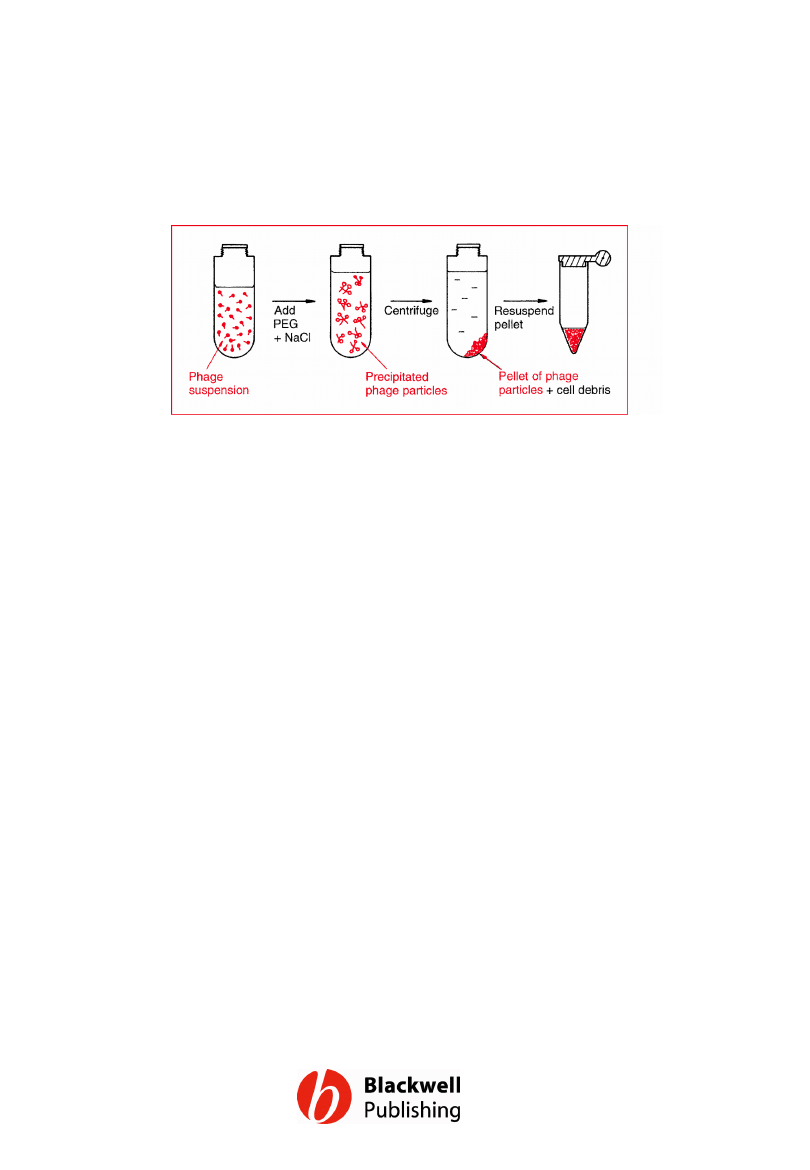
Figure 3.21 Collection of phage particles by
polyethylene glycol (PEG) precipitation.
Gene Cloning and DNA Analysis by T.A. Brown. © 2006 T.A.
Brown.
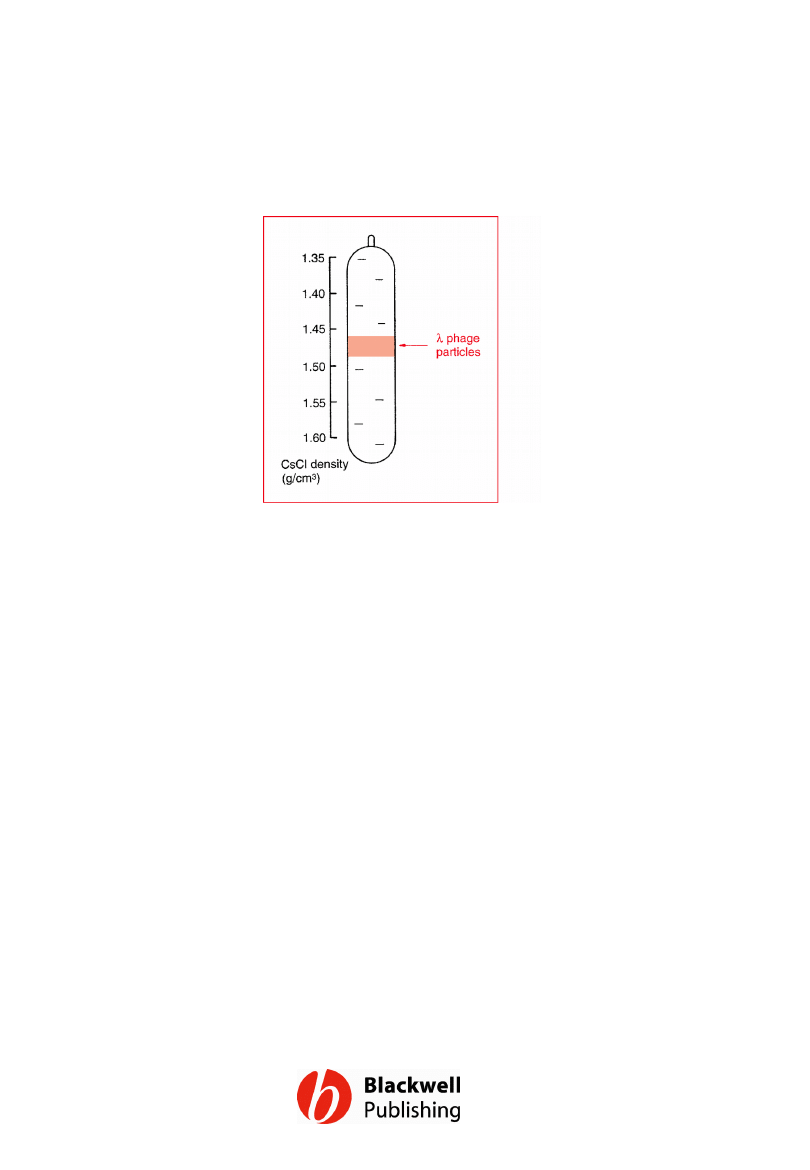
Figure 3.22 Purification of l phage particles
by CsCl density gradient centrifugation.
Gene Cloning and DNA Analysis by T.A. Brown. © 2006 T.A.
Brown.
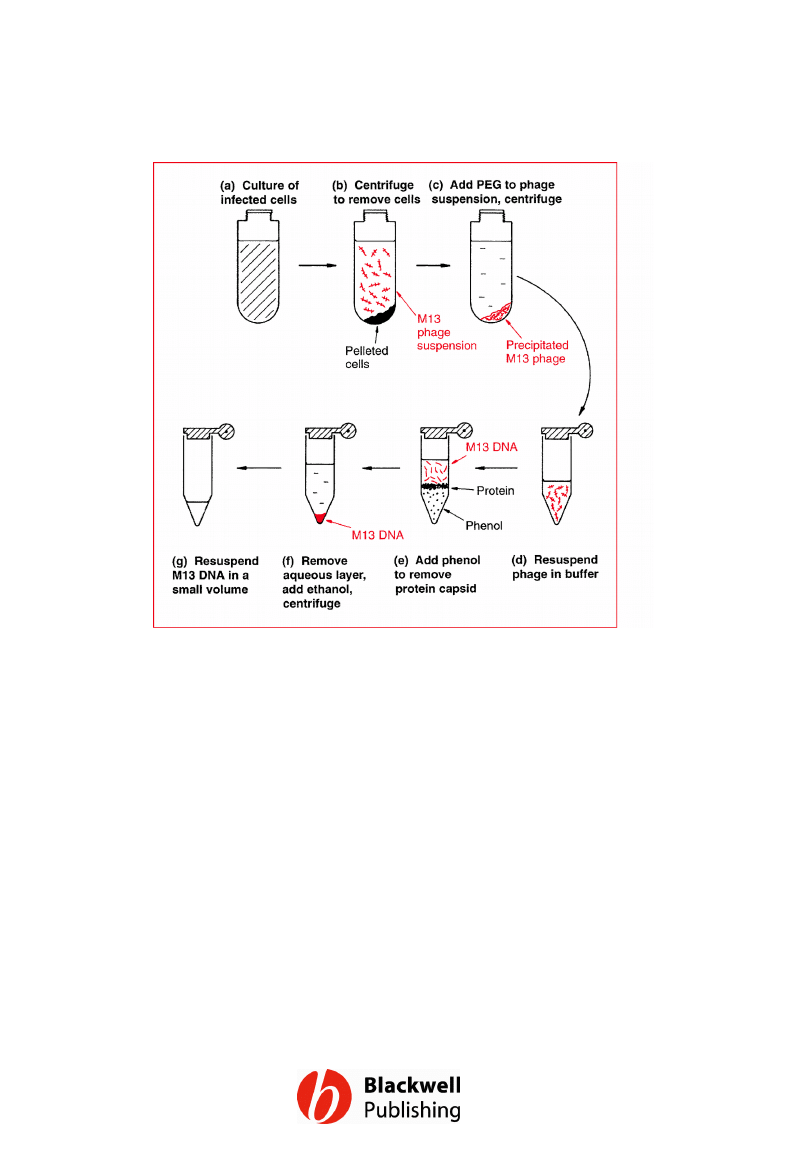
Figure 3.23 Preparation of single-stranded
M13 DNA from an infected culture of bacteria.
Gene Cloning and DNA Analysis by T.A. Brown. © 2006 T.A.
Brown.
Document Outline
- Figure 3.1 The basic steps in preparation of total cell DNA from a culture of bacteria.
- Figure 3.2 Estimation of bacterial cell number by measurement of optical density (OD). (a) A sample of the culture is placed in a glass cuvette and light with a wavelength of 600nm shone through. The amount of light that passes through the culture is measured and the OD (also called the absorbance) calculated as 1 OD unit = -log10 (intensity of transmitted light)/(intensity of incident light). The operation is performed with a spectrophotometer. (b) The cell number corresponding to the OD reading is calculated from a calibration curve. This curve is plotted from the OD values of a series of cultures of known cell density. For E. coli, 1 OD unit = 0.8 ´ 109 cells/ml.
- Figure 3.3 Harvesting bacteria by centrifugation.
- Figure 3.4 Preparation of a cell extract. (a) Cell lysis. (b) Centrifugation of the cell extract to remove insoluble debris.
- Figure 3.5 Two approaches to DNA purification. (a) Treating the mixture with reagents which degrade the contaminants, leaving a pure solution of DNA. (b) Separating the mixture into different fractions, one of which is pure DNA.
- Figure 3.6 Removal of protein contaminants by phenol extraction.
- Figure 3.7 DNA purification by ion-exchange chromatography. (a) Attachment of DNA to ion-exchange particles. (b) DNA is purified by column chromatography. The solutions passing through the column can be collected by gravity flow or by the spin column method, in which the column is placed in a low-speed centrifuge.
- Figure 3.8 Collecting DNA by ethanol precipitation. (a) Absolute ethanol is layered on top of a concentrated solution of DNA. Fibres of DNA can be withdrawn with a glass rod. (b) For less concentrated solutions ethanol is added (at a ratio of 2.5 volumes of absolute ethanol to 1 volume of DNA solution) and precipitated DNA collected by centrifugation.
- Figure 3.9 The CTAB method for purification of plant DNA.
- Figure 3.10 DNA purification by the guanidinium thiocyanate and silica method. (a) In the presence of guanidinium thiocyanate, DNA binds to silica particles. (b) DNA is purified by column chromatography.
- Figure 3.11 Preparation of a cleared lysate.
- Figure 3.12 Two conformations of circular double-stranded DNA: (a) supercoiled – both strands are intact; (b) open-circular – one or both strands are nicked.
- Figure 3.13 Plasmid purification by the alkaline denaturation method.
- Figure 3.14 Caesium chloride density gradient centrifugation. (a) A CsCl density gradient produced by high speed centrifugation. (b) Separation of protein, DNA and RNA in a density gradient.
- Figure 3.15 Partial unwinding of the DNA double helix by EtBr intercalation between adjacent base pairs. The normal DNA molecule shown on the left is partially unwound by taking up four EtBr molecules, resulting in the ‘stretched’ structure on the right.
- Figure 3.16 Purification of plasmid DNA by EtBr–CsCl density gradient centrifugation.
- Figure 3.17 Plasmid amplification.
- Figure 3.18 Preparation of a phage suspension from an infected culture of bacteria.
- Figure 3.19 Induction of a l cIts lysogen by transferring from 30°C to 42°C.
- Figure 3.20 Achieving the right balance between culture age and inoculum size when preparing a sample of a non-lysogenic phage.
- Figure 3.21 Collection of phage particles by polyethylene glycol (PEG) precipitation.
- Figure 3.22 Purification of l phage particles by CsCl density gradient centrifugation.
- Figure 3.23 Preparation of single-stranded M13 DNA from an infected culture of bacteria.
Wyszukiwarka
Podobne podstrony:
Figures for chapter 5
Figures for chapter 12
Figures for chapter 6
Figures for chapter 14
Figures for chapter 10
Figures for chapter 11
Figures for chapter 8
Figures for chapter 9
Figures for chapter 2
Figures for chapter 16
Figures for chapter 13
Figures for chapter 7
Figures for chapter 15
Figures for chapter 1
Figures for chapter 5
Figures for chapter 12
Figures for chapter 6
Figures for chapter 14
Figures for chapter 10
więcej podobnych podstron