
21
C H A P T E R
I
N T R O D U C T I O N T O
M
A C R O E C O N O M I C S
:
U
N E M P L O Y M E N T
, I
N F L A T I O N
,
A N D
E
C O N O M I C
F
L U C T U A T I O N S
I
N T R O D U C T I O N T O
M
A C R O E C O N O M I C S
:
U
N E M P L O Y M E N T
, I
N F L A T I O N
,
A N D
E
C O N O M I C
F
L U C T U A T I O N S
21.1
Macroeconomic Goals
21.2
Employment and Unemployment
21.3
Types of Unemployment
21.4
Reasons for Unemployment
21.5
Inflation
21.6
Economic Fluctuations
ow we focus our attention on macroeconom-
ics and, in particular, on two key concepts that
are at the heart of macroeconomics and
economic policymaking—unemployment and
inflation. To those who have just lost a job, unem-
ployment ranks high on the stress meter. To an
elderly person who is living on a fixed income,
inflation and the loss of purchasing power may be
just as threatening.
In this chapter, we see how economists define
unemployment and inflation and consider the prob-
lems associated with each. In the last section of the
chapter, we examine the short-run fluctuations in
the economy—the so-called business cycle.
■
N
95469_21_Ch21_p561-602.qxd 4/1/07 3:30 PM Page 563

564
M O D U L E 6
Macroeconomic Foundations
THREE MAJOR MACROECONOMIC GOALS
Recall from Chapter 1 that macroeconomics is the
study of the whole economy—the study of the
forest, not the trees. Nearly every society has been
interested in three major macroeconomic goals:
(1) maintaining employment of human resources at
relatively high levels, meaning that jobs are rela-
tively plentiful and financial suffering from lack of
work and income is relatively uncommon; (2) main-
taining prices at a relatively stable level so that con-
sumers and producers can make better decisions;
and (3) achieving a high rate of economic growth,
meaning a growth in output per person over time.
We use the term
real
gross domestic product
(RGDP)
to measure
output or production.
The term real is used
to indicate that the
output is adjusted for
the general increase in
prices over time.
Technically, gross domestic product (GDP) is
defined as the total value of all final goods and serv-
ices produced in a given period of time, such as a
year or a quarter.
WHAT OTHER GOALS ARE IMPORTANT?
In addition to these primary goals, most societies are
concerned, at various times, with other economic
issues, some of which are essentially microeconomic
in character. For example, “quality of life” issues have
prompted some societies to try to reduce “bads,” such
as pollution and crime, and increase goods and serv-
ices, such as education and health services. Another
goal has been “fairness” in the distribution of income
or wealth. Still another goal pursued in many nations
at one time or another has been self-sufficiency in the
production of certain goods and services. For exam-
ple, in the 1970s, the United States implemented
policies that reduced U.S. reliance on other nations
for supplies of oil, partly for reasons of national
security.
HOW DO VALUE JUDGMENTS AFFECT
ECONOMIC GOALS?
In stating that nations have economic goals, we must
acknowledge that nations are made up of individu-
als. Individuals within a society may differ consider-
ably in how they evaluate the relative importance of
certain issues, or even in whether they consider cer-
tain “problems” to really be problems after all. For
example, most people view economic growth posi-
tively, but others consider it less favorably. Some cit-
izens may think the income distribution is just about
right, but others may think it provides insufficient
incomes to the poorer members of society; still
others may think it involves taking too much income
from the relatively well-to-do, thereby reducing
incentives to carry out productive, income-producing
activities.
ACKNOWLEDGING OUR GOALS:
THE EMPLOYMENT ACT OF 1946
Many economic problems—particularly those
involving unemployment, price instability, and eco-
nomic stagnation—are pressing concerns for the
U.S. government. The
Employment Act of 1946
and
the Full Employment and Balanced Growth Act of
1978 (the Humphrey–Hawkins Act) commit the
U.S. government to pur-
suing unemployment
policies that are also
consistent with price
stability. This legisla-
tion was the first
formal acknowledg-
ment of these primary
macroeconomic goals.
S E C T I O N
21.1
M a c r o e c o n o m i c G o a l s
■
What are the most important macroeco-
nomic goals in the United States?
■
Are these goals universal?
■
How has the United States shown its
commitment to these goals?
real gross domestic
product (RGDP)
the total value of all final goods and
services produced in a given period,
such as a year or a quarter, adjusted
for inflation
Employment Act
of 1946
a commitment by the federal gov-
ernment to hold itself accountable
for short-run economic fluctuations
95469_21_Ch21_p561-602.qxd 4/1/07 3:30 PM Page 564

C H A P T E R 2 1
Introduction to Macroeconomics: Unemployment, Inflation, and Economic Fluctuations
565
THE CONSEQUENCES OF HIGH UNEMPLOYMENT
Unemployment figures are reported by the U.S.
Department of Labor on a monthly basis. The news of
lower unemployment usually sends stock prices higher;
and the news of higher unemployment usually sends
stock prices lower. Politicians are also concerned about
the unemployment figures because elections often hinge
precariously on whether unemployment has been rising
or falling.
Nearly everyone agrees that it is unfortunate when
a person who wants a job cannot find one. A loss of a
job can mean financial insecurity and a great deal of
anxiety. High rates of unemployment in a society can
increase tensions and despair. A family without income
from work undergoes great suffering; as a family’s sav-
ings fade, family members wonder where they are
going to obtain the means to survive. Society loses
some potential output of goods when some of its pro-
ductive resources—human or nonhuman—remain idle,
and potential consumption is reduced. Clearly, then, a
loss in efficiency occurs when people willing to work
and equipment able to produce remain idle. That is,
other things being equal, relatively high rates of unem-
ployment are viewed almost universally as undesirable.
WHAT IS THE UNEMPLOYMENT RATE?
When discussing unemployment, economists and politi-
cians refer to the
unemployment rate.
To calculate
the unemployment rate,
you must first under-
stand another impor-
tant concept—the
labor
force.
The labor force
is the number of people
over the age of 16 who
are available for employ-
ment, as shown in
Exhibit 1. The civilian
labor force figure
excludes people in the
armed services and those in prisons or mental hospi-
tals. Other people regarded as outside the labor force
include homemakers, retirees, and full-time students.
These groups are excluded from the labor force
because they are not considered currently available
for employment.
When we say that the unemployment rate is
5 percent, we mean that 5 percent of the population
over the age of 16 who are willing and able to work
are unable to get jobs. This 5 percent means that 5 out
of 100 people in the total labor force are unemployed.
To calculate the unemployment rate, we simply divide
the number of unemployed by the number in the civil-
ian labor force:
Unemployment rate
=
Number of unemployed
Civilian labor force
S E C T I O N
*
C H E C K
1.
The most important U.S. macroeconomic goals are full employment, price stability, and economic growth.
2.
Individuals all have their own reasons for valuing certain goals more than others.
3.
The United States showed its commitment to the major macroeconomic goals with the Employment Act of 1946
and the Full Employment and Balanced Growth Act of 1978 (the Humphrey–Hawkins Act).
1.
What are the three major economic goals of most societies?
2.
What is the Employment Act of 1946? Why was it significant?
S E C T I O N
21.2
E m p l o y m e n t a n d U n e m p l o y m e n t
■
What are the consequences of
unemployment?
■
What is the unemployment rate?
■
Does unemployment affect everyone equally?
■
What causes unemployment?
■
How long are people typically
unemployed?
unemployment rate
the percentage of the population
aged 16 and older who are willing
and able to work but are unable to
obtain a job
labor force
the number of people aged 16 and
over who are available for
employment
95469_21_Ch21_p561-602.qxd 4/1/07 3:30 PM Page 565

566
M O D U L E 6
Macroeconomic Foundations
In August 2006, the number of civilians unemployed
in the United States was 7.12 million, and the civilian
labor force totaled 151.7 million. Using these data,
we can calculate that the unemployment rate in
August 2006 was 4.7 percent:
Unemployment rate
= 7.12 million/151.7 million
= .047 × 100 = 4.7 percent
THE WORST CASE OF U.S. UNEMPLOYMENT
By far, the worst employment downturn in U.S. his-
tory occurred during the Great Depression, which
began in late 1929 and continued until 1941.
Unemployment rose from only 3.2 percent of the
labor force in 1929 to more than 20 percent in the
early 1930s, and double-digit unemployment per-
sisted through 1941. The debilitating impact of
having millions of productive people out of work led
Americans (and people in other countries as well) to
say, “Never again.” Some economists would argue
that modern macroeconomics, with its emphasis on
the determinants of unemployment and its elimina-
tion, truly began in the 1930s.
VARIATIONS IN THE UNEMPLOYMENT RATE
Exhibit 2 shows U.S. unemployment rates over the
last 46 years. Unemployment since 1960 ranged from
a low of 3.5 percent in 1969 to a high of 9.7 percent
in 1982. Unemployment in the worst years is two or
more times what it is in good years. Before 1960,
variations in unemployment were more pronounced.
ARE UNEMPLOYMENT STATISTICS ACCURATE
REFLECTIONS OF THE LABOR MARKET?
In periods of prolonged recession, some individuals
think that the chances of landing a job are so bleak
that they quit looking. These people are called
dis-
couraged workers.
Individuals who have not
actively sought work
for four weeks are not
counted as unemployed;
instead, they fall out
of the labor force. Also,
people looking for full-
time work who grudg-
ingly settle for part-time
jobs are counted as “fully” employed, even though
they are only “partly” employed. At least partially
balancing these two biases in government employ-
ment statistics, however, is the number of people who
are overemployed—that is, working overtime or at
more than one job. Also, a number of jobs in the
underground economy (e.g., drug dealing, prostitu-
tion, gambling, and so on) are not reported. In addi-
tion, many people may claim they are seeking work
when, in fact, they may just be going through the
motions so they can continue to collect unemploy-
ment compensation or receive other government
benefits.
WHO ARE THE UNEMPLOYED?
Unemployment usually varies greatly across different
segments of the population and over time.
SOURCE: Bureau of Labor Statistics, August 2006.
Civilians
Employed
(144.58 million)
Unemployed
(7.12 million)
Out of
Labor Force
(77.47 million)
(229.2 million)
Total Adult Population
(151.7 million)
Labor Force (Employed + Unemployed)
The U.S. Labor Force, 2006
S E C T I O N
2 1 . 2
E
X H I B I T
1
discouraged worker
an individual who has left the labor
force because he or she could not
find a job
95469_21_Ch21_p561-602.qxd 4/1/07 3:30 PM Page 566

C H A P T E R 2 1
Introduction to Macroeconomics: Unemployment, Inflation, and Economic Fluctuations
567
Education as a Factor in Unemployment
According to the Bureau of Labor Statistics, the
unemployment rate across the sexes and races
among college graduates is significantly lower than
for those who do not complete high school. In June
2006, the unemployment rate for individuals with-
out high school diplomas was 6.5 percent, compared
with 2.1 percent for those with bachelor degrees and
higher. Further, college graduates have lower unem-
ployment rates than people who have some college
education but did not complete their bachelor’s
degrees (3.6 percent).
Age, Sex, and Race as Factors in Unemployment
The incidence of unemployment varies widely among
the population. Unemployment tends to be greater
among the very young, among blacks and other
minorities, and among workers with few skills. The
unemployment rate for adult females tends to be
higher than that for adult males.
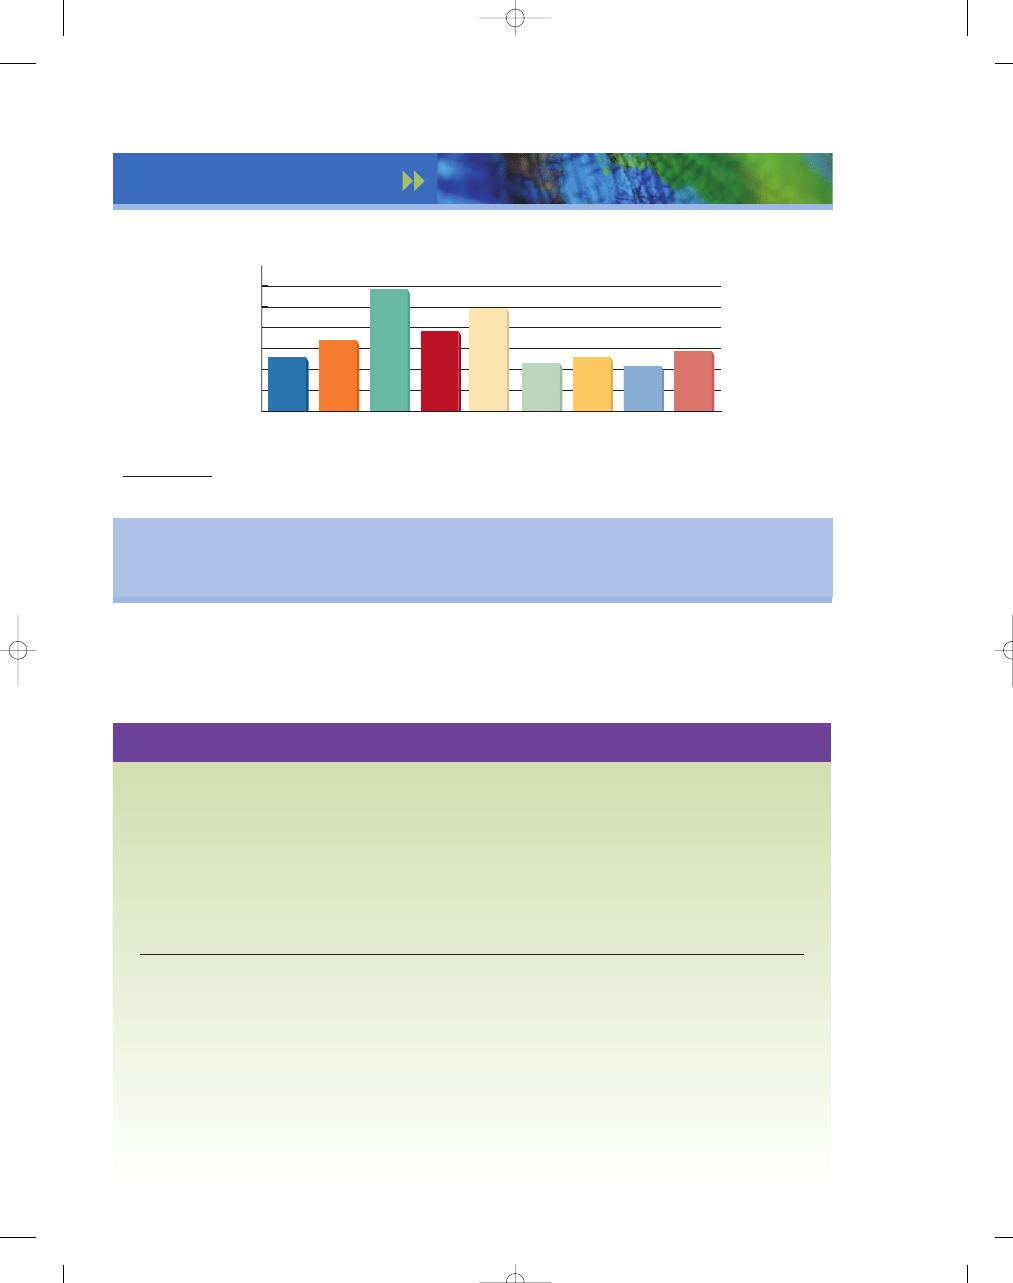
Considering the great variations in unemploy-
ment for different groups in the population, we cal-
culate separate unemployment rates for groups
classified by sex, age, race, family status, and type of
occupation. Exhibit 3 shows unemployment rates for
various groups. Note that the variation around the
average unemployment rate for the total population
of 4.7 percent was considerable. The unemployment
rate for blacks was much higher than the rate for
whites, a phenomenon that has persisted throughout
the post–World War II period. Unemployment among
teenagers was much higher than adult unemployment,
at 16.2 percent. Some would regard teenage unem-
ployment a lesser evil than unemployment among
adults, because most teenagers have parents or
guardians on whom they can rely for subsistence.
CATEGORIES OF UNEMPLOYED WORKERS
According to the Bureau
of Labor Statistics, the
four main categories of
unemployed workers
are
job losers
(those who
have been temporarily
SOURCE: Bureau of Labor Statistics, August 2006.
10%
9
8
7
6
5
4
3
2
1
0
1960
1965
1970
1975
1980
Year
1990
1985
1995
2000
2005
U.S. Unemployment Rate
P
er
cent
Unemployment Rates, 1960–2006
S E C T I O N
2 1 . 2
E
X H I B I T
2
Teenagers have the highest rates of unemployment. Do you
think it would be easier for them to find jobs if they had more
experience and higher skill levels?
©
Photodisc Green/Getty Images
job loser
an individual who has been tem-
porarily laid off or fired
95469_21_Ch21_p561-602.qxd 4/1/07 3:30 PM Page 567

568
M O D U L E 6
Macroeconomic Foundations
laid off or fired),
job
leavers
(those who
have quit their jobs),
reentrants
(those who
worked before and are
reentering the labor
force), and
new entrants
(those entering the labor
force for the first time—
primarily teenagers). It
is a common misconcep-
tion that most workers
are unemployed because
they have lost their jobs. Although job losers may typi-
cally account for 50 to 60 percent of the unemployed, a
sizable fraction is due to job leavers, new entrants, and
reentrants, as seen in Exhibit 4.
HOW MUCH UNEMPLOYMENT?
Even though unemployment is painful to those who
have no source of income, reducing unemployment is
not costless. In the short run, a reduction in unemploy-
ment may come at the expense of a higher rate of
inflation, especially if the economy is close to full
capacity, where resources are almost fully employed.
Moreover, trying to match employees with jobs can
quickly lead to significant inefficiencies, because of mis-
matches between a worker’s skill level and the level of
skill required for a job. For example, the economy would
be wasting resources subsidizing education if people
with Ph.D.s in biochemistry were driving taxis or tend-
ing bar. That is, the skills of the employee may be
higher than those neces-
sary for the job, result-
ing in what economists
call
underemploy-
ment.
Another source
of inefficiencies is plac-
ing employees in jobs
beyond their abilities.
job leaver
a person who quits his or her job
reentrant
an individual who worked before and
is now reentering the labor force
new entrant
an individual who has not held a
job before but is now seeking
employment
SOURCE: Bureau of Labor Statistics, August 2006.
20%
18%
16%
14%
12%
10%
8%
6%
4%
2%
0%
20%
18%
16%
14%
12%
10%
8%
6%
4%
2%
0%
Total Population
Men
Women
Teenagers
(16–19 years)
Total Population
White
Black
Hispanic
Unemplo
yment Rate
Unemplo
yment Rate
4.7%
4.7%
4.7%
16.2%
4.6%
4.1%
8.8%
5.3%
Unemployment in the United States by Age, Sex, and Race
S E C T I O N
2 1 . 2
E
X H I B I T
3
a. U.S. Unemployment, by Sex and Age
b. U.S. Unemployment, by Race or Ethnic Group
Reasons for
Unemployment
S E C T I O N
2 1 . 2
E
X H I B I T
4
Job losers
49%
Reentrants
30%
Job leavers
12%
New entrants
9%
SOURCE: Bureau of Labor Statistics, August 2006.
underemployment
a situation in which a worker’s
skill level is higher than necessary
for a job
95469_21_Ch21_p561-602.qxd 16/1/07 3:17 PM Page 568

C H A P T E R 2 1
Introduction to Macroeconomics: Unemployment, Inflation, and Economic Fluctuations
569
HOW LONG ARE PEOPLE USUALLY UNEMPLOYED?
The duration of unemployment is equally as impor-
tant as the amount of unemployment. The financial
consequences of a head of household’s being unem-
ployed for four or five weeks are usually not extremely
serious, particularly if the individual is covered by an
unemployment compensation system. The impact
becomes much more serious if that person is unemployed
for several months. Therefore, it is useful to look at
the average duration of unemployment to discover
what percentage of the labor force is unemployed
longer than a certain period, say 15 weeks. Exhibit 5
presents data on the duration of unemployment. As
you can see in this table, roughly 39 percent of the
unemployed were out of work less than five weeks,
and 16 percent of the total unemployed were out of
work for more than six months. The duration of
unemployment tends to be greater when the amount
of unemployment is high and smaller when the
amount of unemployment is low. Unemployment of
any duration, of course, means a potential loss of
output. This loss of current output is permanent; it is
not made up when unemployment starts falling again.
LABOR FORCE PARTICIPATION RATE
The percentage of the population that is in the labor
force is what economists call the
labor force partici-
pation rate.
Since 1950, the labor force participation
rate increased from 59.2
percent to 67.1 percent.
Most of that change
occurred between 1970
and 1990. The increase
in the labor force partic-
ipation rate can be
attributed in large part
to the entry of the baby
boomers into the labor force together with a 14.2 per-
centage point increase in the women’s labor force partic-
ipation rate.
Over the last several decades, the number of
women working shifted dramatically, reflecting the
changing role of women in the workforce. In Exhibit 6,
we see that in 1950, less than 34 percent of women
were working or looking for work. Today that figure
is roughly 60 percent. In 1950, more than 85 percent
of men were working or looking for work. Today the
labor force participation rate for men has fallen to
roughly 73 percent, as many men stay in school
longer and opt to retire earlier.
Duration of
Unemployment
S E C T I O N
2 1 . 2
E
X H I B I T
5
SOURCE: Bureau of Labor Statistics, August 2006.
Duration
Percent Unemployed
Less than 5 weeks
39%
5 to 14 weeks
30
15 to 26 weeks
15
27 weeks and over
16
i n t h e n e w s
A Growing Number of Men Are Not Working,
So What Are They Doing?
B Y A L A N B . K R U E G E R
A growing number of men in their prime working years are pursuing what
might be called the Kramer lifestyle, after the enigmatic “Seinfeld” character:
neither working nor attending school. In 1967, 2.2 percent of noninstitutional-
ized men age 25 to 54 spent the entire year without working for pay or attend-
ing school. That figure climbed to 8 percent in 2002, the latest year available
from the Bureau of Labor Statistics. . . .
(continued)
labor force
participation rate
the percentage of the population in
the labor force
SOURCE: Bureau of Labor Statistics, September 2006.
Labor Force Participation Rates for Men and Women
S E C T I O N
2 1 . 2
E
X H I B I T
6
1950
1960
1970
1980
1990
2000
2006
Total
59.2%
59.4%
60.4%
63.8%
66.5%
67.1%
66.0%
Men
86.4
83.3
79.7
77.4
76.4
64.8
73.4
Women
33.9
37.7
43.3
51.5
57.5
59.9
59.3
95469_21_Ch21_p561-602.qxd 4/1/07 3:31 PM Page 569

570
M O D U L E 6
Macroeconomic Foundations
S E C T I O N
*
C H E C K
1.
The consequences of unemployment for society include a reduction in potential output and consumption—a
decrease in efficiency.
2.
The unemployment rate is found by taking the number of people officially unemployed and dividing by the
number in the civilian labor force.
3.
Unemployment rates are highest for minorities, the young, and less-skilled workers.
4.
The four main categories of unemployed workers are job losers, job leavers, reentrants, and new entrants.
5.
The duration of unemployment tends to be greater (smaller) when the amount of unemployment is high (low).
1.
What happens to the unemployment rate when the number of unemployed people increases, ceteris paribus?
When the labor force grows, ceteris paribus?
2.
How might the official unemployment rate understate the “true” degree of unemployment? How might it
overstate it?
3.
Why might the fraction of the unemployed who are job leavers be higher in a period of strong labor demand?
4.
Suppose you live in a community of 100 people. If 80 people are over 16 years old and 72 people are willing and
able to work, what is the unemployment rate in this community?
5.
What would happen to the unemployment rate if a substantial group of unemployed people started going to
school full time? What would happen to the size of the labor force?
6.
What happens to the unemployment rate when officially unemployed people become discouraged workers? Does
anything happen to employment in this case?
i n t h e n e w s ( c o n t . )
The problem is much more severe for some groups than others. Nearly
one in five men age 25 to 54 with less than a high school degree did not work
even one week in 2002. The nonworking rate for college graduates was only
3.3 percent. In central cities, 10.8 percent of men spent the year without work,
compared with 7.1 percent elsewhere. . . .
Long-term joblessness among mature men has become a much more
important phenomenon than unemployment. Many jobless men do not
actively search for work, so they are not counted as unemployed. Yet they still
represent a significant loss of productive human resources for the economy.
The conventional wisdom is that joblessness has grown since the early
1980s because the demand for less-skilled workers has dropped, causing their
pay to fall. The decline in unions and erosion of the real value of the minimum
wage have also caused their pay to fall. Rather than toil at low pay, more and
more men have withdrawn from the job market. . . .
Comparing workers and nonworkers over a full week, nonworkers spent
about a quarter of their extra time in “home production,” which includes
household chores, cleaning, and repairs. The bulk of their extra time went into
leisure and recreation, particularly watching television, socializing, and play-
ing sports and games. Nonworkers also slept 10 percent more (44 minutes)
a night than workers. Both groups devoted relatively little time to child care,
at least as a primary activity.
By contrast, nonworking women spend half their extra time engaged in
household work and child care.
Supporting a Kramer lifestyle is not easy, especially if your neighbors are
less magnanimous than Jerry Seinfeld. Nearly two-thirds of nonworking men
age 25 to 24 received income from some source in 2002. Among those with
unearned income, the average amount was $11,551, with the largest sums
coming from Social Security and disability payments. . . .
Not surprisingly, wives are also an important source of financial support
for nonworking men, but only 42 percent of male nonworkers between age 25
and 54 are married, compared with 68 percent of their employed counterparts.
Twenty-nine percent of nonworkers live with their parents or other relatives,
substantially higher than the 9 percent of workers in such a living arrangement.
More than 40 percent of nonworkers who live with their spouse or parents also
have other relatives present who contribute income to their household. Thus,
financial support for nonworkers seems to be a family affair.
The experiences of nonworking adult men are quite varied, and many
have severe disabilities. Although these statistics paint a picture of nonwork-
ing men struggling to get by financially, many manage to live as if every day
were Sunday. As one man from Brooklyn who has not worked since 1998 told
me this week, he thinks of the Off-Track Betting parlor in Midtown Manhattan
as his “club,” and he sees many of the same men there day after day.
SOURCE: Alan B. Krueger, “A Growing Number of Men Are Not Working, So What
Are They Doing?” New York Times, 29 April 2004. Copyright © 2004 by the New
York Times Co. Reprinted with permission.
95469_21_Ch21_p561-602.qxd 4/1/07 3:31 PM Page 570

C H A P T E R 2 1
Introduction to Macroeconomics: Unemployment, Inflation, and Economic Fluctuations
571
In examining the status of and changes in the unem-
ployment rate, it is important to recognize that unem-
ployment can take several forms. In this section, we will
examine the three types of unemployment—frictional,
structural, and cyclical—and evaluate the relative effects
of each on the overall unemployment rate.
FRICTIONAL UNEMPLOYMENT
In a dynamic economy where people are constantly
losing or leaving their jobs, some frictional unemploy-
ment is always present.
Frictional unemployment
is
the temporary unemployment that results from the
search time that occurs
when people are search-
ing for suitable jobs and
firms are looking for
suitable workers. People
seeking work do not
usually take the first job
offered to them. Like-
wise, firms do not usu-
ally take the first person
they interview. People and firms engage in a search to
match up skills and interests. While the unemployed
are looking, they are frictionally unemployed.
For example, consider an advertising executive
who was fired in Chicago on March 1 and is now
actively looking for similar work in San Francisco. Of
course, not all unemployed workers were fired; some
may have voluntarily quit their jobs. In either case,
frictional unemployment is short term and results
from normal turnover in the labor market, as when
people change from one job to another.
Some unemployment occurs because certain types
of jobs are seasonal in nature. This type of unemploy-
ment is called seasonal unemployment. For example, a
ski instructor in Aspen might become seasonally
unemployed at the end of April when ski season is
over. Or a roofer in Minnesota may become seasonally
unemployed during the harsh winter months. In agri-
cultural areas, employment increases during harvest
season and falls after the season is over. Even a forest
firefighter in a national park might only be employed
during the summer and fall, when forest fires peak.
Occupations that experience either sharp seasonal
shifts in demand or are subject to changing weather
conditions may lead to seasonal unemployment—like
in agriculture where employment increases during har-
vest season. Because this type of unemployment can
make the unemployment rate higher in the off-season
and lower during the in-season, the Bureau of Labor
Statistics (BLS) publishes a seasonally adjusted unem-
ployment rate as well. These figures are more accurate
because they take into account the effects of seasonal
unemployment.
S E C T I O N
21.3
Ty p e s o f U n e m p l o y m e n t
■
What are the three types of unemployment?
■
What is frictional unemployment?
■
What is structural unemployment?
■
What is cyclical unemployment?
■
What is the natural rate of
unemployment?
frictional
unemployment
the unemployment that results from
workers searching for suitable jobs
and firms looking for suitable workers
What will this ski instructor do this summer? What will the lifeguard do this winter? Will they find other jobs? Or will they be seasonally
unemployed?
©
Rob Gage/T
axi/Getty Images
©
Br
and X Pictures/J
upiter Images
95469_21_Ch21_p561-602.qxd 4/1/07 3:31 PM Page 571

572
M O D U L E 6
Macroeconomic Foundations
SHOULD WE WORRY ABOUT FRICTIONAL
UNEMPLOYMENT?
Geographic and occupational mobility are considered
good for the economy because they generally lead
human resources to go from activities of relatively low
productivity or value to areas of higher productivity,
increasing output in society as well as the wage income
of the mover. Indeed, some of this frictional unem-
ployment involving searches by firms and workers to
find more suitable matchups, is obviously beneficial to
the economy. Even though the amount of frictional
unemployment varies somewhat over time, it is unusual
for it to be much less than 2 percent of the labor force.
Actually, frictional unemployment tends to be some-
what greater in periods of low unemployment, when
job opportunities are plentiful. This high level of job
opportunity stimulates mobility, which, in turn, creates
some frictional unemployment.
STRUCTURAL UNEMPLOYMENT
A second type of unemployment is structural unem-
ployment. Like frictional unemployment, structural
unemployment is related to occupational movement or
mobility—in this case, to a lack of mobility. Structural
unemployment occurs
when workers lack the
necessary skills for jobs
that are available or
have particular skills
that are no longer in
demand. For example,
if a machine operator in
a manufacturing plant loses his job, he could still
remain unemployed despite the openings for computer
programmers in his community. The quantity of unem-
ployed workers conceivably could equal the number of
job vacancies, with the unemployment persisting
because the unemployed lack the appropriate skills.
Given the existence of structural unemployment, it is
wise to look at both unemployment and job vacancy
statistics in assessing labor market conditions.
Structural unemployment, like frictional unemploy-
ment, reflects the dynamic dimension of a changing
economy. Over time, new jobs open up that require new
skills, while old jobs that required different skills disap-
pear. It is not surprising, then, that many people advo-
cate government-subsidized retraining programs as a
means of reducing structural unemployment.
Another reason for structural unemployment is
that low-skilled workers are frequently unable to find
desirable long-term employment. Some of these low-
skilled jobs do not last long and involve little job train-
ing, so a worker may soon be looking for a new job.
Because they acquired no new skill from the old job,
they may be stuck without long-term secure work.
That is, structural workers cannot be said to be “in-
between jobs” like those who are frictionally unem-
ployed. Structural unemployment is more long term
and serious than frictional unemployment because
these workers do not have marketable skills.
The dimensions of structural unemployment are
debatable, in part because of the difficulty in precisely
defining the term in an operational sense. Structural
unemployment varies considerably—sometimes it is
low and at other times, as in the 1970s and early
1980s, it is high. To some extent, in the latter period,
jobs in the traditional sectors such as automobile
manufacturing and oil production were giving way to
jobs in the computer and biotechnology sectors.
Consequently, structural unemployment was higher.
SOME UNEMPLOYMENT IS UNAVOIDABLE
Some unemployment is actually normal and important
to the economy. Frictional and structural unemploy-
ment are simply unavoidable in a vibrant economy. To
a considerable extent, we can view both frictional and
structural unemployment as phenomena resulting
from imperfections in the labor market. For example,
if individuals seeking jobs and employers seeking
workers had better information about each other, the
amount of frictional unemployment would be consid-
erably lower. It takes time for suppliers of labor to find
the demanders of labor services, and it takes time and
money for labor resources to acquire the necessary
skills. But because information and job search are
costly, bringing together demanders and suppliers of
labor services does not occur instantaneously.
What type of unemployment would occur if these coal miners
lost their jobs as a result of a permanent reduction in demand for
coal and needed retraining to find other employment? Usually,
structural unemployment occurs because of workers’ lack of
skills or long-term changes in demand. Consequently, it generally
lasts for a longer period than does frictional unemployment.
©
Barr
y Le
wis/CORBIS
structural
unemployment
the unemployment that results from
workers not having the skills to obtain
long-term employment
95469_21_Ch21_p561-602.qxd 4/1/07 3:31 PM Page 572

C H A P T E R 2 1
Introduction to Macroeconomics: Unemployment, Inflation, and Economic Fluctuations
573
CYCLICAL UNEMPLOYMENT
Often, unemployment is composed of more than just
frictional and structural unemployment. In years of rel-
atively high unemployment, some joblessness may result
from short-term cyclical fluctuations in the economy.
We call this type
cyclical unemployment.
Whenever
the unemployment rate is greater than normal, such as
during a recession, it is
due to cyclical unem-
ployment. Most attempts
to solve the cyclical
unemployment problem
emphasized increasing
aggregate demand to
counter recession.
The Cost of Cyclical Unemployment
When the unemployment rate is high, numerous eco-
nomic and social hardships result. The economic costs
are the forgone output when the economy is not pro-
ducing at its potential level. According to Okun’s Law
(really, a rule of thumb), a 1 percent increase in cycli-
cal unemployment reduces output by 2 percentage
points. Thus, we can actually estimate the economic
costs of not producing at our potential output. The
costs are particularly high for those groups with the
least skills—the poorly educated and teenagers with
little work experience.
THE NATURAL RATE OF UNEMPLOYMENT
It is interesting to observe that over the period in which
annual unemployment data are available, the median,
or “typical,” annual unemployment rate has been at or
slightly above 5 percent.
Some economists call
this typical unemploy-
ment rate the
natural
rate of unemploy-
ment.
When unem-
ployment rises well
above 5 percent, we
have abnormally high
unemployment; when it
falls well below 5 percent, we have abnormally low
unemployment. The natural rate of unemployment of
approximately 5 percent roughly equals the sum of
frictional and structural unemployment when they are
at their maximums. Thus, we can view unemploy-
ment rates below the natural rate as reflecting the
existence of below-average levels of frictional and
structural unemployment. When unemployment rises
above the natural rate, however, it reflects the exis-
tence of cyclical unemployment. In short, the natural
rate of unemployment is the unemployment rate when
the economy is experiencing neither a recession nor a
boom. The natural rate of unemployment is also
called the full employment rate of unemployment.
The natural rate of unemployment can change over
time as technological, demographic, institutional, and
other conditions vary. For example, as baby boomers
age, the natural rate falls because middle-aged workers
generally experience lower unemployment rates than
do younger workers. In addition, the Internet and job
placement agencies have improved access to employ-
ment information and allowed workers to find jobs
more quickly. Also, the new work requirements of the
welfare laws increased the number of people with jobs.
Thus, the natural rate is not fixed, because it can
change with demographic changes over time.
Full Employment and Potential Output
When all the resources of an economy—labor, land,
and capital—are fully employed, the economy is said to
be producing its
poten-
tial output.
Literally,
full employment of
labor means that the
economy is providing
employment for all who
are willing and able to
work with no cyclical
unemployment. It also
means that capital and land are fully employed. That is,
at the natural rate of unemployment, all resources are
fully employed, the economy is producing its potential
output, and no cyclical unemployment is present. It
does not mean the economy will always be producing
cyclical
unemployment
unemployment due to short-term
cyclical fluctuations in the economy
potential output
the amount of real output the economy
would produce if its labor and other
resources were fully employed, that is,
at the natural rate of unemployment
using what you’ve learned
Cyclical Unemployment
Are layoffs more prevalent during a recession than a recovery?
Do most resignations occur during a recovery?
Layoffs are more likely to occur during a recession. When times are
bad, employers are often forced to let workers go. Resignations are
relatively more prevalent during good economic times because more job
opportunities are available to those seeking new jobs.
Q
A
natural rate of
unemployment
the median, or “typical,” unemploy-
ment rate, equal to the sum of fric-
tional and structural unemployment
when they are at a maximum
95469_21_Ch21_p561-602.qxd 4/1/07 3:31 PM Page 573
574
M O D U L E 6
Macroeconomic Foundations
SOURCE: The World Factbook, 2006; http://www.cia.gov.
CONSIDER THIS:
Many developed countries had higher unemployment rates than the United States did in 2005. Generous unemployment benefits (particularly in France and
Germany) and sluggish economic growth in European countries helped cause the higher unemployment rates.
g l o b a l w a t c h
14%
12
10
8
6
4
2
0
Australia
5.1%
Canada
6.8%
Germany
11.7%
Italy
7.7%
France
9.9%
United
Kingdom
4.7%
U.S.
5.1%
Japan
4.4%
Sweden
5.8%
Unemployment Around the Globe, 2005
S E C T I O N
*
C H E C K
1.
The three types of unemployment are frictional unemployment, structural unemployment, and cyclical unemployment.
2.
Frictional unemployment results when a person moves from one job to another as workers search for suitable jobs
and firms look for suitable workers.
3.
Structural unemployment results when people who are looking for jobs lack the required skills for the jobs that are
available or a long-term change in demand occurs.
4.
Cyclical unemployment is caused by a recession.
5.
Imperfections in the labor market and institutional factors result in higher rates of unemployment.
6.
When cyclical unemployment is almost completely eliminated, our economy is said to be operating at full employ-
ment, or at a natural rate of unemployment.
1.
Why do we want some frictional unemployment?
2.
Why might a job retraining program be a more useful policy to address structural unemployment than to address
frictional unemployment?
3.
What is the traditional government policy “cure” for cyclical unemployment?
4.
What types of unemployment are present at full employment (at the natural rate of unemployment)?
5.
Why might frictional unemployment be higher in a period of plentiful jobs (low unemployment)?
6.
If the widespread introduction of the automobile caused a productive buggy whip maker to lose his job, would he
be structurally unemployed?
7.
If a fall in demand for domestic cars causes auto workers to lose their jobs in Michigan, while plenty of jobs are
available for lumberjacks in Montana, what kind of unemployment results?
at its potential output of resources. For example, when
the economy is experiencing cyclical unemployment,
the unemployment rate is greater than the natural rate.
It is also possible for the economy to temporarily
exceed the natural rate, as workers put in overtime or
moonlight by taking on extra employment.
95469_21_Ch21_p561-602.qxd 4/1/07 3:31 PM Page 574

C H A P T E R 2 1
Introduction to Macroeconomics: Unemployment, Inflation, and Economic Fluctuations
575
In this section, we look at the causes of frictional and
structural unemployment. In later chapters, we dis-
cuss the causes of cyclical unemployment.
WHY DOES UNEMPLOYMENT EXIST?
In many markets, prices adjust to the market equi-
librium price and quantity, and no prolonged peri-
ods of shortage or surplus occur. However, in labor
markets, obstacles prevent wages from adjusting
and balancing the quantity of labor supplied and
the quantity of labor demanded. In Exhibit 1, we see
that W
1
is higher than the market equilibrium wage
that equates the quantity demanded of labor with
the quantity supplied of labor. At W
1
, the quantity
of labor supplied is greater than quantity of labor
demanded, resulting in an excess quantity supplied
of labor—unemployment. That is, more people want
to work at the going (nonequilibrium) wage than
employers want to hire, and those who are not able
to find work are “unemployed.” Why? Economists
cite three reasons for the failure of wages to balance
the labor demand and labor supply equilibrium—
minimum wages, unions, and the efficiency wage
theory.
MINIMUM WAGES AND UNEMPLOYMENT
Many different types of labor markets exist for differ-
ent types of workers. The labor market for workers
with little experience
and job skills is called
the unskilled labor
market. Suppose the
government decided to
establish a
minimum
wage rate
(an hourly
wage floor) for unskilled
workers above the equilibrium wage, W
E
. At the
minimum wage, the quantity of labor supplied grows
because more people are willing to work at a higher
wage. However, the quantity of labor demanded falls
because some employers would find it unprofitable
to hire low-skilled workers at the higher wage. At
W
1
, a gap exists between the quantity of labor
demanded and the quantity supplied, representing a
surplus of unskilled workers—unemployment, as seen
in Exhibit 1.
Because minimum wage earners, a majority of
whom are 25 years or younger, are a small portion of the
labor force, most economists believe the effect of min-
imum wage on unemployment is small.
S E C T I O N
21.4
R e a s o n s f o r U n e m p l o y m e n t
■
How does a higher minimum wage lead to
greater unemployment among the young
and unskilled?
■
Can unions cause higher rates of
unemployment?
■
How does an efficiency wage cause a
higher rate of unemployment?
■
How do changes in job search costs affect
the unemployment rate?
■
Does unemployment insurance increase the
unemployment rate?
Wages Above Equilibrium
Lead to Greater
Unemployment
S E C T I O N
2 1 . 4
E
X H I B I T
1
0
W
1
W
E
Q
E
Q
D
Q
S
Labor Supply
Surplus of Labor
(Unemployment)
Labor Demand
Quantity of Labor
Real W
a
g
e
The labor market is in equilibrium where the quantity
demanded of labor is equal to the quantity supplied
of labor, at W
E
and Q
E
. If the wage persists above the
equilibrium wage, a surplus of labor or unemploy-
ment of Q
S
× Q
D
exists. That is, at W
1
, the quantity of
labor supplied is greater than the quantity of labor
demanded; we can think of this surplus of labor as
unemployment.
minimum wage rate
an hourly wage floor set above the
equilibrium wage
95469_21_Ch21_p561-602.qxd 4/1/07 3:31 PM Page 575

576
M O D U L E 6
Macroeconomic Foundations
THE IMPACT OF UNIONS ON THE
UNEMPLOYMENT RATE
Unions negotiate their wages and benefits collectively
through their union officials, a process called collec-
tive bargaining. If, through this process of collective
bargaining, union officials are able to increase wages,
then unemployment will rise in the union sector. If the
bargaining raises the union wage above the equilib-
rium level, the quantity of union labor demanded will
decrease, and the quantity of union labor supplied
will increase—that is, union workers will be unem-
ployed. The union workers who still have their jobs will
be better off, but some who are equally skilled will be
unemployed and will either seek nonunion work or
wait to be recalled in the union sector. Many econo-
mists believe that is why wages are approximately
15 percent higher in union jobs, even when nonunion
workers have comparable skills. On the other hand,
even though wages in the union sector are typically
higher than the market wage, the presence of unions
does not necessarily lead to greater unemployment
because workers can find jobs in the nonunion
sector. Less than 10 percent of private sector jobs are
unionized.
EFFICIENCY WAGE
In economics, it is generally assumed that as produc-
tivity rises, wages rise, and workers can raise their
productivity through investments in human capital
like education and on-the-job training. However,
some economists follow
the
efficiency wage
model,
which is based
on the belief that higher
wages lead to greater
productivity.
In the efficiency
wage model, employers
pay their employees
more than the equilibrium wage to be more efficient.
Proponents of this theory suggest that it may lead to
attracting the most productive workers, fewer job
turnovers, and higher morale, which in turn can lead
to lower hiring and training costs. Because the effi-
ciency wage rate is greater than the equilibrium wage
rate, the quantity of labor supplied is greater than the
quantity of labor demanded, resulting in greater
amounts of unemployment.
In 1914, Henry Ford increased his workers’ wages
from $3 to $5 per day—roughly twice the going wage
rate for unskilled workers. This wage rate led to long
lines of workers seeking jobs at the Ford plant—that is,
quantity supplied greatly exceeded quantity demanded
at the efficiency wage rate. Ford knew that assembly
line work was boring, and to overcome the problem he
was having with morale and absenteeism, he decided to
increase daily wages to $5 a day. At the time, many
business leaders were skeptical because this put Ford’s
labor costs at nearly twice that of his rivals. However,
Ford profits continued to mount. Historical records
suggest that the efficiency wage led to lower turnovers,
less absenteeism, better hires, and less shirking—in
short, greater worker productivity. Even though the
higher wages led to higher labor costs, overall produc-
tion costs fell with the gains in labor productivity.
Some scholars have argued that the positive
effects of the efficiency wage are unique to assembly
line production and its high degree of worker interde-
pendence. However, it is costly for firms to pay an
efficiency wage. Consequently, firms must monitor
their workers’ efforts. If enough firms resort to paying
the efficiency wage rate, then the average real wage
rate will be greater than the equilibrium wage. This
equilibrium will lead to unemployment.
JOB SEARCH
Another reason for unemployment has to do with the
nature of labor markets. Because of frictional unem-
ployment, some unemployment would exist even if
labor supply and labor demand were balanced.
Different firms offer different compensation packages
(salary, fringe benefits, working conditions), and
workers are sometimes unaware of these packages
when they seek the “best” job available. It takes time
and money to locate the best available opportunities.
Also, not all job seekers are the same: They have dif-
ferent tastes and preferences about types of jobs and
job locations. Sometimes it is difficult to get the infor-
mation about particular jobs to the right job candi-
date. These search activities prolong the duration of
unemployment. However, the search goes on because
the job seeker hopes to find a better offer.
The labor demand and supply curves are con-
stantly shifting. That is, labor markets are constantly
in flux—people losing jobs, leaving jobs, reentering
jobs. In a growing and dynamic economy, jobs are
constantly being destroyed and created, leading to
temporary unemployment as workers search for the
best jobs for their skills.
UNEMPLOYMENT INSURANCE
Losing a job can lead to considerable hardships, and
unemployment insurance is designed to partially offset
the severity of the unemployment problem. The pro-
gram does not cover those who were fired or quit their
jobs. To qualify, recipients must have worked a certain
efficiency wage
model
theory stating that higher wages
lead to greater productivity
95469_21_Ch21_p561-602.qxd 4/1/07 3:31 PM Page 576
C H A P T E R 2 1
Introduction to Macroeconomics: Unemployment, Inflation, and Economic Fluctuations
577
length of time and lost their jobs because the employer
no longer needed their skills. The typical compensation
is half salary for 26 weeks. Although the program is
intended to ease the pain of unemployment, it also leads
to prolonged periods of unemployment, as job seekers
stay unemployed for longer periods searching for new jobs.
For example, some unemployed people may
show little drive in seeking new employment, because
unemployment insurance lowers the opportunity cost
of being unemployed. Say a worker making $400 a
week when employed receives $220 in compensation
when unemployed; as a result, the cost of losing the
job is not $400 a week in forgone income but only
$180. It has been estimated that the existence of
unemployment compensation programs may raise
overall unemployment rates by as much as 1 percent.
Without unemployment insurance, a job seeker
would be more likely to take the first job offered, even
if the job did not match the job seeker’s preferences or
skill levels. A longer job search might mean a better
match, but it comes at the expense of lost production
and greater amounts of tax dollars.
DOES NEW TECHNOLOGY LEAD TO GREATER
UNEMPLOYMENT?
The widespread belief that technological advances
inevitably result in the displacement of workers is not
necessarily true. Generally, new inventions are cost
saving, and these cost savings usually generate higher
incomes for producers and lower prices and better prod-
ucts for consumers—benefits that ultimately result in
the growth of other industries. If the new equipment is
a substitute for labor, it might displace workers. For
example, many fast-food restaurants installed self-
service beverage bars to replace workers. However, new
capital equipment requires new workers to manufacture
and repair the new equipment. The most famous exam-
ple of this trade-off is the computer, which was sup-
posed to displace thousands of workers. Instead, the
computer generated a whole new growth industry that
created jobs. The problem is that it is easy to see only
the initial effect of technological advances (displaced
workers) but difficult to recognize the implications of
that invention throughout the whole economy over time.
Some economists believe that some of the real
wage differentials between skilled and unskilled work-
ers in the last couple of decades are due to technical
changes that are biased toward skilled workers. New
machines, with highly sophisticated computerization,
require highly skilled workers. Consequently, the new
machines make these workers more productive and
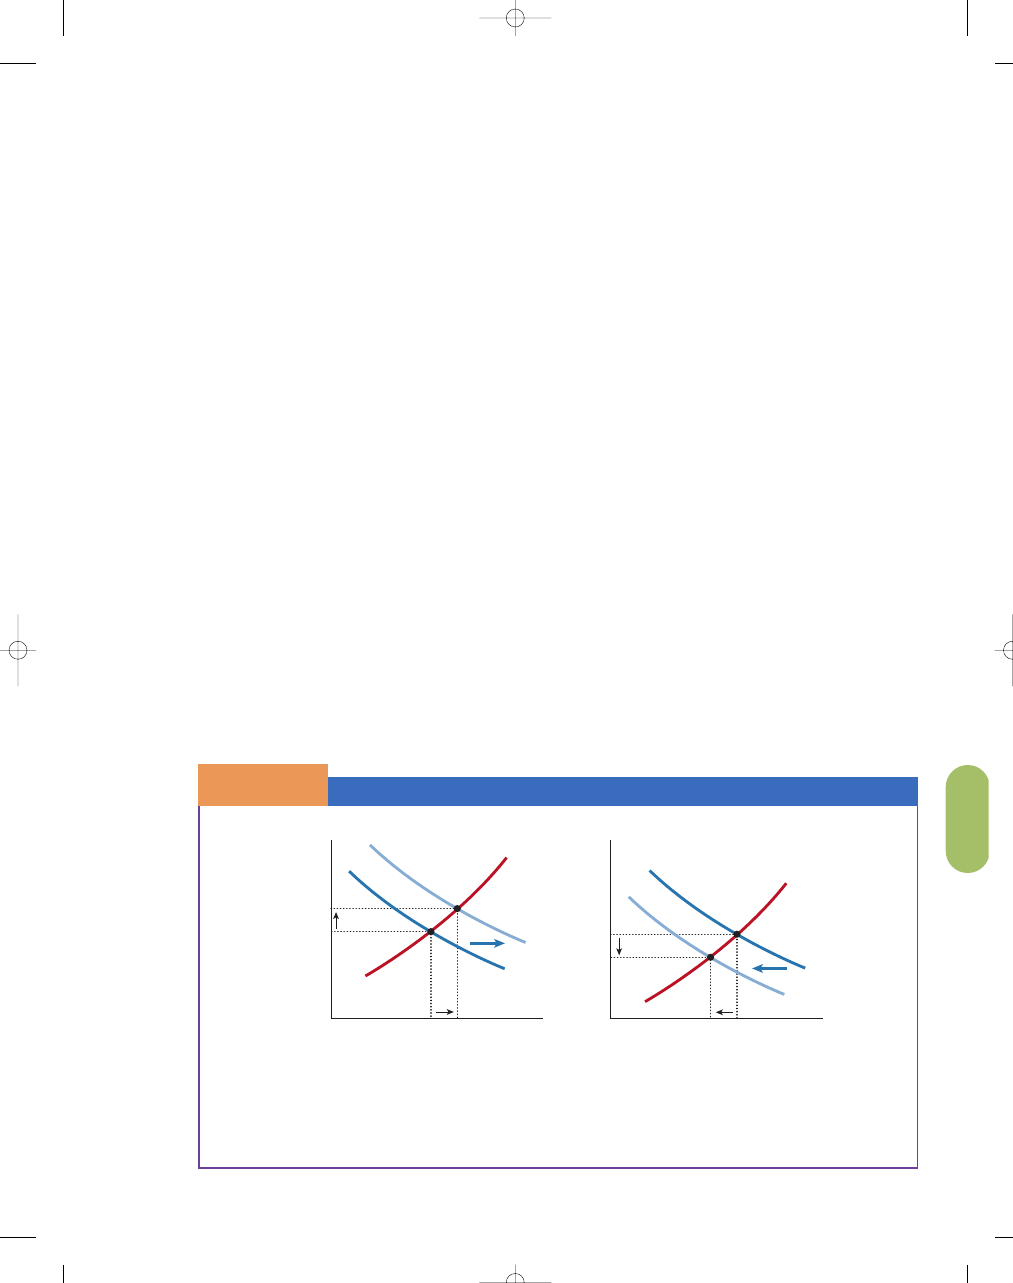
therefore they receive higher real wages. In Exhibit 2(a),
we graph the labor market for skilled workers. Because
of the increase in demand for skilled labor—skilled
workers can produce more with the new machines—
their real wages and employment are higher. At the
same time, the demand is lower for workers who do
not have the technical training to work with specialized
machinery, and the demand for unskilled workers falls
as seen in Exhibit 2(b). As a result of the decrease in
When a skill-biased technical change occurs, it increases the productivity of skilled workers. Consequently, the
increase in demand for skilled workers shifts the curve from D
1
to D
2
in (a). The increase in demand leads to higher
real wages from W
1
to W
2
and a greater quantity of skilled labor, Q
1
to Q
2
. In (b) we see a reduction in demand for
unskilled workers from D
1
to D
2
, because these workers cannot use the new technology that increases productivity.
The result is lower wages, W
1
to W
2
, and lower employment, Q
1
to Q
2
.
Real W
a
g
e
Quantity of Labor
0
Q
1
Q
2
W
1
W
2
S
D
1
D
2
Real W
a
g
e
Quantity of Labor
0
Q
2
Q
1
W
2
W
1
S
D
2
D
1
Skill-Biased Technical Change and Wage Inequality
S E C T I O N
2 1 . 4
E
X H I B I T
2
a. Skilled Workers
b. Unskilled Workers
95469_21_Ch21_p561-602.qxd 4/1/07 3:31 PM Page 577

578
M O D U L E 6
Macroeconomic Foundations
STABLE PRICE LEVEL AS A DESIRABLE GOAL
Just as full employment brings about one kind of eco-
nomic security, an overall stable
price level
increases
another form of economic security. Most prices in the
U.S. economy tend to rise over time. The continuing
rise in the overall price
level is called
inflation.
Even when the level of
prices is stable, some
prices will be rising
S E C T I O N
21.5
I n fl a t i o n
■
Why is the overall price level
important?
■
How did price level behave during the
previous century?
■
Who are the winners and losers during
inflation?
■
Can wage earners avoid the consequences
of inflation?
S E C T I O N
*
C H E C K
1.
Economists have cited three reasons why wages have failed to bring the quantity of labor demanded
into balance with the quantity of labor supplied—minimum wage, unions, and the efficiency wage
theory.
2.
At the minimum wage, the quantity of labor supplied grows because more people are willing to work
at a higher wage. However, the quantity of labor demanded falls because some employers would find it
unprofitable to hire low-skilled workers at the higher wage. That is, a higher minimum wage can lead to
higher rates of unemployment—particularly among unskilled teenagers.
3.
If the efficiency wage rate is greater than the equilibrium wage rate, the quantity of labor supplied is
greater than the quantity of labor demanded, resulting in greater amounts of unemployment.
4.
Sometimes it is difficult to get the information about particular jobs to the right job candidate. These
search activities prolong the duration of unemployment.
5.
Some unemployed persons may show little drive in seeking new employment, given the existence
of unemployment compensation. Unemployment compensation lowers the opportunity cost of being
unemployed.
1.
What are the three reasons for wages to fail to balance labor supply and labor demand?
2.
What is an efficiency wage?
3.
How do search costs lead to prolonged periods of unemployment?
4.
Why would higher unemployment compensation in a country like France lead to higher rates
of unemployment?
5.
Does new technology increase unemployment?
demand for unskilled workers, real wages and employ-
ment fall. Thus, skill-biased technical change tends to
create even greater disparities between the wages of
skilled and unskilled workers. The message: stay in
school (vocational or traditional).
price level
the average level of prices in the
economy
95469_21_Ch21_p561-602.qxd 4/1/07 3:31 PM Page 578
C H A P T E R 2 1
Introduction to Macroeconomics: Unemployment, Inflation, and Economic Fluctuations
579
while others are falling. However, when inflation is
present, the goods and services with rising prices
will outweigh the goods
and services with lower
prices. Without stabil-
ity in the price level,
consumers and pro-
ducers will experience
more difficulty in coor-
dinating their plans
and decisions. When
the overall price level
is falling, it is called
deflation.
The aver-
age price level in the U.S. economy fell throughout
the late nineteenth century.
In general, the only thing that can cause a sus-
tained increase in the rate of inflation is a high rate of
growth in money, a topic we will discuss thoroughly
in upcoming chapters.
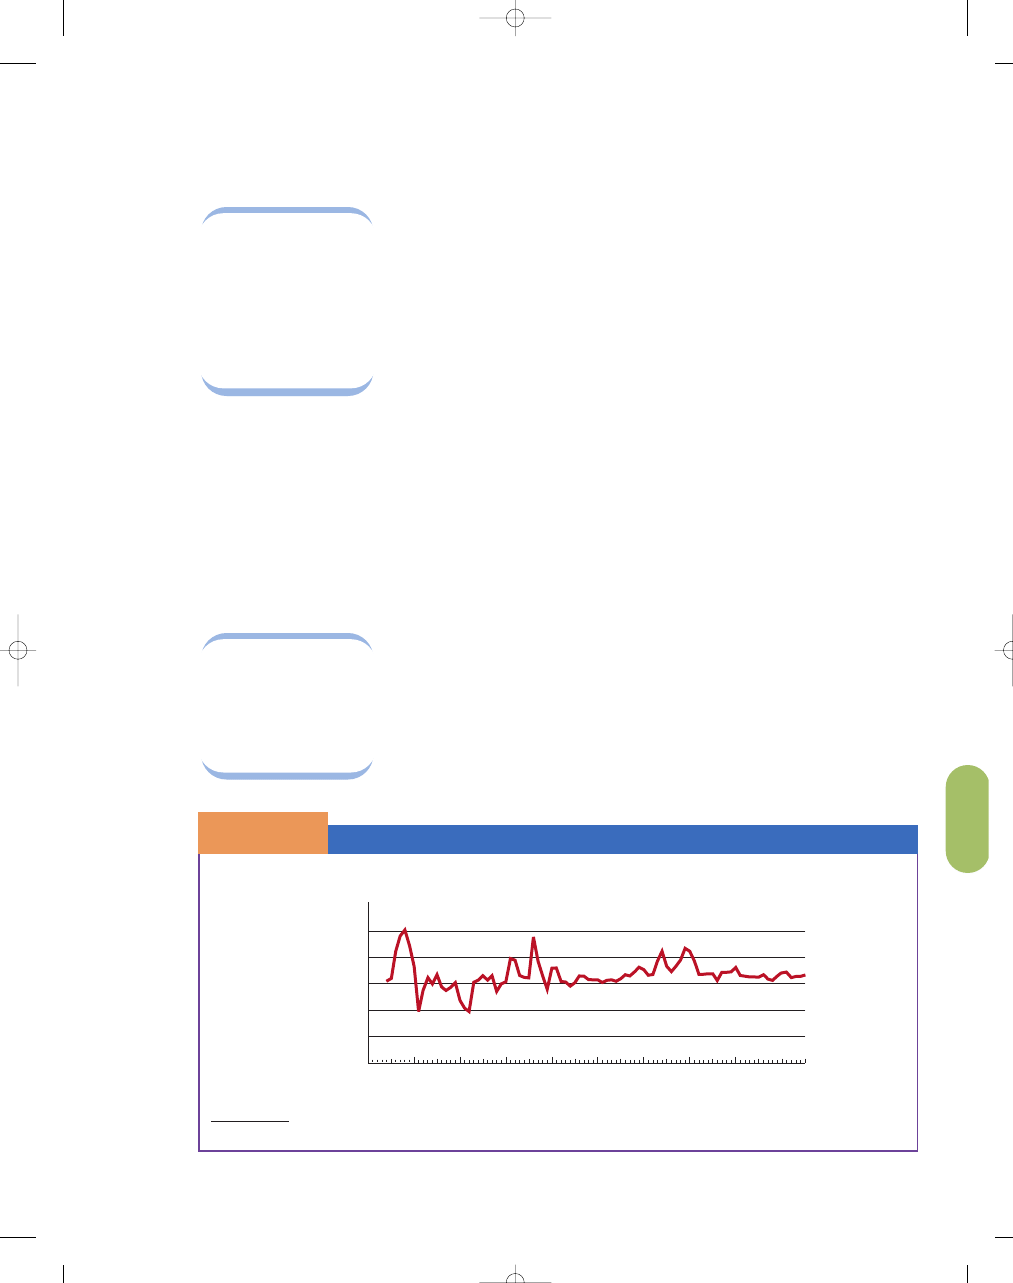
THE PRICE LEVEL OVER THE YEARS
Unanticipated and sharp changes in the price level are
almost universally considered to be “bad” and to
require a policy remedy.
What is the historical
record of changes in the
overall U.S. price level?
Exhibit 1 shows changes
in the
consumer price
index (CPI),
the stan-
dard measure of inflation,
from 1914 to 2005.
Can you believe that in 1940, stamps were 3 cents
per letter, postcards were a penny, the median price
of a house was $2,900, and the price of a new car
was $650? However, the problem with comparing
prices today with prices in the past is that it focuses
on the number of dollars it takes to buy something
rather than the purchasing power of the dollar. For
example, if prices and wages both doubled overnight,
raising the price of a quart of milk from $1 to $2,
you would be no worse off because you would still
work the same number of minutes to buy a quart
of milk.
WHO LOSES WITH INFLATION?
Inflation brings about changes in peoples’ purchasing
power, and these changes may be either desirable or
undesirable. Suppose you retire on a fixed pension of
$2,000 per month. Over time, that $2,000 will buy
less and less if prices generally rise. Your real income—
your income adjusted to reflect changes in purchasing
power—falls. Inflation lowers income in real terms for
people on fixed-dollar incomes. Likewise, inflation can
hurt creditors. For example, suppose a bank loaned
someone money for a house, at a 4 percent fixed rate
for 20 years, in the early 1960s (a period of low infla-
tion). However, the 1970s was a period of high infla-
tion rates (roughly 10% per year). Under this scenario,
because the lender did not correctly anticipate the
higher rate of inflation, the lender is the victim of
unanticipated inflation. That is, the borrower is
paying back with dollars that have much less purchas-
ing power than those dollars they borrowed in the
early 1960s. Another group that sometimes loses from
inflation
a rise in the overall price level,
which decreases the purchasing
power of money
deflation
a decrease in the overall price level,
which increases the purchasing
power of money
consumer price
index (CPI)
a measure of the trend in prices
of a basket of consumable goods
and services that serves to gauge
inflation
SOURCE: Bureau of Labor Statistics, 2006.
30%
20%
10%
0%
–10%
–20%
–30%
1910
1920
1930
1940
1950
Year
P
e
rcent
1970
1980
1960
1990
2000
Consumer Price Index
All Urban Consumers (CPI-U), Annual Percentage Change
The Price Level in the United States, 1914–2005
S E C T I O N
2 1 . 5
E
X H I B I T
1
95469_21_Ch21_p561-602.qxd 4/1/07 3:31 PM Page 579

580
M O D U L E 6
Macroeconomic Foundations
inflation, at least temporarily, comprises people whose
incomes are tied to long-term contracts. If inflation
begins shortly after a labor union signs a three-year
wage agreement, it may completely eat up the wage
gains provided by the contract. The same applies to
businesses that agree to sell quantities of one thing, say
coal, for a fixed price for a given number of years.
If some people lose because of changing prices,
others must gain. Debtors pay back dollars worth less
in purchasing power than those borrowed.
Corporations that can quickly raise the prices on their
goods may have revenue gains greater than their
increases in costs, providing additional profits. Wage
earners sometimes lose from inflation because wages
may rise at a slower rate than the price level. The
redistributional impact of inflation is not the result of
conscious public policy; it just happens.
The uncertainty that inflation creates can also
discourage investment and economic growth. When
inflation rates are high, they also tend to vary consid-
erably, which creates a lot of uncertainty. This uncer-
tainty complicates planning for businesses and
households, which is vital to capital formation, as
well as adding an inflation risk premium to long-term
interest rates.
Moreover, inflation can raise one nation’s price
level relative to price levels in other countries. In turn,
this shift can make financing the purchase of foreign
goods difficult, or it can decrease the value of the
national currency relative to that of other countries.
Costs of High Inflation
Predictably low rates of inflation, while still a prob-
lem, are considerably better than high and variable
inflation rates. A slow predictable rate of inflation
makes predicting future price increases relatively easy.
Consequently, setting interest rates will be an easier
task and the redistribution effects of inflation will be
minimized. In addition,
high and variable infla-
tion rates make it
almost impossible to
set long-term contracts
because prices and
interest rates may be
changing by the day, or
even by the hour in the case of
hyperinflation
—
extremely high rates of inflation for sustained periods
of time.
In its extreme form, inflation can lead to a com-
plete erosion of faith in the value of the pieces of
paper we commonly call money. In Germany, after
both world wars, prices rose so fast that people in
some cases finally refused to take paper money,
insisting instead on payment in goods or metals,
whose prices tend to move predictably with
inflation. Unchecked inflation can feed on itself and
may ultimately lead to hyperinflation of 300 percent
or more per year. We saw these rapid rates of
inflation in Argentina in the 1980s and Brazil in the
1990s. Most economists believe we can live quite
well in an environment of low, steady inflation, but
no economist believes we can prosper with high,
variable inflation.
UNANTICIPATED INFLATION
DISTORTS PRICE SIGNALS
High inflation also distorts economic decisions by
affecting after-tax income, because many aspects of
the tax system are not indexed for inflation, such as
the capital gains tax. (A capital gain is the difference
between the price at which an asset—for instance, a
stock—is sold and the price at which it is bought.)
Also, high inflation leads to people spending their
time and financial resources trying to find hedges
against inflation rather than engaging in productive
activities.
In periods of high
and variable inflation,
households and firms
have a difficult time
distinguishing between
changes in the
relative
price
of individual goods
and services (the price of a specific good compared to
the prices of other goods) and changes in the general
price level of all goods and services. Suppose the price
of milk rises by 5 percent between 2006 and 2007, but
the overall price level (inflation rate) increases by only
2 percent during that period. Then we could say that
between 2006 and 2007, the relative price of milk rose
only 3 percent (5% – 2%). The next year, the price of
milk might increase 5 percent again, but the general
inflation rate might be 6 percent. That is, between 2007
and 2008, the relative price of milk might actually fall
by 1 percent (5% – 6%). Remember, the relative price
is the price of a good relative to all other goods and
services. Because of this difficulty in establishing rela-
tive prices, inflation distorts the information that flows
from price signals. Does the good have a higher price
because it has become relatively more scarce and there-
fore more valuable relative to other goods, or did the
price rise along with all other prices because of
inflation? This muddying of price information under-
mines good decision making.
580
hyperinflation
extremely high rates of inflation
for sustained periods of time
relative price
the price of a specific good com-
pared to the price of other goods
95469_21_Ch21_p561-602.qxd 4/1/07 3:31 PM Page 580

C H A P T E R 2 1
Introduction to Macroeconomics: Unemployment, Inflation, and Economic Fluctuations
581
OTHER COSTS OF INFLATION
Another cost of inflation is the cost incurred by firms
as a result of being forced to change prices more
frequently. For example, a restaurant might have to
print new menus, or a department or mail-order
store may have to print
new catalogs to reflect
changing prices. These
costs are called
menu
costs;
they are the costs
of changing posted
prices. In some South
American economies in
the 1980s, inflation increased at more than 300
percent per year, with prices changing on a daily,
or even hourly, basis in some cases. Imagine how
large the menu costs could be in an economy such
as that!
The shoe-leather cost of inflation is the cost of
going to and from the bank to check on your assets
(so often that you wear
out the leather on your
shoes). Specifically, high
rates of inflation erode
the value of a cur-
rency, which means that
people will want to hold
less currency—perhaps
going to the ATM once a week rather than twice a
month. That is, the higher inflation rates lead to
higher nominal interest rates, which may induce
more individuals to put money in the bank rather
than allowing it to depreciate in their pockets. So,
the cost is really the time and convenience sacrificed
to keep less money on hand than you would if infla-
tion were not a factor. The effects of shoe-leather
costs of inflation, like those of menu costs, are
modest in countries with low inflation rates but
can be quite large in countries where inflation is
substantial.
INFLATION AND INTEREST RATES
The interest rate is usu-
ally reported as the
nominal interest rate,
which means it is not
adjusted for inflation.
We determine the
real
interest rate
by taking
the nominal rate of
interest and subtracting
the inflation rate:
Real interest rate
= Nominal interest rate
– Inflation rate
menu costs
the costs imposed on a firm from
changing listed prices
shoe-leather cost
the cost incurred when individuals
reduce their money holdings
because of inflation
SOURCES: The World Factbook, 2006; http://www.cia.gov.
g l o b a l w a t c h
40%
35%
30%
25%
20%
15%
10%
5%
0%
Jamaica
15.3%
Brazil
6.9%
Venezuela
16%
Indonesia
10.5%
Russia
12.7%
Mexico
4%
U.K.
2.1%
U.S.
3.2%
Canada
2.2%
Argentina
9.6%
Iraq
33%
Inflation Rate
(Ann
ual P
er
cent Chang
e)
Average Annual Inflation Rates, Selected Countries, 2005
nominal interest rate
the reported interest rate that
is not adjusted for inflation
real interest rate
the nominal interest rate minus the
inflation rate; also called the
inflation-adjusted interest rate
95469_21_Ch21_p561-602.qxd 4/1/07 3:31 PM Page 581

582
M O D U L E 6
Macroeconomic Foundations
For example, if the nominal interest rate was
5 percent, and the inflation rate was 3 percent, the
real interest rate would be 2 percent.
If people can correctly anticipate inflation, they
will behave in a manner that will largely protect them
against loss. However, if the inflation is not correctly
anticipated, (it is not an easy task to predict inflation)
inflation will still redistribute income. Consider the
creditor who believes that the overall price level will
rise 6 percent a year, based on experience in the imme-
diate past. Would that creditor lend money to some-
one at a 5 percent rate of interest? No. A 5 percent rate
of interest means that a person borrowing $1,000 now
will pay back $1,050 ($1,000 plus 5 percent of
$1,000) one year from now. But if prices go up 6 percent,
it will take $1,060 to buy what $1,000 does today
($1,060 is 6% more than $1,000). Thus, the creditor
lending at 5 percent will get paid back an amount
($1,050) less than the purchasing power of the origi-
nal loan ($1,060) at the time it was paid back. The real
interest rate would actually be negative. To protect
themselves, creditors will demand a rate of interest
large enough to compensate for the deteriorating value
of money.
Failure to understand the difference between
nominal and real interest rates is critical. In most eco-
nomic decisions, it is the real rate of interest that mat-
ters because it is this rate that shows how much
borrowers pay and lenders receive in terms of pur-
chasing power—goods and services money can buy.
Investors and lenders will do best when the real inter-
est rates are high. For example, investors who bought
a bond in 1985 did very well, even though the nomi-
nal interest rate was not that high, as we can see in the
table in Exhibit 2. Exhibit 3 shows the real interest
rates since 1965. We see that the real interest rate was
actually negative from the early 1970s to the early
1980s. When the real interest rate is negative, the
lender pays the borrower rather than the borrower
paying the lender!
using what you’ve learned
Inflation
Evaluate the following three statements regarding what happens
during inflation: (1) People have less money to spend, (2) fewer
goods are available, and (3) people must pay more money for goods
purchased.
Of the three statements, only one is correct: With inflation,
we must, on average, pay more money for the goods we pur-
chase. Inflation does not necessarily mean we have fewer goods but
rather that, on net, these goods have higher price tags. Inflation does
not necessarily mean that people have less money to spend.
Employees and unions will bargain for higher wages when inflation is
a factor.
Q
A
Nominal Interest Rates, Inflation Rates, and Real Interest Rates, 1965–2005
S E C T I O N
2 1 . 5
E
X H I B I T
2
Nominal
Real
Interest
minus
Inflation
equals
Interest
Year
Rate*
Rate**
Rate
1965
4.0%
1.6%
2.4%
1970
6.5%
5.7%
.8%
1975
5.8%
9.1%
−3.3%
1980
11.5%
13.5%
−2.0%
1985
7.5%
3.6%
4.0%
1990
7.5%
5.4%
2.1%
1995
5.5%
2.8%
2.7%
2000
5.9%
3.4%
2.5%
2005
3.1%
3.4%
–0.3%
*three-month Treasury securities
**year-to-year inflation rate
SOURCE: Economic Report of the President 2006.
95469_21_Ch21_p561-602.qxd 4/1/07 3:31 PM Page 582
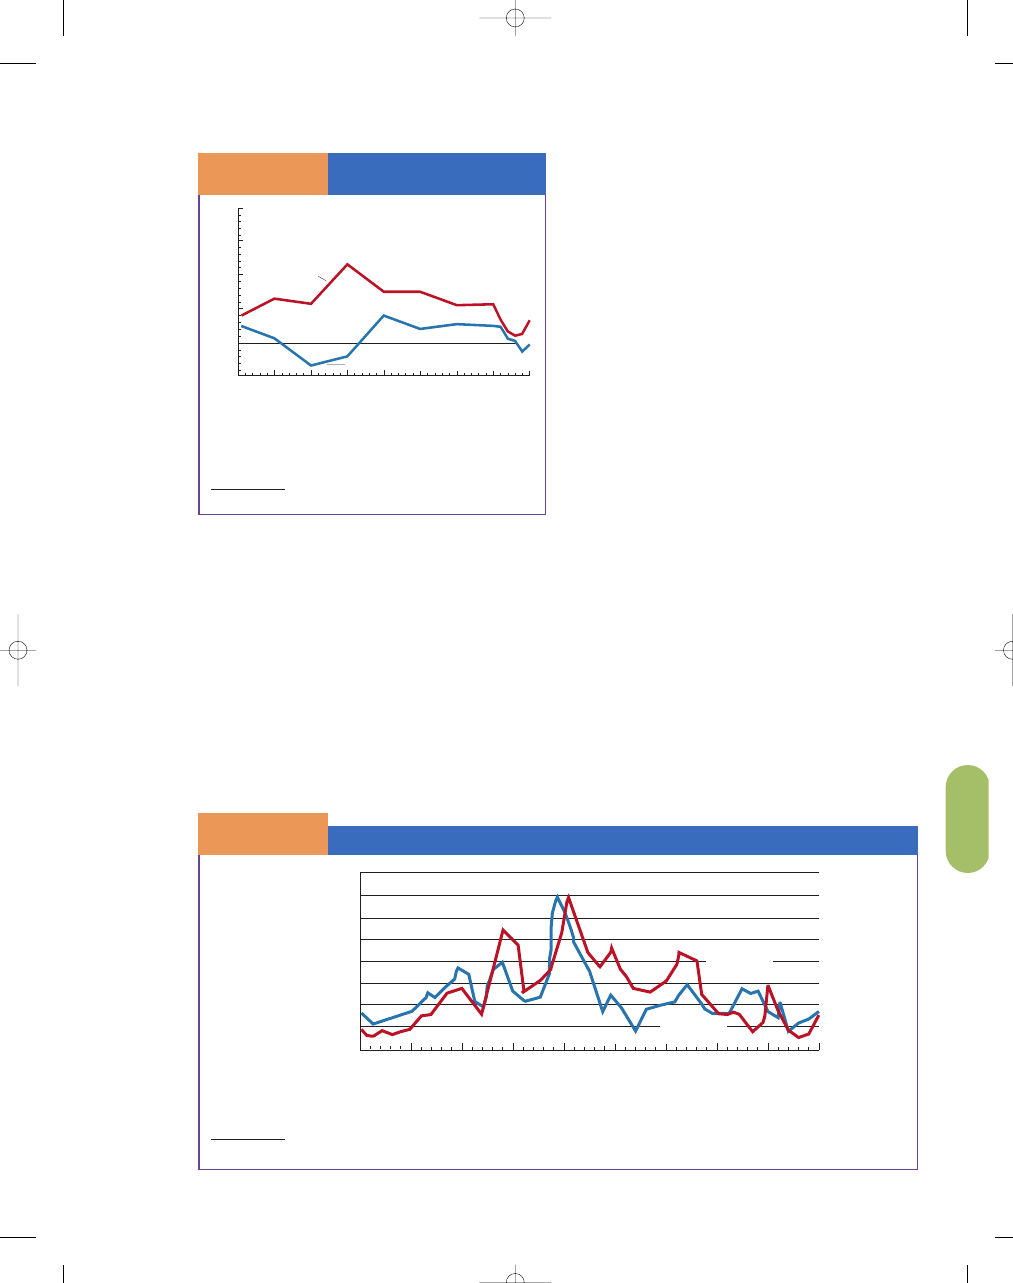
C H A P T E R 2 1
Introduction to Macroeconomics: Unemployment, Inflation, and Economic Fluctuations
583
In Exhibit 4, notice that when the nominal interest
rate is high, the inflation rate is high; and when the nom-
inal interest rate is low, the inflation rate is low. Why?
The reason is that when inflation is high, borrowers offer
and lenders demand higher nominal interest rates to
compensate for the falling value of money in the future.
When the inflation rate is low, borrowers offer and
lenders demand lower nominal interest rates because
the value of money (purchasing power) is falling less
quickly. Therefore, the tendency is for nominal interest
rates and inflation rates to move together—high
inflation rates mean high nominal interest rates, and
low inflation rates mean low nominal interest rates.
DO CREDITORS ALWAYS LOSE DURING INFLATION?
Usually, lenders are able to anticipate inflation with
reasonable accuracy. For example, in the late 1970s,
when the inflation rate was more than 10 percent a
year, nominal interest rates on a 90-day Treasury bill
were relatively high. In 2002, with low inflation rates,
the nominal interest rate was relatively low. If the
inflation rate is anticipated accurately, new creditors
will not lose nor will debtors gain from a change in
the inflation rate. However, nominal interest rates and
real interest rates do not always run together. For
example, in periods of high unexpected inflation, the
nominal interest rates can be high when the real inter-
est rates are low or even negative.
PROTECTING OURSELVES FROM INFLATION
Increasingly, groups try to protect themselves from
inflation by means of cost-of-living clauses in con-
tracts. Many long-term contracts between firms and
unions include a cost of living allowance (COLA) that
automatically increases when the consumer price
index (CPI) increases. With these clauses, laborers
automatically get wage increases that reflect rising
prices. The same is true of many pensioners, including
those on Social Security. Personal income taxes like-
wise are now indexed (adjusted) for inflation.
However, some of the tax code is still not indexed for
inflation. These factors affect the incentives to work,
save, and invest.
Some economists argue that we should go one
step further and index everything, meaning that all
contractual arrangements would be adjusted frequently
Real and Nominal
Interest Rates
S E C T I O N
2 1 . 5
E
X H I B I T
3
15
10
5
0
⫺5
1965
1970
1975
1980
1985
Year
Interest Rates (per
cent per y
ear)
1995
2000
2005
1990
Nominal interest rate
Real interest rate
The real interest rate is the nominal interest rate (the
rate on a three-month Treasury bill) minus the
inflation rate (measured by the consumer price index).
SOURCE: Economic Report of the President, 2006.
Nominal interest rates tend to be high when inflation is high and low when inflation is low.
SOURCE: Economic Report of the President 2006.
16
14
12
10
8
6
4
2
0
1960
1965
1970
1975
1980
Year
Inflation and Nominal
Interest Rates
1990
1995
1985
2000
2005
Nominal
interest rate
Inflation rate
Inflation and Nominal Interest Rates in the United States, 1960–2005
S E C T I O N
2 1 . 5
E
X H I B I T
4
95469_21_Ch21_p561-602.qxd 4/1/07 3:31 PM Page 583

584
M O D U L E 6
Macroeconomic Foundations
to take account of changing prices. Such an arrange-
ment might reduce the impact of inflation, but it
would also entail additional contracting costs (and
not every good—most notably, currency—can be
indexed). An alternative approach has been to try to
stop inflation through various policies relating to the
amount of government spending, tax rates, and the
amount of money cre-
ated.
Wage and price
controls
—legislation
limiting wage and price
increases—offer still
another approach to the
inflation problem.
using what you’ve learned
Inflation and Capital Gains Taxes
In an environment of inflation, the tax code can distort market signals and
may lead to a reduction in saving, lending, and investment. To many econo-
mists, the problem stems from capital gains tax (a tax on a person’s assets)
being taxed in nominal terms rather than in real terms (adjusted for inflation).
For example, suppose you sold a stock in 1980 for $50,000 that you bought in
1970 for $40,000. In real terms, adjusted for inflation, you would have lost
money because the 25 percent increase in the stock price would be less than the
percentage change in the inflation rate (over 100%). In fact, inflation was so
high in the 1970s you would have lost money on your stock in real terms and
then have to pay capital gains tax on the nominal gains—$10,000 ($50,000
−
$40,000)—ouch! Thus, many economists believe capital gains should be taxed
on real gains. In this case, you could write off capital losses because you actu-
ally lost money on your investment in real terms. These costs are not just a
redistribution cost but can impact economic growth if the taxes are discour-
aging saving and investment.
wage and price
controls
legislation used to combat inflation by
limiting changes in wages and prices
using what you’ve learned
Anticipated Inflation and Interest Rates
Suppose you had a 30-year fixed-interest mortgage on a home you
purchased six years ago. In the meantime, the inflation rate has
fallen considerably and probably will not reach that higher level again. Did
you get a good interest rate on your loan?
No. You will be paying a higher interest rate to borrow money than
others who borrowed money more recently. Of course, you could
refinance to get a lower interest rate, but you would need to calculate how
much you would save on your loan and compare it to the cost of refinancing
to determine whether it would be worthwhile.
Q
A
S E C T I O N
*
C H E C K
1.
Unanticipated inflation causes unpredictable transfers of wealth and reduces the efficiency of the market
system by distorting price signals.
2.
Inflation generally hurts creditors and those on fixed incomes and pensions; debtors generally benefit from
inflation.
3.
The nominal interest rate is the actual amount of interest you pay. The real interest rate is the nominal rate
minus the inflation rate.
4.
Wage earners attempt to keep pace with inflation by demanding higher wages each year or by indexing their annual
wage to inflation.
1.
How does price level stability reduce the difficulties buyers and sellers have in coordinating their plans?
2.
What will happen to the nominal interest rate if the real interest rate rises, ceteris paribus? What if inflation
increases, ceteris paribus?
95469_21_Ch21_p561-602.qxd 4/1/07 3:31 PM Page 584

C H A P T E R 2 1
Introduction to Macroeconomics: Unemployment, Inflation, and Economic Fluctuations
585
SHORT-TERM FLUCTUATIONS
IN ECONOMIC GROWTH
The aggregate amount of economic activity in the
United States and most other nations has increased
markedly over time, even on a per capita basis, indi-
cating economic growth. Short-term fluctuations in
the level of economic activity also occur. We some-
times call these short-term fluctuations
business
cycles.
Exhibit 1 illustrates the distinction between
long-term economic growth and short-term economic
fluctuations. Over a long period, the line representing
economic activity slopes upward, indicating increasing
real output. Over short
periods, however, down-
ward, as well as upward,
output changes occur.
Business cycles refer to
the short-term ups and
downs in economic activ-
ity, not to the long-term trend in output, which in
modern times has been upward.
THE PHASES OF A BUSINESS CYCLE
A business cycle has four phases—expansion, peak,
contraction, and trough—as illustrated in Exhibit 2.
The period of
expansion
is when output (real
GDP) is rising significantly. Usually, during the
expansion phase, unemployment is falling and both
consumer and business confidence are high. Thus,
investment is rising, as
are expenditures for
expensive durable con-
sumer goods, such as
automobiles and house-
hold appliances. The
peak
is the point in time
when the expansion
comes to an end, when
output is at the high-
est point in the cycle.
The
contraction
is a
period of falling real
output and is usually
accompanied by rising
3.
Say you owe money to Big River Bank. Will you gain or lose from an unanticipated decrease
in inflation?
4.
How does a variable interest rate loan “insure” the lender against unanticipated increases in
inflation?
5.
Why will neither creditors nor debtors lose from inflation if it is correctly anticipated?
6.
How could inflation make people turn to exchange by barter?
S E C T I O N
21.6
E c o n o m i c F l u c t u a t i o n s
■
What are short-term economic fluctuations?
■
What are the four stages of a business cycle?
■
What is the difference between a recession
and a depression?
Business Cycles and
Economic Growth
S E C T I O N
2 1 . 6
E
X H I B I T
1
Real GDP per
Y
ear
Time
0
Growth
Trend
In a growing economy, business downturns are tem-
porary reversals from a long-term trend of economic
growth.
business cycles
short-term fluctuations in the econ-
omy relative to the long-term trend
in output
expansion
when output (real GDP) is rising
significantly—the period between
the trough of a recession and the
next peak
peak
the point in time when expansion
comes to an end, that is, when output
is at the highest point in the cycle
contraction
when the economy is slowing down—
measured from the peak to the trough
95469_21_Ch21_p561-602.qxd 4/1/07 3:31 PM Page 585

586
M O D U L E 6
Macroeconomic Foundations
unemployment and declining business and consumer
confidence. The contraction phase is measured from the
peak to the
trough
—
the point in time when
output stops declining
and business activity is
at its lowest point in the
cycle. Investment spend-
ing and expenditures on
consumer durable goods
fall sharply in a typical
contraction. The con-
traction phase is also
called
recession,
a period of significant decline in
output and employment (lasting more than a few
months). Unemployment is relatively high at the
trough, although the actual maximum amount of
unemployment may not occur exactly at the trough.
Often, unemployment remains fairly high well into
the expansion phase. The expansion phase is meas-
ured from the trough to the peak.
HOW LONG DOES A BUSINESS CYCLE LAST?
The length of any given business cycle is not uniform.
Because it does not have the regularity that the term
cycle implies, economists often use the term economic
fluctuation rather than business cycle. In addition,
economic fluctuations are almost impossible to predict.
In both the 1980s and the 1990s, expansions were
quite long by historical standards. The contraction
phase is one of recession, a decline in business activ-
ity. A severe recession is called a
depression.
Likewise, a prolonged
expansion in economic
activity is sometimes
called a
boom.
Exhibit 3
shows the record of
U.S. business cycles
since 1854. Notice that
contractions seem to
be getting shorter over
time. The National
Bureau of Economic
Research (NBER) Business Cycle Dating Committee
determined that a recession began in March 2001,
ending an expansion that lasted from March 1991 to
March 2001. The attacks of September 11, 2001,
clearly deepened the contraction and may have been
instrumental in turning a contraction into a recession.
SEASONAL FLUCTUATIONS AFFECT
ECONOMIC ACTIVITY
The determinants of cyclical fluctuations in the econ-
omy are the major thrust of the next several chapters,
and some fluctuation in economic activity reflects sea-
sonal patterns. Business activity, whether measured by
production or by the sale of goods, tends to be high in
the two months before the winter holidays and some-
what lower in summertime, when many families are on
vacation. Within individual industries, of course, sea-
sonal fluctuations in output often are extremely pro-
nounced, agriculture being the best example. Often, key
economic statistics, such as unemployment rates, are
seasonally adjusted, meaning the numbers are modified
to account for normal seasonal fluctuations. Thus, sea-
sonally adjusted unemployment rates in summer
months are below actual unemployment rates, because
employment is normally high in summertime due to the
inflow of school-age workers into the labor force.
POLITICAL BUSINESS CYCLES
Studies show a strong correlation between the perform-
ance of the economy and the fate of an incumbent
president’s (or an incumbent president’s party’s) bid
for reelection. In fact, the 1992 presidential election
sheds light on this hypothesis. President George H. W.
Bush lost his reelection bid shortly after the economy
had struggled through the 1990–1991 recession. Some
scholars speculate that if the election had taken place
a few months later, when the economic data looked a
lot stronger, President Bush would have been reelected.
depression
severe recession or contraction in
output
boom
period of prolonged economic
expansion
Four Phases of a
Business Cycle
S E C T I O N
2 1 . 6
E
X H I B I T
2
Real GDP per
Y
ear
Time
0
Trough
Growth
Trend
Co
ntr
ac
tio
n
E
xp
a
n
si
o
n
Peak
Peak
Recession Recovery
Business cycles have four phases: expansion, peak,
contraction, and trough. The expansion phase usually
is longer than the contraction; and in a growing econ-
omy, output (real GDP) will rise from one business
cycle peak to the next.
trough
the point in time when output stops
declining, that is, when business activ-
ity is at its lowest point in the cycle
recession
a period of significant decline in
output and employment
95469_21_Ch21_p561-602.qxd 4/1/07 3:31 PM Page 586

C H A P T E R 2 1
Introduction to Macroeconomics: Unemployment, Inflation, and Economic Fluctuations
587
If this correlation between the strength of the
economy and a successful reelection bid does exist, it
would be in the best interest of the incumbent to do
everything in his or her power to stimulate the econ-
omy in the period leading up to the election. These
efforts might take the form of trying to pressure the
Federal Reserve system into using monetary policy to
lower the interest rate or pressing Congress to cut
taxes or increase government spending—anything
that might generate more spending and thus greater
employment. Of course, the negative side is that
although the incumbent may get reelected, the economy
may have been overstimulated, causing inflationary
problems.
However, the evidence for a political business
cycle is mixed. It is possible that the 1972 presidential
election reflected a political business cycle, because
the economy was pushed beyond potential GDP with
expansionary monetary policy. However, the elections
of 1980 and 1992 occurred during recessions, indi-
cating that no one successfully tried to overstimulate
the economy before either of those elections. In 1980,
Ronald Reagan defeated Jimmy Carter at least partly
because Carter’s appointee to the Federal Reserve,
A Historical Record of U.S. Business Cycles, 1854–2006
S E C T I O N
2 1 . 6
E
X H I B I T
3
Expansion
Contraction
Trough
(Months)
Peak
(Months)
December 1854
30
June 1857
18
December 1858
22
October 1860
8
June 1861
46 (Civil War)
April 1865
32
December 1867
18
June 1869
18
December 1870
34
October 1873
65
March 1879
36
March 1882
38
May 1885
22
March 1887
13
April 1888
27
July 1890
10
May 1891
20
January 1893
17
June 1894
18
December 1895
18
June 1897
24
June 1899
18
December 1900
21
September 1902
23
August 1904
33
May 1907
13
June 1908
19
January 1910
24
January 1912
12
January 1913
23
December 1914
44 (World War I)
August 1918
7
March 1919
10
January 1920
18
July 1921
22
May 1923
14
July 1924
7
October 1926
13
November 1927
21
August 1929
43 (Depression)
March 1933
50
May 1937
13 (Depression)
June 1938
80 (World War II)
February 1945
8
October 1945
37
November 1948
11
October 1949
45 (Korean War)
July 1953
10
May 1954
39
August 1957
8
April 1958
24
April 1960
10
February 1961
106 (Vietnam War)
December 1969
11
November 1970
36
November 1973
16
March 1975
58
January 1980
6
July 1980
12
July 1981
16
November 1982
92
July 1990
8
March 1991
120
March 2001
8
November 2001
—
Between 1982 and 2000, the economy experienced a long boom, with only a brief eight-month recession in 1990–1991.
The expansion of the 1990s was the longest in history. According to Nobel laureate Paul Samuelson, “The old-fashioned
business cycle, in its virulence, should be as gone as the old-fashioned diptheria and pre-penicillin diseases.”
SOURCES: National Bureau of Economic Research,Inc., http://www.nber.org/cycles.html; and U.S. Department of Commerce, Survey of Current Business, September
2006, Table C-1.
95469_21_Ch21_p561-602.qxd 4/1/07 3:31 PM Page 587

588
M O D U L E 6
Macroeconomic Foundations
Paul Volker, pursued a contractionary monetary policy
to fight the high inflation rates of the late 1970s. The
expected result was a recession, which most likely lost
the 1980 election for Carter.
FORECASTING CYCLICAL CHANGES
The farmer and the aviator rely heavily on weather
forecasters for information on climatic conditions in
planning their activities. Similarly, businesses, govern-
ment agencies, and, to a lesser extent, consumers rely
on economic forecasts to learn of forthcoming devel-
opments in the business cycle. If it looks as if the
economy will continue in an expansionary phase,
businesses may expand production to meet a per-
ceived forthcoming need; if it looks as if contraction
is coming, businesses may decide to be more cautious.
Forecasting Models
Using theoretical models, which will be discussed in
later chapters, economists gather statistics on eco-
nomic activity in the immediate past, including, for
example, consumer expenditures, business inventories,
the supply of money, governmental expenditures, tax
revenues, and so on. Using past historical relationships
between these factors and the overall level of economic
activity (which form the basis of the economic theo-
ries), they formulate econometric models. Statistics
from the immediate past are plugged into the model,
and forecasts are made. Because human behavior
changes, and our assumptions about certain future
developments may not be correct, our numbers are
imperfect, and our econometric models are not always
accurate. But like the weather forecasts, although the
econometric models are not perfect, they are helpful.
Leading Economic Indicators
One less sophisticated but useful forecasting tool is
watching trends in
leading economic indicators.
Some types of economic activity change before the
economy as a whole changes. If in March these activi-
ties show an increase after having declined for several
months, past experience
suggests that the entire
output will start rising
after a few months, per-
haps in July or August.
About a dozen such
leading indicators exist,
including the lengths of
the average workweek,
the size of the nation’s
money supply, prices of common stocks, the number of
new businesses formed, and new orders for plants and
equipment. The Department of Commerce combines
all these into an index of leading indicators. If the index
rises sharply for two or three months, it is likely (but
not certain) that increases in the overall level of activity
will follow.
Since the development of the leading economic indi-
cators some 60 years ago, the composite index of lead-
ing economic indicators has never failed to give some
warning of an economic downturn. Unfortunately, the
lead time has varied widely. The composite index turned
down 23 months prior to the 1957–1958 recession but
gave only a three-month warning before the 1981–1982
slump. This variance in lead time can cause particular
policy problems. Specifically, the use of leading eco-
nomic indicators to predict future trends can make
policy decisions less accurate. For example, if the federal
government responds with policies to combat the reces-
sion as soon as the leading economic indicators begin
predicting a recession, then the recession that would
have occurred may fail to materialize. On the other
hand, a self-fulfilling prophecy may result if businesses
respond with cutbacks in orders for plant and equip-
ment as soon as the leading economic indicators begin
predicting a recession.
The economic indicators do provide a warning of
a likely downturn, but they do not provide accurate
information on the depth or duration of the downturn.
S E C T I O N
*
C H E C K
1.
Business cycles (or economic fluctuations) are
short-term fluctuations in the amount of eco-
nomic activity, relative to the long-term growth
trend in output.
2.
The four phases of a business cycle are expan-
sion, peak, contraction, and trough.
3.
Recessions occur during the contraction phase
of a business cycle. Severe, long-term recessions
are called depressions.
4.
The economy often goes through short-term con-
traction even during a long-term growth trend.
1.
Why would you expect unemployment to fall
during an economy’s expansionary phase and to
rise during a contractionary phase?
2.
Why might a politician want to stimulate the
economy prior to a reelection bid?
3.
Why is the output of investment goods and
durable consumer goods more sensitive to the
business cycle than that of most goods?
4.
Why might the unemployment rate fall after
output starts recovering during the expansion
phase of the business cycle?
leading economic
indicators
factors that economists at the
Commerce Department have found
typically change before changes in
economic activity
95469_21_Ch21_p561-602.qxd 4/1/07 3:31 PM Page 588

I n t e r a c t i v e S u m m a r y
Fill in the blanks:
1. Three major macroeconomic goals are maintaining
employment at _____________ levels; maintaining
prices at a(n) _____________ level; and achieving a(n)
_____________ rate of economic growth.
2. Concern over both unemployment and price instabil-
ity led to the passage of the _____________ , in which
the United States committed itself to policies designed
to reduce unemployment in a manner consistent with
price stability.
3. With high rates of unemployment, society loses some
potential _____________ of goods and services.
4. The unemployment rate is the number of people
officially _____________ divided by _____________.
5. The labor force is the number of people over the age
of 16 who are either _____________ or ____________.
6. _____________ workers, who have not actively sought
work for four weeks, are not counted as unemployed;
instead, they fall out of the _____________.
7. Some people working overtime or extra jobs might be
considered to be _____________ employed.
8. The four main categories of unemployed workers include
job _____________ (temporarily laid off or fired), job
_____________ (quit), _____________ (worked before
and now reentering the labor force), and _____________
(entering the labor force for the first time).
9.
typically account for the largest
fraction of those unemployed.
10. In the short run, a reduction in unemployment
may come at the expense of a higher rate of
, especially if the economy is close
to full capacity.
11. Trying to match employees with jobs quickly may
lead to significant inefficiencies because of
between a worker’s skill level
and the level of skill required for a job.
12. The duration of unemployment tends to be greater
when the amount of unemployment is
and smaller when the amount of
unemployment is
.
13. The percentage of the population that is in the labor
force is called the
rate.
14. Frictional unemployment is
term
and results from the
turnover in
the labor market.
15. Frictional unemployment tends to be somewhat
in periods of low unemployment,
when job opportunities are plentiful.
16. If individuals seeking jobs and employers seeking
workers had better information about each other, the
amount of frictional unemployment would be consid-
erably .
17.
unemployment reflects the exis-
tence of persons who lack the necessary skills for jobs
that are available.
18.
unemployment is the most volatile
form of unemployment.
19. Most of the attempts to solve the unemployment
problem have placed an emphasis on increasing
.
20. Job retraining programs have the potential to reduce
unemployment.
21. The natural rate of unemployment roughly equals the
sum of
and
unemployment when they are at a maximum.
22. One can view unemployment rates below the
rate as reflecting the existence of a
below-average level of frictional and structural unem-
ployment.
23. The natural rate of unemployment is the median, or
“typical,” unemployment rate, equal to the sum of
and unemploy-
ment when they are at a maximum.
24. The natural rate of unemployment may change over
time
as , ,
, and other conditions vary.
25. When all of the economy’s labor resources and other
resources, such as capital, are fully employed, the
economy is said to be producing its
level of output.
26. When the economy is experiencing cyclical unemploy-
ment, the unemployment rate is
than the natural rate.
27. The economy can
exceed potential
output as workers put in overtime or moonlight by
taking on extra employment.
28. Without price stability, consumers and producers will
experience more difficulty in
their
plans and decisions.
29. In general, the only thing that can cause a sustained
increase in the rate of inflation is a(n)
rate of growth in money.
30. The
is the standard measure of
inflation.
31. Retirees on fixed pensions, creditors, and those whose
incomes are tied to long-term contracts can be hurt by
C H A P T E R 2 1
Introduction to Macroeconomics: Unemployment, Inflation, and Economic Fluctuations
589
95469_21_Ch21_p561-602.qxd 4/1/07 3:31 PM Page 589

590
M O D U L E 6
Macroeconomic Foundations
inflation because inflation
the pur-
chasing power of the money they receive.
32. The
that inflation creates can dis-
courage investment and economic growth.
33. Inflation can
one nation’s price
level relative to price levels in other countries, which
can lead to difficulties in financing the purchase of
foreign goods or to a decline in the value of the
national currency relative to that of other countries.
34. In periods of high and variable inflation, households
and firms have a difficult time distinguishing changes
in
prices from changes in the gen-
eral price level, distorting the information that flows
from price signals.
35.
costs are the costs of changing
posted prices.
36.
costs are the costs of checking on
your assets.
37. The real interest rate equals the
interest rate minus the
rate.
38. In most economic decisions, it is the
rate of interest that matters,
because it shows how much borrowers pay and
lenders receive in terms of purchasing power.
39. The
the interest rate, the greater
the quantity of funds people will demand, ceteris
paribus; the
the interest rate, the
greater the quantity of loanable funds supplied, ceteris
paribus.
40. When creditors start expecting future inflation, there
will be a(n)
shift in the supply
curve of loanable funds. Likewise, demanders of
funds (borrowers) are more anxious to borrow
because they think they will pay their loans back in
dollars of lesser purchasing power than the dollars
they borrowed. Thus, the demand for funds increases.
41. If the inflation rate is
anticipated,
new creditors do not lose, nor do debtors gain, from
inflation.
42. Groups try to protect themselves from inflation by
using
clauses in contracts.
43. The tendency is for nominal interest rates and
inflation rates to move in the
direction.
44. Business cycles refer to the
fluctuations in economic activity, not to the
trend in output.
45. A business cycle has four phases:
,
, ,
and
.
46. Expansion occurs when output is
significantly, unemployment is
,
and both consumer and business confidence are
.
47. The
is when an expansion comes
to an end, that is, when output is at the highest point
in the business cycle; while the
is
the point in time when output stops declining, that is,
when business activity is at its lowest point in the
business cycle.
48. Seasonally adjusted unemployment rates in
summer months are
actual
unemployment rates because unemployment is
normally
in summertime as a
result of the inflow of school-age workers into the
labor force.
49. It can be in the best interest of the incumbent to
stimulate the economy in the period leading up to
a(n) .
50. Businesses, government agencies, and, to a lesser extent,
consumers rely on economic
to
learn of forthcoming developments in the business
cycles.
51. If the index of
increases sharply
for two or three months, it is likely (but not certain)
that increases in the overall level of activity will
follow.
52. Even though the leading economic indicators
do provide a warning of a likely downturn,
they do not provide accurate information on the
or of
the
downturn.
A
nswers: 1.
high; stable; high
2.Employment Act of 1946
3.output
4.unemployed; the civilian labor force
5.employed; unemployed
6.Discouraged; labor force
7.over
8.losers; leavers; reentrants; new entrants
9.Job losers
10.inflation
11.mismatches
12.high; low
13.labor force participation
14.short; normal
15.greater
16.lower
17.Structural
18.Cyclical
19.aggregate demand
20.structural
21.frictional; structural
22.natural
23.frictional; structural
24.technological, demographic; institutional
25.potential
26.greater
27.temporarily
28.coordinating
29.high
30.consumer price index
31.erodes
32.uncertainty
33.raise
34.relative
35.Menu
36.Shoe-leather
37.nominal; inflation
38.real
39.lower; higher
40.leftward
41.accurately
42.cost-of-living
43.same
44.short-term; long-term
45.expansion; peak; contraction; trough
46.rising; falling; high
47.peak; trough
48.below; high
49.election
50.forecasts
51.leading indicators
52.depth; duration
95469_21_Ch21_p561-602.qxd 4/1/07 3:31 PM Page 590

C H A P T E R 2 1
Introduction to Macroeconomics: Unemployment, Inflation, and Economic Fluctuations
591
real gross domestic product
(RGDP) 564
Employment Act of 1946 564
unemployment rate 565
labor force 565
discouraged worker 566
job loser 567
job leaver 568
reentrant 568
new entrant 568
underemployment 568
labor force participation rate 569
frictional unemployment 571
structural unemployment 572
cyclical unemployment 573
natural rate of unemployment 573
potential output 573
minimum wage rate 575
efficiency wage model 576
price level 578
inflation 579
deflation 579
consumer price index (CPI) 579
hyperinflation 580
relative price 580
menu costs 581
shoe-leather cost 581
nominal interest rate 581
real interest rate 581
wage and price controls 584
business cycles 585
expansion 585
peak 585
contraction 585
trough 586
recession 586
depression 586
boom 586
leading economic indicators 588
K e y Te r m s a n d C o n c e p t s
S e c t i o n C h e c k A n s w e r s
21.1 Macroeconomic Goals
1. What are the three major economic goals of most
societies?
The three major economic goals of most societies are
maintaining employment at high levels, so that jobs
are relatively plentiful and financial suffering from
lack of income is relatively uncommon, price stability,
so consumers and producers can make better deci-
sions, and achieving a high rate of economic growth,
so output, and therefore income and consumption,
increases over time.
2. What is the Employment Act of 1946? Why was it
significant?
The Employment Act of 1946 was a law that committed
the federal government to policies designed to reduce
unemployment in a manner consistent with price stabil-
ity. It was significant as the first formal government
acknowledgment of these primary macroeconomic goals.
21.2 Employment and Unemployment
1. What happens to the unemployment rate when the
number of unemployed people increases, ceteris paribus?
When the labor force grows, ceteris paribus?
The unemployment rate is defined as the number of
people officially unemployed divided by the labor
force. Therefore, the unemployment rate rises as the
number of unemployed people increases and it falls
when the labor force grows, ceteris paribus.
2. How might the official unemployment rate understate the
“true” degree of unemployment? How might it overstate it?
The official unemployment rate understates the “true”
degree of unemployment by not including discouraged
workers as unemployed, by counting part-time work-
ers who cannot find full-time jobs as “fully”
employed, and by counting those employed in jobs
that underutilize worker skills as “fully” employed. It
overstates the “true” degree of unemployment by not
counting those working overtime or multiple jobs as
“overemployed,” by counting those employed in the
underground economy as unemployed, and by includ-
ing those just “going through the motions” of job
search to maintain unemployment benefits or other
government benefits as unemployed.
3. Why might the fraction of the unemployed who are job
leavers be higher in a period of strong labor demand?
In a period of strong labor demand, people would be
more confident of their ability to find other jobs, and
therefore they would be more likely to leave (quit)
their current jobs.
4. Suppose you live in a community of 100 people. If 80
people are over 16 years old and 72 people are willing
and able to work, what is the unemployment rate in this
community?
The unemployment rate in this community is the
number unemployed (8) divided by the labor force
(80), or 10 percent.
5. What would happen to the unemployment rate if a substan-
tial group of unemployed people started going to school full
time? What would happen to the size of the labor force?
Full-time students are not considered part of the
labor force, so the labor force, the number officially
unemployed, and the unemployment rate would all
fall if a substantial group of unemployed people
became full-time students.
95469_21_Ch21_p561-602.qxd 4/1/07 3:31 PM Page 591

592
M O D U L E 6
Macroeconomic Foundations
6. What happens to the unemployment rate when officially
unemployed people become discouraged workers? Does
anything happen to employment in this case?
When officially unemployed workers become dis-
couraged workers, they stop seeking jobs and are no
longer counted as either part of the labor force or as
unemployed, reducing the unemployment rate.
However, since they do not find jobs, there is no
effect on employment as a result.
21.3 Types of Unemployment
1. Why do we want some frictional unemployment?
We want some frictional unemployment because we
want human resources employed in areas of higher
productivity, and some period of job search (frictional
unemployment), rather than taking the first job
offered, can allow workers to find more productive
employment.
2. Why might a job retraining program be a more useful
policy to address structural unemployment than to
address frictional unemployment?
Structural unemployment reflects people who lack the
necessary skills for the jobs available, rather than a
temporary period of search between jobs. A job
retraining program to develop skills to match the jobs
available addresses such structural unemployment,
not frictional unemployment.
3. What is the traditional government policy “cure” for
cyclical unemployment?
The traditional government policy “cure” for cyclical
unemployment is to adopt policies designed to
increase aggregate demand for goods and services.
4. What types of unemployment are present at full employ-
ment (at the natural rate of unemployment)?
At full employment (at the natural rate of unemploy-
ment), both frictional and structural unemployment,
but not cyclical unemployment, are present.
5. Why might frictional unemployment be higher in a
period of plentiful jobs (low unemployment)?
In a period of plentiful jobs, frictional unemployment
can be higher because job opportunities are plentiful,
which stimulates mobility between jobs, which, in
turn, increases frictional unemployment.
6. If the widespread introduction of the automobile
caused a productive buggy whip maker to lose his
job, would he be structurally unemployed?
If the buggy whip maker’s skills were not in demand
in other industries and they learned no new transfer-
able skills from the old job, this would result in struc-
tural unemployment.
7. If a fall in demand for domestic cars causes auto
workers to lose their jobs in Michigan, while plenty of
jobs are available for lumberjacks in Montana, what
kind of unemployment results?
This would be an example of structural unemploy-
ment, resulting from skills mismatched to the jobs
available.
21.4 Reasons for Unemployment
1. What are the three reasons for wages to fail to bal-
ance labor supply and labor demand?
Minimum wages, unions, and efficiency wages can
each lead to a failure to balance labor supply and
demand, by leading to wages for some workers that
are above their opportunity costs, and increasing
unemployment.
2. What is an efficiency wage?
An efficiency wage is a wage that is greater than
the equilibrium wage. Its intent is to reduce the
costs of turnover, absenteeism and shirking, and
increase worker quality and morale, thereby
increasing productivity and reducing costs. If the
increased productivity and reduced costs that result
outweigh the higher wage costs, producers’ profits
will rise.
3. How do search costs lead to prolonged periods of
unemployment?
Because employers offer different jobs, compensation
packages, and working conditions, and workers
differ in skills and preferences, matching up workers
to appropriate jobs requires a great deal of informa-
tion. The search for this information entails fric-
tional unemployment, which can also be thought
of as employment in gathering information, which,
in some cases, can lead to prolonged periods of
unemployment.
4. Why would higher unemployment compensation
in a country like France lead to higher rates of
unemployment?
Unemployment insurance lowers the opportunity cost
to a worker from being unemployed, increasing the
duration of unemployment and the unemployment rate.
Higher unemployment insurance payments will
decrease the opportunity cost of remaining unem-
ployed, tending to induce the duration of unemploy-
ment and raise the unemployment rate.
5. Does new technology increase unemployment?
New technology can increase unemployment among
those whose skills are replaced by that technology.
However, it also creates new jobs manufacturing,
servicing, and repairing the new equipment, and, by
lowering costs, new technology frees up more income
to demand other goods and services, creating jobs in
those industries.
95469_21_Ch21_p561-602.qxd 4/1/07 3:31 PM Page 592

C H A P T E R 2 1
Introduction to Macroeconomics: Unemployment, Inflation, and Economic Fluctuations
593
21.5 Inflation
1. How does price level stability reduce the difficulties
buyers and sellers have in coordinating their plans?
Price level instability increases the difficulties buyers
and sellers have in coordinating their plans by reduc-
ing their certainty about what price changes mean—do
they reflect changes in relative prices or changes in
inflation? Eliminating this uncertainty makes the
meaning of price changes clearer, allowing buyers and
sellers to better co-ordinate their plans through the
price system. High and variable rates of inflation also
interact with the tax code in ways which distort incen-
tives and lead people to invest resources trying to pro-
tect themselves against inflation rather than in socially
productive activities.
2. What will happen to the nominal interest rate if the
real interest rate rises,
ceteris paribus
? What if infla-
tion increases,
ceteris paribus
?
The real interest rate is the nominal interest rate
minus the inflation rate. Alternatively, the nominal
interest rate is the sum of the desired real interest rate
and the expected inflation rate. If either the real inter-
est rate or the rate of inflation increases, nominal
interest rates will also increase.
3. Say you owe money to Big River Bank. Will you gain
or lose from an unanticipated decrease in inflation?
An unanticipated decrease in inflation will mean that
the dollars you must pay back on your loan will be
worth more than you expected, raising the real inter-
est rate you must pay on that loan, which makes you
worse off.
4. How does a variable interest rate loan “insure” the
lender against unanticipated increases in inflation?
With a variable interest rate loan, an unanticipated
increase in inflation does not reduce the real interest
rate received by the lender, but instead increases the
nominal interest rate on the loan to compensate for
the increased inflation.
5. Why will neither creditors nor debtors lose from infla-
tion if it is correctly anticipated?
Correctly anticipated inflation will be accurately
reflected in the terms creditors and debtors agree to, so
that neither will lose from inflation. Only unexpected
rates of inflation can redistribute wealth between
debtors and creditors.
6. How could inflation make people turn to exchange by
barter?
If inflation is very rapid, people lose faith in the value
of their monetary unit, and this can lead to exchange
by barter, because goods can then have a more pre-
dictable value than their country’s money.
21.6 Economic Fluctuations
1. Why would you expect unemployment to fall during
an economy’s expansionary phase and to rise during a
contractionary phase?
Output increases during an economy’s expansion
phase. To produce that increased output in the short
term requires more workers, which increases employ-
ment and reduces the unemployment rate, other
things equal.
2. Why might a politician want to stimulate the econ-
omy prior to a reelection bid?
A politician may want to stimulate the economy prior
to a reelection bid because there is a strong correla-
tion between the performance of the economy and the
fate of an incumbent’s bid for reelection.
3. Why is the output of investment goods and durable
consumer goods more sensitive to the business cycle
than that of most goods?
When output is growing and business confidence is
high, investment rises sharply because it appears highly
profitable; when incomes and consumer confidence are
high, durable goods, whose purchases are often delayed
in less prosperous times, rise sharply in demand. In
recessions, investment and consumer durables pur-
chases fall sharply, as such projects no longer appear
profitable, and plans are put on hold until better times.
4. Why might the unemployment rate fall after output
starts recovering during the expansion phase of the
business cycle?
Often unemployment remains fairly high well into the
expansion phase, because it takes a period of recovery
before businesses become convinced that the increas-
ing demand for their output is going to continue,
making it profitable to hire added workers.
95469_21_Ch21_p561-602.qxd 4/1/07 3:31 PM Page 593

95469_21_Ch21_p561-602.qxd 4/1/07 3:31 PM Page 594

True or False
1. Economic growth means a growth in real, per capita total output over time.
2. Individuals, because they may differ considerably in their evaluation of the relative importance of certain issues, may
disagree about whether certain so-called problems are really problems after all.
3. Economic growth is considered to be positive by all individuals.
4. Other things being equal, relatively high rates of unemployment are almost universally viewed as bad.
5. The unemployment rate is the number of people officially unemployed divided by a country’s population aged 16
or over.
6. The civilian labor force figure excludes those in the armed services, prison, and mental hospitals, as well homemak-
ers, retirees, and full-time students because they are not considered currently available for employment.
7. By far, the worst employment downturn in U.S. history was the Great Depression.
8. Before 1960, variations in unemployment tended to be more pronounced than since 1960.
9. Discouraged workers, who have not actively sought work for four weeks, are counted as unemployed.
10. People looking for full-time work who grudgingly settle for a part-time job are counted as employed, even though
they are only “partly” employed.
11. Some people working in the underground economy may be counted in labor statistics as unemployed, while others
may be counted as not in the labor force.
12. Unemployment rates are usually similar across different segments of the population, but they vary substantially
over time.
13. In the short run, a reduction in unemployment may come at the expense of a higher rate of inflation.
14. The duration of unemployment tends to be greater when the amount of unemployment is low and smaller when the
amount of unemployment is high.
15. Unemployment means a loss of potential output.
16. When the baby-boom generation began entering the labor force, it raised the labor force participation rate.
17. Frictional unemployment results from persons being temporarily between jobs.
18. Frictional unemployment, while not good in itself, is a by-product of a healthy phenomenon; and because it is short
lived, it is not generally viewed as a serious problem.
19. Structural employment can arise because jobs that require particular skills disappear.
20. Structural unemployment is easily measured and stable over time.
21. Cyclical unemployment may result from an insufficient level of demand for goods and services.
22. Given the volatility and dimensions of unemployment, governments view it as the result of inadequate demand, which
is especially correctable through government policies.
23. The natural rate of unemployment roughly equals the sum of frictional and cyclical unemployment when they are at a
maximum.
24. When unemployment rises above the natural rate, it reflects the existence of cyclical unemployment.
25. The natural rate of unemployment does not change over time.
26. At the natural rate of unemployment, the economy is producing its potential output.
27. When the economy is experiencing cyclical unemployment, the unemployment rate is less than the natural rate.
28. In both inflation and deflation, a country’s unit of currency changes in purchasing power.
29. Unanticipated and sharp price changes are almost universally considered to be a “bad” thing that needs to be reme-
died by some policy.
30. Debtors lose from inflation.
31. Wage earners will lose from inflation if wages rise at a slower rate than the price level.
32. Uncertainty about inflation can increase long-term interest rates by adding an inflation risk premium.
C
H A P T E R
2 1
S T U D Y
G U I D E
595
95469_21_Ch21_p561-602.qxd 4/1/07 3:31 PM Page 595

33. Inflation brings about changes in real incomes of persons.
34. Menu costs and shoe-leather costs are modest, regardless of the rate of inflation.
35. The real interest rate equals the nominal interest rate plus the inflation rate.
36. When the inflation rate exceeds the nominal interest rate, real interest rates are negative.
37. As long as nominal interest rates cannot be negative, real interest rates cannot be negative.
38. If people correctly anticipate inflation, they will behave in a manner that will largely protect them against loss.
39. When people start expecting future inflation, creditors become less willing to lend funds at any given interest rate
because they fear they will be repaid in dollars of lesser value than those they loaned.
40. When borrowers of funds start expecting future inflation, the demand for funds decreases.
41. When both suppliers and demanders of funds begin to expect inflation, it will push up the interest rate to a new,
higher equilibrium level.
42. In periods of high unexpected inflation, the nominal interest rate can be high while the real interest rate is low or
even negative.
43. In a growing economy, real GDP will tend to rise from one business cycle peak to the next.
44. In an expansion, investment is rising, but expenditures for expensive durable consumer goods are falling.
45. A contraction is a period of falling real output and is usually accompanied by rising unemployment and declining
business and consumer confidence.
46. Unemployment falls substantially as soon as the economy enters the expansion phase of the business cycle.
47. The lengths of business cycles are not uniform.
48. The performance of the economy and the fate of an incumbent’s bid for reelection show a strong correlation.
49. Econometric forecasts are generally highly accurate.
50. Since the development of the index of leading economic indicators, it has never failed to give some warning of an
economic downturn.
51. The lead time between a change in the index of economic indicators and changes in business conditions has varied
widely.
Multiple Choice
1. Which is not one of society’s major economic goals?
a. maintaining employment at high levels
b. maintaining prices at a stable level
c. maintaining a high rate of economic growth
d. All of the above are major economic goals of society.
2. The three major macroeconomic goals of nearly every society are
a. maintaining stable prices, reducing interest rates, and achieving a high rate of economic growth.
b. maintaining high levels of employment, increasing the supply of money, and achieving a high rate of economic growth.
c. maintaining stable prices, maintaining high levels of employment, and achieving high rates of economic growth.
d. achieving high rates of economic growth, reducing unemployment, and reducing interest rates.
3. With regard to macroeconomic goals, which is not true?
a. Individuals differ considerably in their evaluation of the relative importance of certain issues.
b. Individuals disagree on whether certain “problems” are really problems.
c. Virtually everyone views economic growth positively.
d. Some individuals disagree about the appropriate distribution of income.
e. All of the above are true.
4. Economic growth is measured by changes in
a. nominal GDP.
b. the money supply.
596
95469_21_Ch21_p561-602.qxd 4/1/07 3:32 PM Page 596

c. real GDP per capita.
d. the rate of unemployment.
e. none of the above.
5. High rates of unemployment
a. can lead to increased tensions and despair.
b. result in the loss of some potential output in society.
c. reduce the possible level of consumption in society.
d. represent a loss of efficiency in society.
e. All of the above are true.
6. The unemployment rate is the number of people officially unemployed divided by
a. the civilian labor force.
b. the noninstitutional population.
c. the total population.
d. the number of people employed.
e. none of the above.
7. The labor force consists of
a. discouraged workers, employed workers, and those actively seeking work.
b. all persons over the age of 16 who are working or actively seeking work.
c. all persons over the age of 16 who are able to work.
d. all persons over the age of 16 who are working, plus those not working.
e. discouraged workers, part-time workers, and full-time workers.
8. The civilian labor force includes which of the following groups?
a. those in the armed forces
b. those who are currently working part time
c. full-time students
d. retirees
e. all of the above
9. Discouraged workers
a. are considered unemployed.
b. are considered as not in the labor force.
c. are considered as in the labor force.
d. are considered as both unemployed and in the labor force.
e. are considered as unemployed but not in the labor force.
10. Which of these groups tends to have the lowest unemployment rate?
a. teenagers
b. those with some college education
c. college graduates
d. those with a high school diploma but no college experience
11. The largest fraction of those counted as unemployed is due to
a. job losers.
b. job leavers.
c. new entrants.
d. reentrants.
12. In Littletown, the population includes 1,000 people over the age of 16; 800 are in the labor force, and 600 are
employed. The unemployment rate is
a. 33 percent.
b. 25 percent.
c. 20 percent.
597
95469_21_Ch21_p561-602.qxd 4/1/07 3:32 PM Page 597

d. 75 percent.
e. none of the above.
13. The official unemployment rate may overstate the extent of unemployment because
a. it excludes discouraged workers.
b. it counts part-time workers as fully employed.
c. it does not count those with jobs in the underground economy as employed.
d. it includes those who claim to be looking for work as unemployed, even if they are just going through the
motions in order to get government benefits.
e. of both c and d.
14. The unemployment rate may underestimate the true extent of unemployment if
a. employees increase the number of hours they work overtime.
b. many people become discouraged and cease looking for work.
c. a large number of people are working in the underground economy.
d. any of the above occur.
15. If unemployment benefits increase, leading more people to claim to be seeking work when they are not really seeking
work, the measured unemployment rate will
a. rise.
b. fall.
c. be unaffected.
d. change in an indeterminate direction.
16. After looking for a job for more than eight months, Kyle became frustrated and stopped looking. Economists
view Kyle as
a. unemployed.
b. part of the labor force, but neither employed nor unemployed.
c. a discouraged worker.
d. cyclically unemployed.
e. both b and c.
17. Persons who do not have jobs and who do not look for work are considered
a. unemployed.
b. out of the labor force.
c. underemployed.
d. overemployed.
e. part of the underground economy.
18. If the unemployment rate is 6 percent and the number of persons unemployed is 6 million, the number of people
employed is equal to
a. 100 million.
b. 94 million.
c. 106 million.
d. 6 million.
e. none of the above.
19. According to the Bureau of Labor Statistics, the four main categories of unemployed workers are
a. discouraged workers, part-time workers, the cyclically unemployed, and the frictionally unemployed.
b. discouraged workers, job losers, new entrants, and the underemployed.
c. new entrants, job losers, job leavers, and reentrants.
d. job losers, job leavers, the structurally unemployed, and the frictionally unemployed.
20. Frictional unemployment is
a. unemployment that is due to normal turnover in the labor market.
b. unemployment caused by automation in the workplace.
598
95469_21_Ch21_p561-602.qxd 4/1/07 3:33 PM Page 598

c. unemployment caused by lack of training and education.
d. unemployment that is due to the friction of competing ideological systems.
e. all of the above.
21. Unemployment caused by a contraction in the economy is called
a. frictional unemployment.
b. cyclical unemployment.
c. structural unemployment.
d. seasonal unemployment.
22. A federal program aimed at retraining the unemployed workers of the declining auto and steel industries is designed
to reduce which type of unemployment?
a. seasonal
b. cyclical
c. structural
d. frictional
23. When unemployment rises above the natural rate, it reflects the existence of ___________________ unemployment.
a. frictional
b. structural
c. seasonal
d. cyclical
24. When an economy is operating at full employment,
a. the unemployment rate will equal zero.
b. frictional unemployment will equal zero.
c. cyclical unemployment will equal zero.
d. structural unemployment will equal zero.
e. both b and d are correct.
25. The natural rate of unemployment would increase when which of the following increases?
a. frictional unemployment
b. structural unemployment
c. cyclical unemployment
d. any of the above
e. either frictional or structural unemployment
26. If a nation’s labor force receives a significant influx of young workers,
a. the natural rate of unemployment is likely to increase.
b. the natural rate of unemployment is likely to decrease.
c. the natural rate of unemployment is unlikely to change.
d. frictional unemployment will likely decrease to zero.
27. Which of the following is false?
a. At the natural rate of unemployment, the economy is considered to be at full employment.
b. At full employment, the economy is producing at its potential output.
c. If unemployment is greater than its natural rate, the economy is producing at greater than its potential
output.
d. If we are at less than full employment, some cyclical unemployment exists.
28. When would consumers and producers experience increased difficulty in coordinating their plans
and decisions?
a. in a period of inflation
b. in a period of deflation
c. in a period of either inflation or deflation
d. none of the above
599
95469_21_Ch21_p561-602.qxd 4/1/07 3:33 PM Page 599

29. Inflation can harm
a. retirees on fixed pensions.
b. borrowers who have long-term fixed interest rate loans.
c. wage earners whose incomes grow slower than inflation.
d. either a or c.
e. all of the above.
30. Inflation will be least harmful if
a. interest rates are not adjusted accordingly when inflation occurs.
b. worker wages are set by long-term contracts.
c. it is correctly anticipated and interest rates adjust accordingly.
d. it is not fully anticipated.
31. Unexpected inflation generally benefits
a. lenders.
b. borrowers.
c. the poor.
d. people on fixed incomes.
32. The costs of inflation include
a. menu costs.
b. shoe-leather costs.
c. a distortion of price signals.
d. all of the above.
33. If the nominal interest rate is 9 percent and the inflation rate is 3 percent, the real interest rate is
a. 3 percent.
b. 6 percent.
c. 9 percent.
d. 12 percent.
e. 27 percent.
34. What is the real interest rate paid on a loan bearing 7 percent nominal interest per year if the inflation rate is
6 percent?
a. 13 percent
b. 7 percent
c. 6 percent
d. 1 percent
35. If people correctly anticipate inflation, it will
a. benefit borrowers.
b. benefit lenders.
c. benefit neither borrowers nor lenders.
d. harm both borrowers and lenders.
36. An increase in the expected future rate of inflation will lead to
a. an increase in the supply of funds.
b. a decrease in the supply of funds.
c. an increase in the demand for funds.
d. a decrease in the demand for funds.
e. both b and d.
37. A business cycle reflects changes in economic activity, particularly real GDP. The stages of a business cycle in
order are
a. expansion, peak, contraction, and trough.
b. expansion, trough, contraction, and peak.
600
95469_21_Ch21_p561-602.qxd 4/1/07 3:34 PM Page 600

c. contraction, recession, expansion, and boom.
d. trough, expansion, contraction, and peak.
38. In the contraction phase of the business cycle,
a. output is rising.
b. unemployment is falling.
c. consumer and business confidence are high.
d. investment is rising.
e. none of the above is true.
39. The contractionary phase of the business cycle is characterized by
a. reduced output and increased unemployment.
b. reduced output and reduced unemployment.
c. increased output and increased unemployment.
d. increased output and reduced unemployment.
Problems
1. Answer the following questions about unemployment:
a. If a country has a noninstitutional population of 200 million and a labor force of 160 million, and 140 million
people were employed, what is its labor force participation rate and its unemployment rate?
b. If 10 million new jobs were created in the country, and it attracted 20 million of the people previously not in
the labor force into the labor force, what would the new labor force participation rate and new unemployment
rate be?
c. Beginning with the situation in part (a), if 10 million unemployed people became discouraged and stopped looking
for work, what would the new labor force participation rate and new unemployment rate be?
d. Beginning with the situation in part (a), if 10 million current workers retired but their jobs were filled by others
still in the labor force, what would the new labor force participation rate and new unemployment rate be?
2. Which of the following individuals would economists consider unemployed?
a. Sam looked for work for several weeks but has now given up his search and is going back to college.
b. A 14-year-old wants to mow lawns for extra cash but is unable to find neighbors willing to hire her.
c. A factory worker is temporarily laid off but expects to be called back to work soon.
d. A receptionist, who works only 20 hours per week, would like to work 40 hours per week.
e. A high school graduate is spending the summer backpacking across the country rather than seeking work.
3. Identify whether each of the following reflects seasonal, structural, frictional, or cyclical unemployment.
a. A sales employee is laid off due to slow business after consumer spending falls.
b. An automotive worker is replaced by robotic equipment on the assembly line.
c. A salesperson quits a job in California and seeks a new sales position after moving to New York.
d. An employee is fired due to poor job performance and searches the want ads each day for work.
4. Answer the following questions about reasons for unemployment:
a. In a severe recession, what would tend to happen to the number of people in each of the following
categories?
job losers
reentrants
job leavers
new entrants
b. In good economic times, why might the number of job leavers, reentrants, and new entrants all increase?
5. Unemployment benefits in many European countries tend to be both more generous and available for longer periods
than those in the United States. What impact do you think this is likely to have on the unemployment rate in a
European country? Why?
6. How can unions result in higher unemployment rates? How would the results differ for someone who wants to be
employed in the union sector as compared with someone who currently has a job in the union sector?
601
95469_21_Ch21_p561-602.qxd 4/1/07 3:34 PM Page 601

7. Answer the following questions about inflation:
a. What would be the effect of unexpected inflation on each of the following?
retirees on fixed incomes
creditors
workers
shoe-leather costs
debtors
menu costs
b. How would your answers change if the inflation was expected?
8. Answer the following questions about the nominal and real interest rates:
a. What would be the real interest rate if the nominal interest rate were 14 percent and the inflation rate were
10 percent? If the nominal interest rate were 8 percent and the inflation rate were 1 percent?
b. What would happen to the real interest rate if the nominal interest rate went from 9 percent to 15 percent when
the inflation rate went from 3 percent to 10 percent? If the nominal interest rate went from 11 percent to 7 per-
cent when the inflation rate went from 8 percent to 4 percent?
9. You borrow money at a fixed rate of interest to finance your college education. If the rate of inflation unexpectedly
slows down between the time you take out the loan and the time you begin paying it back, is there a redistribution of
income? Do you gain or lose? What if you already expected the inflation rate to slow at the time you took out the
loan? Explain.
10. How does an adjustable rate mortgage agreement protect lenders against inflation? Who bears the inflation risk?
11. In 2000, a proposal was made in Santa Monica, California, to raise the minimum wage in the hotel and shopping dis-
trict to a “living” wage of $10.69 per hour. Predict the effect of such legislation on unemployment in the hotel and
shopping industries in Santa Monica. What would you expect to happen to the unemployment rate in neighboring
areas?
602
95469_21_Ch21_p561-602.qxd 4/1/07 3:34 PM Page 602
Wyszukiwarka
Podobne podstrony:
Exploring Economics 4e Chapter 09
Exploring Economics 4e Chapter 18
Exploring Economics 4e Chapter 30
Exploring Economics 4e Chapter 07
Exploring Economics 4e Chapter 11
Exploring Economics 4e Chapter 22
Exploring Economics 4e Chapter 17
Exploring Economics 4e Chapter 13
Exploring Economics 4e Chapter 10
Exploring Economics 4e Chapter 14
Exploring Economics 4e Chapter 27
Exploring Economics 4e Chapter 25
Exploring Economics 4e Chapter 29
Exploring Economics 4e Chapter 15
Exploring Economics 3e Chapter 21
Exploring Economics 4e Chapter 23
Exploring Economics 4e Chapter 31
Exploring Economics 4e Chapter 26
Exploring Economics 4e Chapter 24
więcej podobnych podstron