
22
C H A P T E R
M
E A S U R I N G A
N
A T I O N
’
S
P
R O D U C T I O N
, I
N C O M E
,
A N D
S
P E N D I N G
he desire to measure the success, or perform-
ance, of our national economy is significant.
Is it getting “bigger” (and, we hope, better)
or “smaller” (and worse) over time? Aside
from intellectual curiosity, the need to evaluate the
magnitude of the country’s economic performance
is important to macroeconomic policymakers, who
want to know how well the economy is performing
so that they can set goals and develop policy
recommendations.
Measurement of the economy’s perform-
ance is also important to private businesses
because inaccurate measurement can lead to
bad decision making. Traders in stocks and
bonds are continually checking economic
statistics—buying and selling in response to the
latest economic data.
To fulfill the
need for a reliable
method of measuring
economic perform-
ance, national income
accounting was born
early in the twentieth
century. The establishment of a uniform means of
accounting for economic performance was such an
important accomplishment that one of the first
Nobel prizes in economics was given to the late
Simon Kuznets, a pioneer of national income
accounting in the United States.
Several measures of aggregate national income
and output have been developed, the most impor-
tant of which is gross domestic product (GDP). We
will examine GDP and other indicators of national
economic performance in detail in this chapter.
■
T
M
E A S U R I N G A
N
A T I O N
’
S
P
R O D U C T I O N
, I
N C O M E
,
A N D
S
P E N D I N G
22.1
National Income Accounting:
A Standardized Way to Measure
Economic Performance
22.2
Measuring Total Production
22.3
Other Measures of Total Production and
Total Income
22.4
Problems in Calculating an Accurate GDP
22.5
Problems with GDP as a Measure of
Economic Welfare
national income
accounting
a uniform means of measuring eco-
nomic performance
95469_22_Ch22_p603-632.qxd 4/1/07 3:39 PM Page 603

604
M O D U L E 6
Macroeconomic Foundations
WHAT IS GROSS DOMESTIC PRODUCT?
The measure of aggregate economic performance
that gets the most attention in the popular media is
gross domestic product (GDP),
which is defined
as the value of all final goods and services produced
within a country during
a given period. By con-
vention, that period is
almost always one year.
But let’s examine the
rest of this definition.
What is meant by “final
good or service” and
“value”?
Measuring the Value of Goods and Services
Value is determined by the market prices at which
goods and services sell. Underlying the calculations,
then, are the various equilibrium prices and quantities
for the multitude of goods and services produced.
What Is a Final Good or Service?
The word final means that the good is ready for its
designated ultimate use. Many goods and services are
intermediate goods or services—that is, used in the pro-
duction of other goods. For example, suppose U.S. Steel
Corporation produces some steel that it sells to General
Motors Corporation for
use in making an auto-
mobile. If we counted
the value of steel used in
making the car as well
as the full value of the
finished auto in the
GDP, we would be
engaging in
double
counting
—adding the value of the steel in twice, first in
its raw form and second in its final form, the automobile.
PRODUCTION, INCOME, AND
THE CIRCULAR FLOW MODEL
When we calculate GDP in the economy, we are
measuring the value of total production—our total
expenditures, C
I G (X M). However, we
are also measuring the value of total income. Why? It
is because every dollar of spending by some buyer
ends up being a dollar of income for some seller. In
short, expenditures (spending) must equal income.
And this is true whether it is a household, firm, or the
government that buys the good or service. The main
point is that when we spend (the value of total expen-
diture) it ends up as someone’s income (the value of
total income). Buyers have sellers.
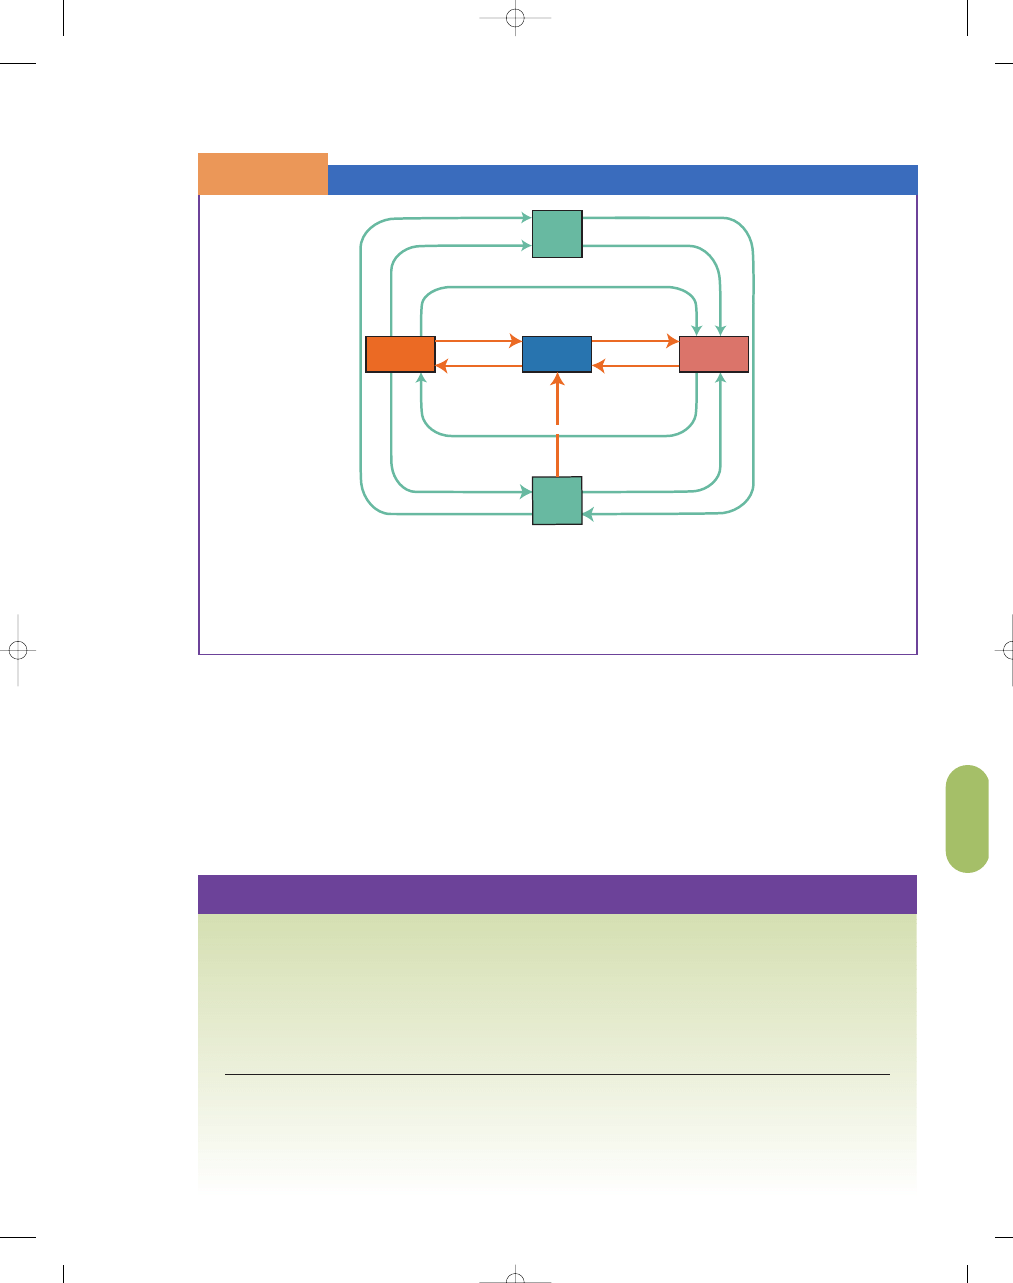
In Exhibit 1, we reintroduce the circular flow
model to show the flow of money in the economy. For
example, households use some of their income to buy
domestic goods and services and some to buy foreign
goods and services (imports). Households also use some
of their income to pay taxes and invest in financial mar-
kets (stocks, bonds, saving accounts, and other financial
assets). When income flows into the financial system as
saving, it makes it possible for consumers, firms, and
government to borrow. This market for saving and bor-
rowing is vital to a well-functioning economy.
gross domestic
product (GDP)
the measure of economic perform-
ance based on the value of all final
goods and services produced within
a country during a given period
The paper used in a book is an intermediate good; it is
the book, the final good, that is included in the GDP.
©
Photodisc Green/Getty Images
double counting
adding the value of a good or service
twice by mistakenly counting the
intermediate goods and services
in GDP
S E C T I O N
22.1
N a t i o n a l I n c o m e A c c o u n t i n g :
A S t a n d a r d i z e d W a y t o M e a s u r e
E c o n o m i c P e r f o r m a n c e
■
What is gross domestic product?
■
Why must expenditures equal income?
95469_22_Ch22_p603-632.qxd 5/1/07 2:34 PM Page 604
C H A P T E R 2 2
Measuring a Nation’s Production, Income, and Spending
605
S E C T I O N
*
C H E C K
1.
We measure our economy’s status in order to see how its performance has changed over time. These economic
measurements are important to government officials, private businesses, and investors.
2.
National income accounting, pioneered by Simon Kuznets, provides a uniform means of measuring national
economic performance.
3.
Gross domestic product (GDP) is the value of all final goods and services produced within a country during a given
time period.
4.
When we spend (the value of total expenditure) it ends up as someone’s income (the value of total income). Buyers
have sellers.
1.
Why does GDP measure only final goods and services produced, rather than all goods and services produced?
2.
Why aren’t all of the expenditures on used goods in an economy included in current GDP?
3.
Why do GDP statistics include real estate agents’ commissions from selling existing homes and used car dealers’
profits from selling used cars, but not the value of existing homes or used cars when they are sold?
4.
Why are sales of previously existing inventories of hula hoops not included in the current year’s GDP?
In the circular flow model of income and expenditures, we can measure GDP either by calculating the total value of
expenditures or the total value of aggregate income because for the economy as a whole expenditures must equal
income. GDP equals the total amount spent by households in the market—to buy goods and services, to pay taxes
and save. To produce goods and services, the firm uses the factors of production (labor, land, capital, and entrepre-
neurship), and it pays these factors wages, rent, interest, and profit. These payments are total income, which is also
equal to GDP. The government and firms borrow the funds that flow into the financial system from households.
The Expanded Circular Flow Model
S E C T I O N
2 2 .1
E
X H I B I T
1
Borrowing for I
nv
e
s
tment
F
o
reign
L
ending
and
P
u
rchas
es
of
St
ock
sa
nd
Bon
d
s
Expenditures by Foreign H
ou
se
h
o
ld
s
o
n
Domestic Goods and Ser
vic
e
s
(E
x
p
o
rt
s
)
Rest
of
World
Financial
Markets
Households
Government
Purchases of
Goods and Services
Borrowing for
Budget Deficit
Firms
Taxes
Business Taxes
Saving
Expenditures on Goods and Services
Wages, Interest, and
Transfer Payments
For
eign
B
o
rr
o
win
g
and
S
ales
of
Stocks
a
n
d
Bonds
Ex
p
e
n
d
it
ur
e
s
o
n
D
om
estic Households and Imports
Payments of Wages, Rent, Interest, and Profit
Firms sell their goods and services to domestic
and foreign consumers and foreign firms and govern-
ment. Firms use their factors of production (labor,
land, capital, and entrepreneurship) to produce goods
and services. Firms pay wages to workers, interest for
the use of capital, and rent for land. Profits are the
return to entrepreneurs for taking the risk of produc-
ing the goods and services. Wages, rent, interest, and
profit comprise aggregate income in the economy.
Government provides transfer payments such as
Social Security and unemployment insurance pay-
ments. Whether we add up the aggregate expenditure
on final goods and services, C
I G (X M),
or the value of aggregate income (wages, rent, interest,
and profit) we get the same GDP. For an economy as
a whole, expenditures and income are the same.
Actually, while the two should be exactly the same—
there may be a slight variation because of data issues.
95469_22_Ch22_p603-632.qxd 4/1/07 3:39 PM Page 605

606
M O D U L E 6
Macroeconomic Foundations
Amount (billions
Percent of
Category
of current dollars)
GDP
Consumption (C )
$ 9,079
70%
Investment (I )
2,214
17
Government purchases (G)
2,480
19
Net exports of goods and services (X
M)
765
6
Gross domestic product
$13,008
100%
SOURCE: U.S. Bureau of Economic Analysis, Survey of Current Business, August 2006.
GDP: The Expenditure Approach
S E C T I O N
2 2 . 2
E
X H I B I T
1
THE EXPENDITURE APPROACH TO MEASURING GDP
One approach to measuring GDP is the expenditure
approach. With this method, GDP is calculated by
adding how much
market participants
spend on final goods
and services over a
specific period of time.
For convenience and
for analytical pur-
poses, economists usu-
ally group spending
into four categories:
consumption, designated by the letter C; investment, I;
government purchases, G; and net exports, which equals
exports (X) minus imports (M), or X
M. According
to the expenditure method, then,
GDP
C I G (X M)
CONSUMPTION (C )
Consumption refers to the purchase of consumer
goods and services by households. For most of us, a
large percentage of our
income in a given year
goes for consumer
goods and services. The
consumption category
does not include purchases by business or govern-
ment. As Exhibit 1 indicates, in 2006, U.S. consump-
tion expenditures totaled more than $9 trillion
($9,079 billion). This figure was 70 percent of GDP.
In this respect, the 2006 data were fairly typical. In
every year since 1929, when GDP accounts began to
be calculated annually, consumption has been more
than half of total expenditures on goods and services
(even during World War II). Consumption spending,
in turn, is usually broken down into three subcate-
gories: nondurable goods, durable consumer goods,
and services.
What Are Nondurable and Durable Goods?
Nondurable goods
include tangible consumer items
that are typically consumed or used up in a relatively
short period. Food and clothing are examples, as are
such quickly consumable items as drugs, toys, maga-
zines, soap, razor blades,
light bulbs, and so on.
Nearly everything pur-
chased in a supermarket
or drug store is a non-
durable good.
Durable goods
include longer-lived con-
sumer goods, the most
important single category of which is automobiles and
other consumer vehicles. Appliances, stereos, and
expenditure
approach
calculation of GDP by adding the
expenditures by market participants
on final goods and services over a
given period
S E C T I O N
22.2
M e a s u r i n g To t a l P r o d u c t i o n
■
What are the four categories of purchases
included in the expenditure approach?
■
What are durable and nondurable goods?
■
What are fixed investments?
■
What types of government purchases are
included in the expenditure approach?
■
How are net exports calculated?
consumption
purchases of final goods and services
nondurable goods
tangible items consumed in a short
period of time, such as food
durable goods
longer-lived consumer goods, such
as automobiles
95469_22_Ch22_p603-632.qxd 4/1/07 3:39 PM Page 606

C H A P T E R 2 2
Measuring a Nation’s Production, Income, and Spending
607
furniture are also included in the durable goods cate-
gory. On occasion, it is difficult to decide whether a
good is durable or nondurable; the definitions are,
therefore, somewhat arbitrary.
The distinction between durables and nondurables
is important because consumers’ buying behavior is
somewhat different for each of these categories of
goods. In boom periods, when GDP is rising rapidly,
expenditures on durables often increase dramatically,
while in years of stagnant or falling GDP, sales of
durable goods often plummet. By contrast, sales of non-
durables such as food tend to be more stable over time
because purchases of such goods are more difficult to
shift from one period to another. You can “make do”
with your car for another year, but not your lettuce.
What Are Services?
Services
are intangible items of value, as opposed to
physical goods. Education, health care, domestic
housekeeping, profes-
sional football, legal
help, automobile repair,
haircuts, airplane trans-
portation—all these
items are services. In
recent years, U.S. serv-
ice expenditures grew faster than spending on goods;
the share of total consumption of services increased
from 35 percent in 1950 to almost 60 percent by 2003.
As incomes rise, service industries such as health, edu-
cation, financial, and recreation grow dramatically.
INVESTMENT (I)
Investment,
according to economists, refers to the
creation of capital goods—inputs such as machines
and tools whose pur-
pose is to produce other
goods. This definition
of investment differs
from the popular use
of that term. It is
common for people to
say that they have invested in stocks, meaning that they
have traded money for pieces of paper, called stock
certificates, that say they own shares in certain compa-
nies. Such transactions are not investments as defined by
economists (i.e., increases in capital goods), even though
they might provide the enterprises selling the stocks the
resources to buy new capital goods, which would be
counted as investment purchases by economists.
The two categories of investment purchases meas-
ured in the expenditures approach are fixed invest-
ment and inventory investment.
Fixed Investment
Fixed investment
includes all spending on capital
goods—sometimes called
producer goods
—such as
machinery, tools, and factory buildings. All these goods
increase future production capabilities. Residential
construction is also included as an investment expendi-
ture in GDP calculations. The construction of a house
allows for a valuable
consumer service—
shelter—to be provided
and is thus considered
an investment. Resi-
dential construction is
the only part of invest-
ment tied directly to
household expenditure
decisions.
Inventory Investment
Inventory investment
includes all purchases
by businesses that add to their inventories—stocks of
goods kept on hand by businesses to meet customer
demands. Every business needs inventory and, other
things being equal, the greater the inventory, the
greater the amount of goods and services that can be
sold to a consumer in the future. Thus, inventories are
considered a form of investment. For example, if a gro-
cery store expands and increases the quantity and vari-
ety of goods on its shelves, future sales can rise. An
increase in inventories, then, is presumed to increase
the firm’s future sales, which is why we say it is an
investment.
How Stable Are Investment Expenditures?
In recent years, investment expenditures generally
hovered around 15 percent of gross domestic prod-
uct. Investment spending is the most volatile cate-
gory of GDP, however, and tends to fluctuate
considerably with changing business conditions.
When the economy is booming, investment pur-
chases tend to increase dramatically. In downturns,
the reverse happens. In the first year of the Great
Depression, investment purchases declined by 37
percent. In recent years, expenditures on capital
goods have been a smaller proportion of GDP in the
United States than in many other developed nations.
This fact worries some people who are concerned
about GDP growth in the United States compared to
that in other countries, because investment in capi-
tal goods is directly tied to a nation’s future produc-
tion capabilities.
services
intangible items of value provided
to consumers, such as education
investment
the creation of capital goods
to augment future production
fixed investment
all new spending on capital goods
by producers
producer goods
capital goods that increase future
production capabilities
inventory investment
purchases that add to the stocks of
goods kept by the firm to meet con-
sumer demand
95469_22_Ch22_p603-632.qxd 4/1/07 3:39 PM Page 607

608
M O D U L E 6
Macroeconomic Foundations
S E C T I O N
*
C H E C K
1.
The expenditure approach to measuring GDP involves adding up the purchases of final goods and services by
market participants.
2.
Four categories of spending are used in the GDP calculation: consumption (C ), investment (I ), government pur-
chases (G ), and net exports (X – M ).
3.
Consumption includes spending on nondurable consumer goods (tangible items that are usually consumed in a
short period of time); durable consumer goods (longer-lived consumer goods); and services (intangible items of
value that do not involve physical production).
4.
Fixed investment includes all spending on capital goods, such as machinery, tools, and buildings. Inventory invest-
ment includes the net expenditures by businesses to increase their inventories.
5.
Purchases of goods and services are the only part of government spending included in GDP. Transfer payments are
not included in these calculations, because that spending is not a payment for a newly produced good or service.
6.
Net exports are calculated by subtracting total imports from total exports.
1.
What would happen to GDP if consumption purchases (C) and net exports (X – M) both rose, holding other things equal?
2.
Why do you think economic forecasters focus so much on consumption purchases and their determinants?
3.
Why are durable goods purchases more unstable than nondurable goods purchases?
4.
Why does the investment component of GDP include purchases of new capital goods but not purchases of com-
pany stock?
GOVERNMENT PURCHASES IN GDP (G)
The portion of government purchases included in GDP
is expenditures on goods and services. For example, a
government must pay the salaries of its employees,
and it must also make payments to the private firms
with which it contracts to provide various goods and
services, such as highway construction companies and
weapons manufacturers. All these payments would be
included in GDP. However, transfer payments (such as
Social Security, farm subsidies, and welfare) are not
included in government purchases, because this spend-
ing does not go to purchase newly produced goods or
services but is merely a transfer of income among the
country’s citizens (which is why such expenditures are
called transfer payments). The government purchase
proportion of GDP in the United States has grown
rapidly over the last 30 years.
EXPORTS (X
M)
Some of the goods and services produced in the
United States are exported for use in other countries.
The fact that these goods and services were made in
the United States means that they should be included
in a measure of U.S. production. Thus, we include the
value of exports when calculating GDP. At the same
time, however, some of our expenditures in other cat-
egories (consumption and investment, in particular)
were for foreign-produced goods and services. These
imports must be excluded from GDP to obtain an
accurate measure of U.S. production. Thus, GDP cal-
culations measure net exports, which equals total
exports (X) minus total imports (M). Net exports are
a small proportion of GDP and are often negative for
the United States.
Did you know that the estimate of vehicle miles traveled in
2000 was 2,688 trillion miles? The Federal Highway
Administration is working with its partners in the state trans-
portation departments to improve the larger National
Highway System (NHS) of 160,000 miles. The Federal Aid
Highway Program, begun in 1916, operates today with an
annual budget of nearly $30 billion and is linked closely to the
federal transit program.
95469_22_Ch22_p603-632.qxd 4/1/07 3:40 PM Page 608

C H A P T E R 2 2
Measuring a Nation’s Production, Income, and Spending
609
In addition to computing the gross domestic product,
the Bureau of Economic Analysis (BEA) also com-
putes five additional measures of production and
income: gross national product, net national product,
national income, personal income, and disposable per-
sonal income.
Incomes received by people providing goods and
services are actually payments to the owners of pro-
ductive resources. These payments are sometimes
called
factor payments.
Factor payments include
wages for the use of labor services, rent for land, pay-
ments for the use of capital goods in the form of inter-
est, and profits for entrepreneurs who put labor, land,
and capital together. Before we can measure national
income, we must make three adjustments to GDP. First,
we must look at the net income of foreigners—the
income earned abroad by U.S. firms or citizens minus
the income earned by
foreign firms or citi-
zens in the United
States. This difference
between net income of
foreigners and GDP is
called
gross national
product (GNP).
In
the United States, the
difference between GDP
and GNP is small be-
cause net income of
foreigners is a small
percentage of GDP.
The second adjust-
ment we make to find
national income is to
deduct depreciation from
GNP.
Depreciation
payments are annual allowances
set aside for the replacement of worn-out plant and
equipment. After we subtract depreciation, we have
net national product (NNP).
The final adjustment
is to subtract
indirect
business taxes.
The
best example of an in-
direct business tax is a
sales tax. For example,
a compact disc might
cost $14.95 plus a tax of $1.20 for a total of $16.15.
The retail distributor (record store), record producer,
and others will share $14.95 in proceeds, even though
the actual equilibrium price is $16.15. In other words,
the output (compact disc) is valued at $16.15, even
though recipients only get $14.95 in income. Besides
sales taxes, other important indirect business taxes
include excise taxes (e.g., taxes on cigarettes, auto-
mobiles, and liquor) and gasoline taxes.
Now we can measure
national income (NI),
which is a measure of the income earned by owners of
resources—factor payments. Accordingly, national
income includes pay-
ments for labor services
(wages, salaries, and
fringe benefits), pay-
ments for use of land
and buildings (rent),
money lent to finance
economic activity (inte-
rest), and payments for
use of capital resources
(profits). To obtain GDP,
we add indirect business
taxes, depreciation, and
net income of foreigners.
We should keep in mind that not all income can
be used by those who earn it.
Personal income (PI)
measures the amount of income received by house-
holds (including transfer payments) before income
taxes.
Disposable personal income
is the personal
income available to individuals after taxes.
factor payments
wages (salaries), rent, interest pay-
ments, and profits paid to the
owners of productive resources
gross national
product (GNP)
the difference between net income
of foreigners and GDP
depreciation
annual allowance set aside to
replace worn-out capital
net national product
(NNP)
GNP minus depreciation
indirect business
taxes
taxes, such as sales tax, levied on
goods and services sold
national income (NI)
a measure of income earned by
owners of the factors of production
personal income (PI)
the amount of income received by
households before personal taxes
disposable personal
income
the personal income available after
personal taxes
S E C T I O N
22.3
O t h e r M e a s u r e s o f To t a l P r o d u c t i o n
a n d To t a l I n c o m e
■
How is national income calculated?
■
What does personal income measure?
5.
If Mary received a welfare check this year, would that transfer payment be included in this year’s GDP? Why
or why not?
6.
Can inventory investment or net exports ever be negative?
95469_22_Ch22_p603-632.qxd 4/1/07 3:40 PM Page 609

610
M O D U L E 6
Macroeconomic Foundations
PROBLEMS IN CALCULATING AN ACCURATE GDP
The primary problem in calculating accurate GDP sta-
tistics becomes evident when attempts are made to
compare the GDP over time. Between 1970 and 1978,
a period of relatively high inflation, GDP in the United
States rose more than 100 percent. What great
progress! Unfortunately, however, the “yardstick” used
in adding the values of different products, the U.S.
dollar, also changed in value over this period. A dollar
in 1979, for example, would certainly not buy as much
as a dollar in 1970, because the overall price level for
goods and services increased.
HOW DO WE SOLVE THIS PROBLEM?
One solution to this problem would be to use physical
units of output—which, unlike the dollar, do not
change in value from year to year—as the measure of
total economic activity. The major problem with this
approach is that different products have different units
of measurement. How can anyone add tons of steel to
bushels of wheat, kilowatts of electricity, gallons of
paint, cubic feet of natural gas, miles of air passenger
travel, and number of magazines sold? To compare
GDP values over time, the calculations must use a
common, or standardized, unit of measure, which only
money can provide.
A PRICE-LEVEL INDEX
The dollar, then, is the yardstick of value we can use
to correct the inflation-induced distortion of the GDP.
We must adjust for the changing purchasing power of
the dollar by construct-
ing a
price index.
Essentially, a price
index attempts to pro-
vide a measure of the
prices paid for a certain
bundle of goods and
services over time. The
price index can be used to deflate the nominal or cur-
rent dollar GDP values to a real GDP expressed in
dollars of constant purchasing power.
S E C T I O N
*
C H E C K
1.
To find national income, we must subtract from GDP: (1) indirect business taxes, such as sales taxes;
(2) depreciation—payments set aside for the replacement of worn-out capital; and (3) net income of
foreigners in the United States.
2.
National income (NI) is measured by adding together the payments to the factors of production—wages,
rent, interest, and profit.
3.
Personal income (PI) measures the amount of income received by households (including transfer payments)
before personal taxes.
4.
Disposable personal income is the personal income available after personal taxes.
1.
How is personal income different from national income?
2.
What is the difference between GDP and national income?
price index
a measure of the trend in prices
paid for a certain bundle of goods
and services over a given period
S E C T I O N
22.4
P r o b l e m s i n C a l c u l a t i n g
a n A c c u r a t e G D P
■
What are the problems with using GDP to
measure output?
■
What is the purpose of a price-level index?
■
What problems are inherent with a price-
level index?
■
What is per capita GDP?
95469_22_Ch22_p603-632.qxd 4/1/07 3:40 PM Page 610
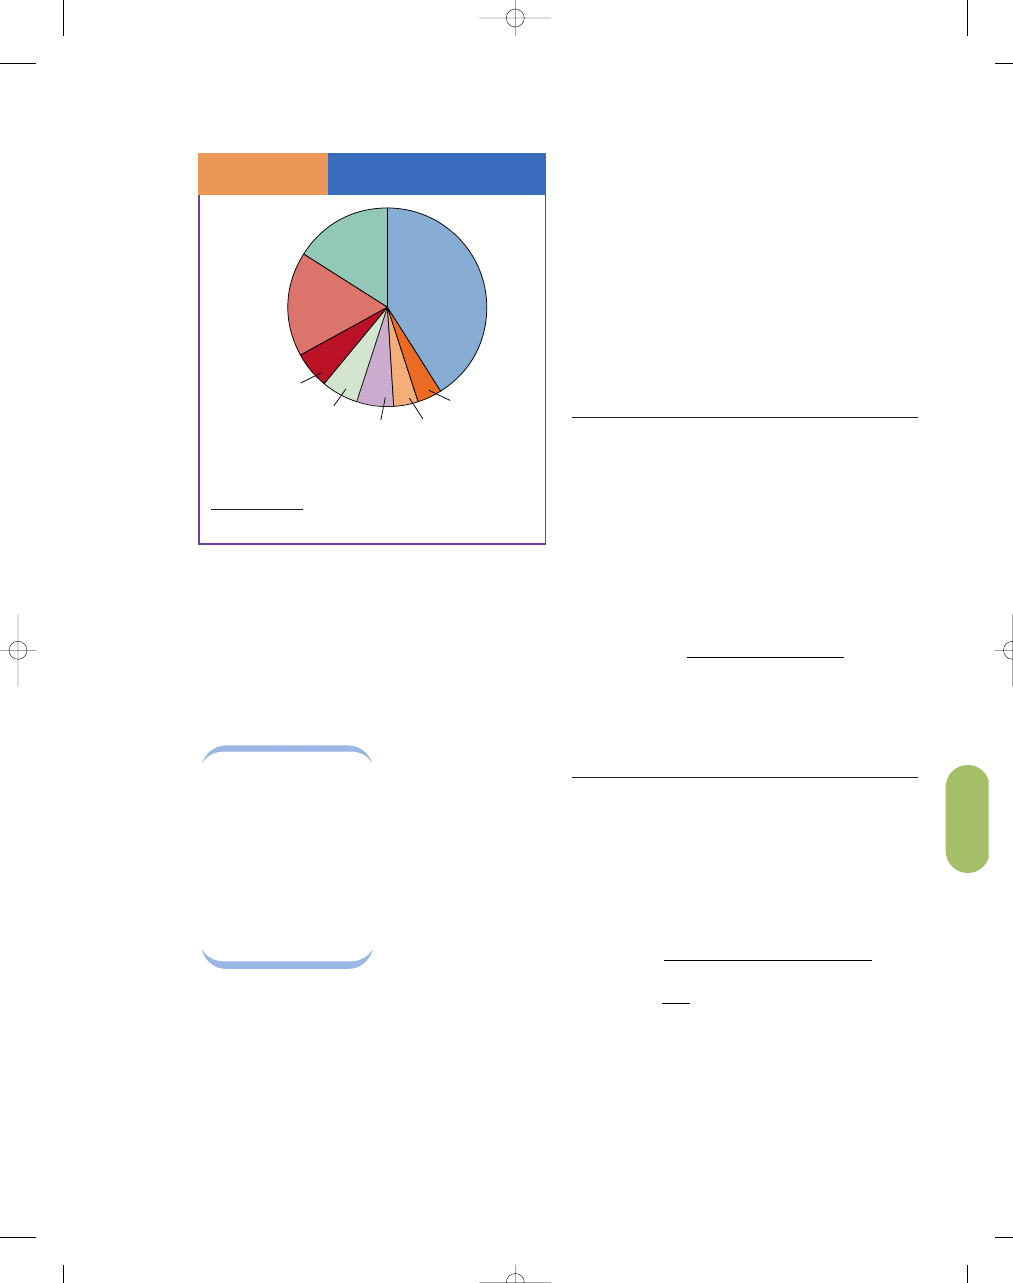
THE CONSUMER PRICE INDEX
AND THE GDP DEFLATOR
There are many different types of price indices. The
most well-known index, the
consumer price index
(CPI),
measures the trend in the prices of certain goods
and services purchased for consumption purposes—see
Exhibit 1. The CPI may be most relevant to households
trying to evaluate their
changing financial posi-
tions over time.
The
GDP deflator
corrects GDP statistics
for changing prices in
even broader terms. The
GDP deflator measures
the average level of
prices of all final goods
and services produced
in the economy.
HOW IS A PRICE INDEX CREATED?
Constructing a price index is complicated. First, liter-
ally thousands of goods and services are in our econ-
omy; attempting to include all of them in an index
would be cumbersome and make the index expensive
to compute, and it would take a long time to gather
the necessary data. Therefore, a “bundle” or “basket”
of representative goods and services is selected by the
index calculators (the Bureau of Labor Statistics of
the U.S. Department of Labor for consumer and
wholesale price indices; the Office of Business
Economics of the Department of Commerce for the
GDP deflator).
Calculating a Simple Price Index
Suppose a consumer typically buys 24 loaves of bread
and 12 gallons of milk in a year. The following table
lists the prices of bread and milk and the cost of the con-
sumer’s typical market basket in the years 2005–2007.
Price of
Price of
Cost of
Year
Bread
Milk
Market Basket
2005
$1.00
$2.00
(24
$1.00)
(12
$2.00) $48.00
2006
1.15 2.10
(24
$1.15)
(12
$2.10) $52.80
2007
1.40 2.20
(24
$1.40)
(12
$2.20) $60.00
Using the numbers from the table and the following
formula, we can calculate a price index to measure
the inflation rate.
The year 2005 is designated as the base year, so its
value is set equal to 100.
Year
Price Index
2005
$48/$48
100 100
2006
$52.80/$48
100 110
2007
$60/$48
100 125
A comparison of the price indices shows that between
2005 and 2006, prices increased an average of 10 per-
cent. In addition, between 2005 and 2007, 25 percent
inflation occurred.
That is, the price index for 2007 compared with 2005
is 125. Therefore, using the price index formula, we
can say that prices are 25 percent higher in 2007 than
they were in 2005, the base year.
Unfortunately for our ability to calculate
inflation, not all prices move by the same amount or
Price index
Cost of market basket in 2007
Co
=
sst of market basket in 2005
×
=
×
100
60
48
100
$
$
== 125
Price index
Cost of market basket
in curren
=
tt year
Cost of market basket
in base year
× 1000
C H A P T E R 2 2
Measuring a Nation’s Production, Income, and Spending
611
consumer price
index (CPI)
a measure of the cost of a market
basket that represents the consump-
tion of a typical household
GDP deflator
a price index that helps measure
the average price level of all final
consumer goods and services
produced
The Typical CPI Shopping
Basket of Goods and Services
S E C T I O N
2 2 . 4
E
X H I B I T
1
16%
Foods and
Beverages
41%
Housing
17%
Transportation
Education and
Communication
Medical Care
Recreation
Apparel
Other Goods
and Services
6%
6%
6%
4%
4%
The Bureau of Labor Statistics divides the typical
consumer’s spending among various categories of
goods and services.
SOURCE: U.S. Bureau of Labor Statistics.
95469_22_Ch22_p603-632.qxd 4/1/07 3:40 PM Page 611

612
M O D U L E 6
Macroeconomic Foundations
in the same direction. Consequently, we need to calcu-
late an average of the many price changes. This calcula-
tion is complicated by several factors. First, goods and
services change in quality over time, so the observed
price change may, in reality, reflect a quality change in
the product rather than the purchasing power of the
dollar. A $300 television set today is dramatically better
than a television set in 1950. Second, new products
come on the market and old products occasionally dis-
appear. For example, color TV sets did not exist in 1950
but are a major consumer item now. How can we cal-
culate changes in prices over time when some products
did not even exist in the earlier period?
Clearly, calculating a price index is not a simple,
direct process. As you can see from the In the News
article (“A Better CPI”), many factors can potentially
distort the CPI.
REAL GDP
Once the price index has been calculated, the actual
procedure for adjusting nominal, or current dollar,
GDP to get real GDP is not complicated. For conven-
ience, an index number of 100 is assigned to some
base year. The base year is arbitrarily chosen—it can
be any year.
The formula for converting any year’s nominal
GDP into real GDP (in base year dollars) is as follows:
Suppose the GDP deflator (price-level index) was
expressed in terms of 2000 prices (2000
100), and
the index figure for 2007 was 115. The increase in the
figure means that prices were 15 percent higher in
2007 than they were in 2000. To correct the 2007
nominal GDP, we take the nominal GDP figure for
2007— say, $10,000 billion — and divide it by the
price-level index (115), which results in a quotient of
$86.96 billion. We then multiply this number by 100,
giving us $8,696 billion, which would be the 2007
GDP in 2000 dollars (that is, 2007 real GDP, in terms
of a 2000 base year).
As a caveat, we should note that in recent years,
the Bureau of Economic Analysis (BEA) has calcu-
lated real GDP using a new procedure called chain
weighting. The purpose of the change is to make the
real GDP figure more accurate by updating the base
year more frequently. This new method of calculation
is more complicated; however, it shares the same basic
idea as the method used here.
The
chain weight-
ing system
works by
chaining years together.
Each year becomes a
link in the chain.
Suppose the growth
rate from 2004 to 2005
is 4 percent and the
growth rate from 2003 to 2004 is 2 percent. Then
chaining them together would give us an average of
3 percent growth rate for the two years. However, the
real benefit from chain weighting is that the market
Real GDP
Nominal GDP
Price-level index
=
× 100
i n t h e n e w s
Top-Grossing Films of All Time in the U.S. Adjusted for Inflation
Gross Domestic
Inflation Adjusted
Receipts
Gross Receipts
Movie
Year
(millions)
(millions)
1 Gone with the Wind
1939
$198.7 $1333.3
2 Star Wars
1977
$460.9 $1152.6
3 The Sound of Music
1965
$163.2 $925.1
4 E.T.
1982
$434.9 $914.9
5 Titanic
1997
$600.8 $839.0
6 Jaws
1975
$260.0
$832.0
7 Doctor Zhivago
1965
$111.7 $786.6
8 The Jungle Book
1967
$141.8 $703.7
9 Snow White and the Seven Dwarfs
1937
$184.9 $690.6
10 One Hundred and One Dalmatians
1961
$152.6 $666.7
SOURCE: The Movie Times, http://www.the-movie-times.com/thrsdir/alltime.mv?adjusted+ByAG+1.
chain weighting
system
calculates changes in prices that uses
base years from neighboring years
95469_22_Ch22_p603-632.qxd 4/1/07 3:40 PM Page 612
C H A P T E R 2 2
Measuring a Nation’s Production, Income, and Spending
613
basket is updated every year to reduce the upward
bias in the CPI.
OTHER MEASURES
Economists also calculate the
producer price
inde
x—a measure of the cost of goods and services
bought by firms.
Because firms often pass
on part of their costs to
consumers, this measure
is useful in predicting
changes in the CPI.
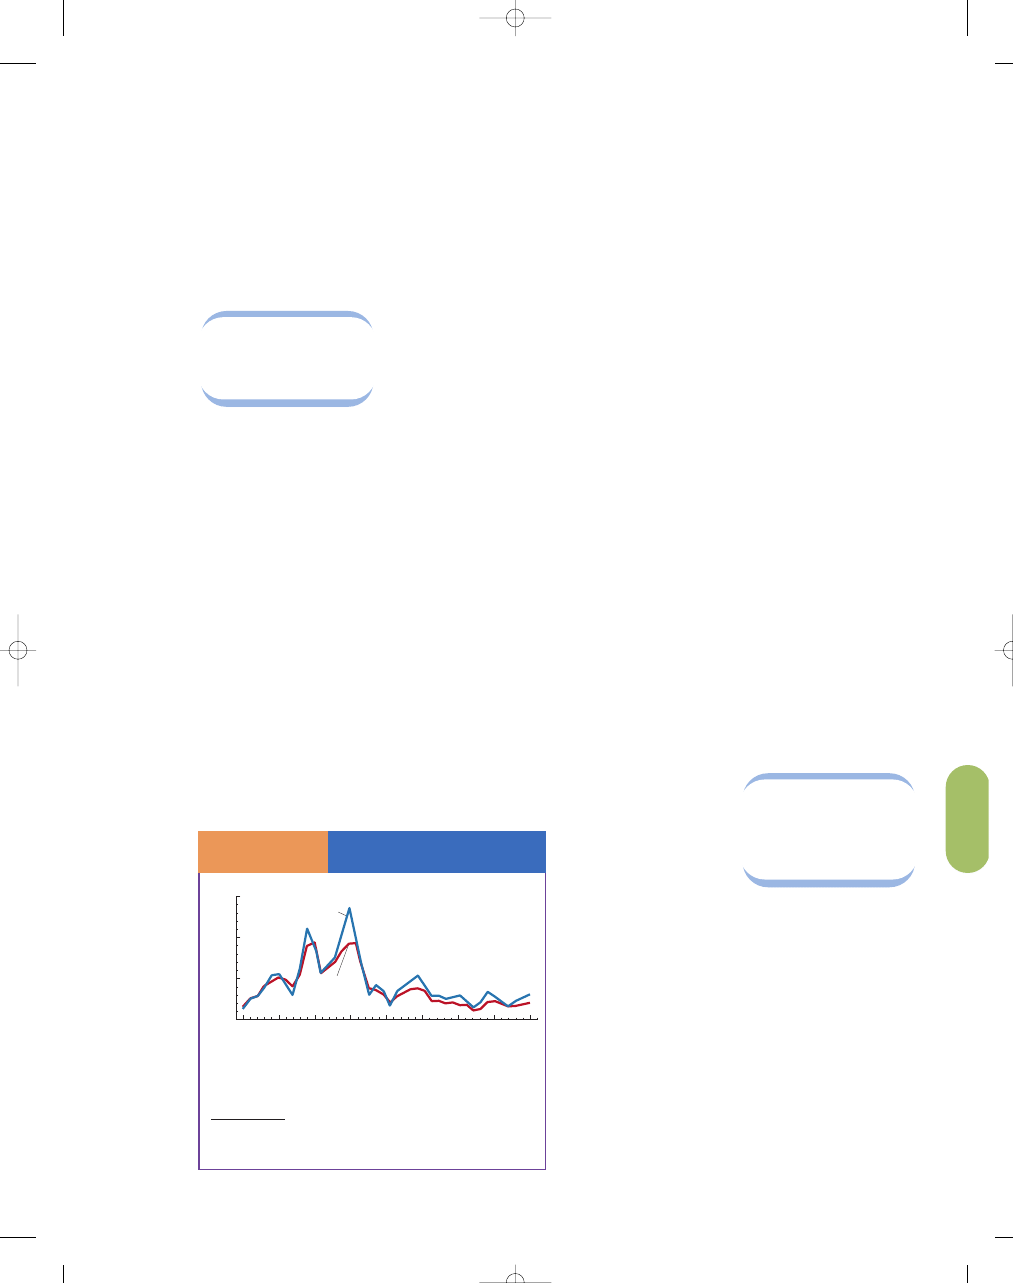
GDP DEFLATOR VERSUS CPI
Is the CPI or the GDP deflator a better indicator of
inflation? Or does it not really matter which one we
use? In Exhibit 2, we see that the two measures tend
to move in the same direction but that the CPI tends
to be much more volatile—it bounces around more
than the GDP deflator. However, both measures
probably overstate the inflation rate. One important
difference between them that can yield different
results is that the GDP deflator measures the price of
all goods and services that are produced domestically,
while the CPI measures the goods and services
bought by consumers. For example, a Porsche pro-
duced in Stuttgart, Germany, will show up in the
CPI, but it will not show up in the GDP deflator
because it was not produced in the U.S. economy.
More important, the same is true for the price of oil,
because much of U.S. oil is imported. Consequently,
oil price increases are fully captured in the CPI but
only partially captured in the GDP deflator—par-
tially captured because those increases do add to the
cost of production.
However, suppose the price of an airplane or air-
craft carrier being produced domestically for the mil-
itary increases. Because it is produced domestically, its
price will show up in the GDP deflator but not in the
typical consumer basket—the CPI.
IS REAL GDP ALWAYS LESS THAN NOMINAL GDP?
In modern times, inflation has been prevalent. For
many readers of this book, the price level (as meas-
ured by the consumer price index and the GDP
deflator) has risen in every year of their lifetime,
because the last year with a declining price level was
1955. Therefore, the adjustment of nominal (money)
GDP to real GDP will tend to reduce the growth in
GDP suggested by nominal GDP figures. Given the
distortions introduced by inflation, most news
reports about GDP today speak of real GDP
changes, although this distinction is not always
made explicit.
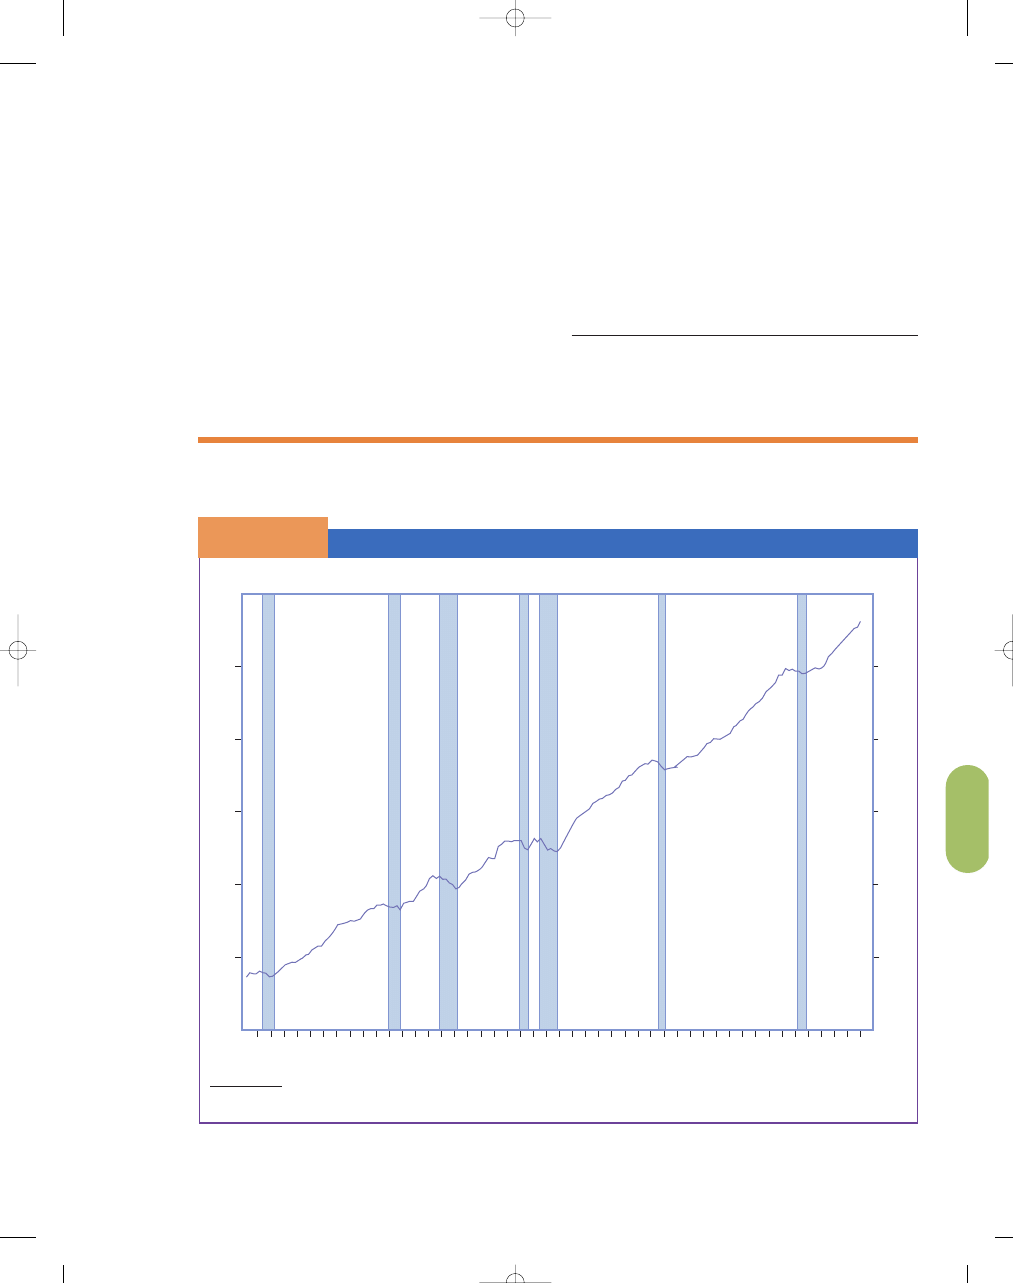
REAL GDP PER CAPITA
The measure of economic well-being, or standard of
living, most often used is
real gross domestic prod-
uct per capita.
We use a measure of real GDP for
reasons already cited.
To calculate real GDP
per capita, we divide
the real GDP by the
total population to get
the value of real output
of final goods and serv-
ices per person. Ceteris
paribus, people prefer
more goods to fewer, so a higher GDP per capita
would seemingly make people better off, improving
their standard of living. Economic growth, then, is
usually considered to have occurred anytime the real
GDP per capita has risen. In Exhibit 3 (on page 615),
we see that in the United States the real gross domes-
tic product per capita has grown sharply from 1958 to
2005. Real GDP per capita is almost three times larger
in 2005 than it was in 1958. However, the growth in
real GDP per capita is not steady, as seen by the
shaded areas that represent recessions in Exhibit 3.
Falling real GDP per capita can bring on many human
hardships, such as rising unemployment, lower profits,
stock market losses, and bankruptcies.
producer price index
a measure of the cost of goods and
services bought by firms
The CPI and the
GDP Deflator
S E C T I O N
2 2 . 4
E
X H I B I T
2
15
10
5
0
1965
1970
1975
1980
1985
Year
P
e
rcent per Year
1995
2000
2005
1990
CPI
GDP deflator
Even though the two indicators move together, the
CPI tends to be more volatile.
SOURCES: U.S. Department of Labor; U.S. Department of Commerce, and
International Monetary Fund.
real gross domestic
product per capita
real output of goods and services
per person
95469_22_Ch22_p603-632.qxd 4/1/07 3:40 PM Page 613

614
M O D U L E 6
Macroeconomic Foundations
i n t h e n e w s
A Better CPI
The monthly consumer price index (CPI) is the most oft-cited measure of
inflation and one of the most important and closely watched statistics in the
U.S. economy. It is an indicator of how well the Federal Reserve is doing in
achieving and maintaining low inflation, and it also is used to determine
cost-of-living adjustments for many government programs, collective bar-
gaining contracts, and individual income tax brackets.
Since 1995, the Bureau of Labor Statistics (BLS) has been eliminating
biases that cause the index to overstate inflation. . . . These changes are
expected to create a more reliable index. . . . Although this may seem like a
small change, the effect of these changes is permanent so that measured
inflation will be lower by this amount in all future years.
It is important that the CPI should measure inflation accurately or that
the degree of bias be known. Macroeconomic policymakers such as the Fed
then can take appropriate steps to keep inflation low, and the public can be
informed about their successes and failures in achieving their goal. Also, if the
CPI does not measure inflation correctly, cost-of-living adjustments based on
it will have different effects from those desired when the commitments to
make these adjustments were made. For example, adjusting Social Security
benefits based on an upwardly biased CPI may shift spending power from the
young toward the old.
The BLS has been studying possible biases in the CPI for a long time. The
issue gained national prominence in 1996 when the Congress commissioned a
panel of experts on price measurement issues, chaired by Michael Boskin of
Stanford University, to examine biases in the CPI. Their report, “Toward a More
Accurate Measure of the Cost of Living,” identified four major sources of bias
and estimated that they caused the CPI to overstate inflation by 1.1 percent-
age points per year at that time.
SUBSTITUTION BIAS
Substitution bias occurs because the CPI measures the price changes of a
fixed basket of goods and services and thus does not capture the savings
that households enjoy when they change their spending in response to rel-
ative price changes of goods and services. For example, a rise in the price
of beef leads people to buy more chicken in order to keep their food costs
down. . . .
OUTLET BIAS
This type of bias is similar to substitution bias, but refers to where households
shop rather than to what they purchase. Over the past 15 years, for example,
the growth of discount stores has helped consumers lower their expenditures
by offering high-volume purchases at reduced prices. The expansion of
these establishments has not been adequately represented in the CPI, thus
creating an upward bias of prices estimated at 0.1 percentage point per year.
A similar problem may arise in the future as shopping online becomes more
widespread.
NEW PRODUCT BIAS
This bias occurs because new products, such as VCRs and cellular phones, are
not introduced into the index until they are commonplace items. This means
that the substantial price decreases and quality increases that occur during
the early years following introduction are not captured by the index. A problem
of dealing with this bias is that the BLS can never know in advance which of
the many new products introduced each year will be successful and hence
worthy of inclusion in the CPI.
QUALITY BIAS
This bias arises because some of any increase in the price of an item may be
due to an improvement in quality, rather than being a pure price increase. For
example, when car prices rise, this may be due to the addition of seat belts,
air bags, or anti-smog devices, or to pure price inflation. In the case of cars,
the BLS often uses the price of the new item as an optional feature before it
becomes standard equipment as an indicator of what the improvement is
worth to consumers. Quality improvements in other areas—such as medical
care—are more difficult to measure so that bias is more likely to occur. And
features of a product that become mandatory—such as seat belts, which
buyers are forced to purchase even if they would prefer not to—are particu-
larly difficult to handle.
The BLS began to address the bias in the CPI even before the Boskin
Commission was convened. For example, in 1995 the BLS introduced a new
sampling procedure to determine which outlets to visit to obtain price
data for specific items and what weights to apply to those item prices.
If people prefer buying in bulk at discount stores, will the CPI
accurately measure inflation? The success of discount stores has
grown over the last few years, indicating that for some customers,
the reduction in customer service often associated with these
megastores does not offset the lower prices, introducing an upward
bias into the index.
95469_22_Ch22_p603-632.qxd 4/1/07 3:40 PM Page 614
C H A P T E R 2 2
Measuring a Nation’s Production, Income, and Spending
615
The old procedure put too much weight on items that were temporarily
cheap at that outlet, so when their prices rose back to their normal level,
this registered as an increase in inflation. That same year, the BLS also
revised sampling methods to remove the effects of substituting between
brand drugs and generic drugs. . . . Spurred by the work of the Boskin
Commission, the BLS introduced further changes to confront substitution
and outlet bias.
Since the Fed uses the CPI as an indicator of price inflation, a more
accurate index should make anti-inflationary monetary policy more effec-
tive. The public will have a better indicator to check how well the Fed is
doing its job. If we want our tax and transfer system to be invariant to
inflation, an accurate CPI is essential so that the task of adjusting tax and
transfer payments to price changes can be done quickly, easily, and without
undue dispute.
Ongoing research is necessary to identify biases in the CPI. Changes
to this index are ongoing as the BLS strives to maintain an accurate meas-
ure of inflation in our dynamic economy. The BLS has reduced the size of
the substitution bias and the new product bias by updating the market
basket every 2 years rather than every 10 years. Other improvements
have also been implemented. Many economists believe that the BLS
improvements have cut the inflationary bias in half and it is now less
than 1 percent.
SOURCE: Alison Wallace and Brian Motley, “A Better CPI,” Economic Letter, The
Federal Reserve Bank of San Francisco, February 5, 1999. http://www.frbsf.org.
Reprinted from the Federal Reserve Bank of San Francisco Economic Letter 99–05.
The opinions expressed in this article do not necessarily reflect the views of the
management of the Federal Reserve Bank of San Francisco, or of the Board of
Governors of the Federal Reserve System.
Real GDP per Capita
S E C T I O N
2 2 . 4
E
X H I B I T
3
40,000
35,000
30,000
25,000
20,000
15,000
10,000
59
61
63
65
67
69
71
73
75
77
79
81
83
85
87
89
91
93
95
97
99
01
03
05
Chained (2000) dollars
Apr Feb
Dec Nov
Nov
Mar
Mar
Mar
Jan
Nov
Nov
Jly Jly
Jly
35,000
30,000
25,000
20,000
15,000
10,000
40,000
NOTE: Shaded areas represent recessions.
SOURCE: U.S. Bureau of Economic Analysis, 2006.
95469_22_Ch22_p603-632.qxd 4/1/07 3:40 PM Page 615

616
M O D U L E 6
Macroeconomic Foundations
WHY IS THE MEASURE OF PER CAPITA
GDP SO IMPORTANT?
Because one purpose of using GDP as a crude welfare
measure is to relate output to human desires, we need
to adjust for population change. If we do not take
population growth into account, we can be misled by
changes in real GDP values. For example, in some
less-developed countries in some periods, real GDP
has risen perhaps 2 percent a year, but the population
has grown just as fast. In these cases, the real output
of goods and services per person has remained virtu-
ally unchanged, but this would not be apparent in an
examination of real GDP trends alone.
using what you’ve learned
Babe Ruth’s Salary Adjusted for Inflation
To many baseball purists, Babe Ruth was the greatest player of the
game, but how does his salary compare with the highest salary in base-
ball today? When Babe Ruth made $80,000 a year in 1931, he was asked by the
press if he knew that his salary exceeded that of President Herbert Hoover. Ruth
said, “Yes, I know. But I had a better year than President Hoover did.”
The Bureau of Labor Statistics computes CPI all the way back to 1913.
The average CPI for 1931, the year Babe Ruth made $80,000, was 15.2.
The average CPI for 2006 was 200. We can easily convert the Babe’s salary into
current dollars by performing the following calculation:
Babe’s salary in 1931
$80,000
Price level in 2006
Price level in 1931
$80,000
200 $1,052,632
15.2
Therefore, the Babe would be making $1,052,632 a year if he were paid the
same in 2006 as he was paid in 1931. Not bad, but not even close to what
today’s stars of the game are paid. At $25 million a year, Alex Rodriguez makes
roughly 25 times Babe’s adjusted salary.
©
AP/Wide W
or
ld
Photo
Q
A
S E C T I O N
*
C H E C K
1.
It is difficult to compare real GDP over time because of the changing value of money over time.
2.
A price-level index allows us to compare prices paid for goods and services over time by creating a measure of how
many dollars it would take to maintain a constant purchasing power over time. The consumer price index (CPI) is
the best-known index.
3.
The GDP deflator is a price index that measures the average level of prices of all final goods and services produced
in the economy.
4.
The consumer price index fails to account for increased quality of goods, introduction of new goods, or
changes in the relative quantities of goods purchased.
5.
Per capita real GDP is real output of goods and services per person. In some cases, real GDP may increase; but per
capita real GDP may actually drop as a result of population growth.
1.
If we overestimated inflation over time, would our calculations of real GDP growth be over- or underestimated?
2.
Why does the consumer price index tend to overstate inflation if the quality of goods and services
is rising over time?
95469_22_Ch22_p603-632.qxd 4/1/07 3:40 PM Page 616

C H A P T E R 2 2
Measuring a Nation’s Production, Income, and Spending
617
3.
Why would the CPI take into account some goods imported from other countries, but not take into
account some goods produced domestically, unlike the GDP deflator?
4.
Why would the growth in real GDP overstate the growth of output per person in a country with a growing
population?
5.
Why doesn’t the consumer price index accurately adjust for the cost-of-living effects of a tripling in the
price of bananas relative to the prices of other fruits?
As we noted throughout this chapter, real GDP is
often used as a measure of the economic welfare of a
nation. The accuracy of this measure for that purpose
is questionable, however, because several important
factors are excluded from its calculation. These factors
include nonmarket transactions, the underground
economy, leisure, externalities, and the quality of the
goods purchased.
NONMARKET TRANSACTIONS
Nonmarket transactions include the provision of
goods and services outside traditional markets for
which no money is exchanged. We simply do not
have reliable enough information on this output to
include it in the GDP. The most important single
nonmarket transaction omitted from the GDP is the
services of housewives (or househusbands). These
services are not sold in any market, so they are not
entered into the GDP; but they are nonetheless per-
formed. For example, if a single woman hires a tax
accountant, those payments enter into the calcula-
tion of GDP. Suppose, though, that the woman mar-
ries her tax accountant. Now the woman no longer
pays her husband for his accounting services.
Reported GDP falls after the marriage, although
output does not change.
In less-developed countries, where a significant
amount of food and clothing output is produced in
the home, the failure to include nonmarket economic
activity in GDP is a serious deficiency. Even in the
S E C T I O N
22.5
P r o b l e m s w i t h G D P a s a M e a s u r e
o f E c o n o m i c W e l f a r e
■
What are some of the deficiencies of GDP
as a measure of economic welfare?
■
What are nonmarket transactions?
■
What is the underground economy?
Are their household production efforts included in GDP?
Some estimate that nonmarket activities such as household
and family work account for roughly 20 percent of GDP. If a
family hires someone to clean the house, provide childcare,
mow the lawn, or cook, the service is included in GDP; when
members of the household provide these services, they are
not included in GDP. Neglecting household production in GDP
distorts measurements of economic growth and leads to
potential policy problems. Is it time to include household
activities in GDP? An estimate of the value of these services
could be obtained by calculating the cost of buying these
services in the marketplace.
95469_22_Ch22_p603-632.qxd 4/1/07 3:40 PM Page 617

United States, homemade meals, housework, and the
vegetables and flowers produced in home gardens are
excluded, even though they clearly represent an
output of goods and services.
THE UNDERGROUND ECONOMY
It is impossible to know for sure the magnitude of the
underground economy, which includes unreported
income from both legal and illegal sources. For exam-
ple, illegal gambling and prostitution are not included
in the GDP, leading to underreporting of an unknown
magnitude. The reason these activities are excluded,
however, has nothing to do with the morality of the
services performed; rather, the cause of the exclusion
is that most payments made for these services are nei-
ther reported to government authorities nor go
through normal credit channels. Likewise, cash pay-
ments made to employees “under the table” slip
through the GDP net. Estimates of the size of the
underground economy vary from less than 4 percent
to more than 20 percent of GDP. It also appears that
a significant portion of this unreported income comes
from legal sources, such as self-employment.
618
M O D U L E 6
Macroeconomic Foundations
Growing Underground
g l o b a l w a t c h
Underground economies are large and growing rapidly in most countries. High
taxes and labor market regulations are the reasons why 17 percent of
economic activity goes unreported in OECD [Organization for Economic
Co-operation and Development] countries, while corruption explains the
large black market in some developing ones.
By definition, national income statistics capture economic activity
reported by individuals and corporations. A large and growing portion of eco-
nomic activity, however, goes unrecorded in most countries. This “under-
ground” economy consists of legal activities that are concealed, mainly for
reasons of tax evasion. Underground activity grew during the 1970s, when
government became pervasive in national economies. As tax rates were raised
to finance public spending programs, an increasing number of individuals
risked dodging taxes. It is only since the 1980s that economists have
attempted to estimate the size of underground economies. This task is inher-
ently difficult .
Nevertheless, it is important to estimate the size and growth of all
economic activity, not only the reported kind. For one thing, cross-country
comparisons of per capita income depend on it. By one account, Italy
would be one of the richest European countries if its large black market
were included alongside reported income. More importantly, GDP growth
figures and unemployment rates may be severely distorted if a sudden
increase in taxes pushes more people underground. Accurate statistics
about overall economic activity and true unemployment are essential for
effective economic policy decisions.
An article in the Journal of Economic Literature takes a closer look at the
size, causes, and consequences of underground economies. Its authors,
Friedrich Schneider of the University of Linz and Dominick Enste of the
University of Cologne, claim that no cross-country comparison of under-
ground economies has yet been undertaken. In their research, the authors
compare the relative size of underground economies for 76 countries, and
track their growth over time. They point out that even though estimates of
underground economies are naturally inexact, economists generally agree
that they are growing in most countries. Moreover, underground economies
vary significantly in size, from a small fraction of “official” GDP (Switzerland),
to nearly three-quarters of economic output (Nigeria, Egypt, and Thailand).
But first, what drives people underground? The authors argue that
underground activity grows when tax rates rise. This is most noticeable in
Scandinavian countries where governments have created some of the most
generous public programs over the past few decades, and have consequently
witnessed a substantial rise in their underground economies. This unsurpris-
ing claim is substantiated by the data. Norway, for example, has seen its
underground economy grow from a negligible 1.5 percent of GNP in 1960 to a
staggering 18 percent in 1995 (based on the currency demand approach). The
high fiscal burden in other Scandinavian countries has led to a similar growth
in their underground economies. In contrast, countries with relatively small
public sectors—such as Switzerland and the United States—have developed
much smaller underground markets.
The study shows that underground economies have grown in all OECD
countries over the past few decades, representing an alarming 17 percent of
reported GDP by 1997. In countries such as Spain, Portugal, Italy, Belgium, and
Greece, the estimated size of unreported economic activity stood at 22 to 30
percent. “In the European Union at least 20 million workers and in OECD coun-
tries about 35 million work in the unofficial economy. Moreover, the amount
doubled within 20 years.”
The authors find evidence that fewer regulations (that are properly
enforced), lower tax rates, and a better rule of law lead to smaller under-
ground economies, and consequently generate higher tax revenues. These fac-
tors are absent in many countries of Latin America, where underground
economies amount to one-quarter to one-third of official GNP, and in the
former Soviet Union, where underground economies stand at more than one-
third of reported income.
SOURCE: Author’s discussion of Friedrich Schneider and Dominick H. Enste,
“Shadow Economies: Size, Causes and Consequences,” Journal of Economic
Literature (March 2000), and Economic Intuition (Summer 2000).
95469_22_Ch22_p603-632.qxd 4/1/07 3:40 PM Page 618

C H A P T E R 2 2
Measuring a Nation’s Production, Income, and Spending
619
MEASURING THE VALUE OF LEISURE
The value that individuals place on leisure is omitted in
calculating GDP. Most of us could probably get a part-
time job if we wanted to, earning some additional
money by working in the evening or on weekends. Yet
we choose not to do so. Why? The opportunity cost is
too high—we would have to forgo some leisure. If you
work on Saturday nights, you cannot see your friends,
go to parties, attend concerts, watch television, or go to
the movies. The opportunity cost of leisure is the
income forgone by not working. For example, if people
start taking more three-day weekends, GDP will surely
fall, but can we necessarily say that the standard of
living will fall? GDP will fall, but economic well-being
may rise.
Leisure, then, has a positive value that does not
show up in the GDP accounts. To put leisure in the
proper perspective, ask yourself whether you would
rather live in Country A, which has a per capita GDP
of $25,000 a year and a 30-hour work week, or
Country B, with a $25,000 per capita GDP and a
50-hour work week. Most people would choose
Country A. The problem that this omission in GDP
poses can be fairly significant in international com-
parisons or observations of one nation over time.
i n t h e n e w s
CONSIDER THIS:
According to Michael Cox and Richard Alm, the real cost of living, as
measured in the hours and minutes we must work to live, is surely
falling. That is, the cost to buy a particular good or service in terms of
time on the job has decreased. Many goods such as microwaves, cellu-
lar phones, and camcorders have fallen in money price. This, coupled
with higher wages and better-quality products, has been a real boon to
the consumer.
Time Well Spent
As America exits the twentieth century, we’d be hard-pressed to find a five and
dime store. Penny candy now goes for a nickel or more. Five cents no longer
buys a good cigar. Dime novels can’t be found. Even a 3¢ stamp costs 32¢. Over
the century, prices have gone up. The buying power of a dollar is down. We
know this from statistical measures of inflation. We know it also from
Grandpa’s stories about paying 15¢ for a ticket to Gone with the Wind or 19¢
for a gallon of gasoline. Even a casual observer of the U.S. economy can see
that the prices of milk, bread, houses, clothes, cars, and many other goods and
services rise from year to year.
The cost of living is indeed going up—in money terms. What really mat-
ters, though, isn’t what something costs in money; it’s what it costs in time.
Making money takes time, so when we shop, we’re really spending time. The
real cost of living isn’t measured in dollars and cents but in the hours and
minutes we must work to live. American essayist Henry David Thoreau
(1817–62) noted this in his famous book, Walden: “The cost of a thing is the
amount of . . . life which is required to be exchanged for it, immediately or
in the long run.”
The shortcoming of money prices is that they mean little apart from
money wages. A pair of stockings cost just 25¢ a century ago. This sounds
wonderful until we learn that a worker of the era earned only 14.8¢
an hour. So paying for the stockings took 1 hour 41 minutes of work. Today
a better pair requires only about 18 minutes of work. Put another way,
stockings cost an 1897 worker today’s equivalent of $22, whereas now
a worker pays only about $4. If modern Americans had to work as hard
as their forebears did for everyday products, they’d be in a continual state
of sticker shock—$67 scissors, $913 baby carriages, $2,222 bicycles, $1,202
telephones.
The best way to measure the cost of goods and services is in terms of a
standard that doesn’t change—time at work, or real prices. There’s a regular
pattern to real prices in our dynamic economy.
Americans come in all shapes and sizes. We differ in height and weight,
gender, race, and age. We vary in talents, skills, education, experience,
determination, and luck. Quite naturally, our paychecks differ, too. Some of us
scrape by at minimum wage, while movie stars, corporate chieftains, and ath-
letes sometimes make millions of dollars a year.
Calculations of the work time needed to buy goods and services use the
average hourly wage for production and nonsupervisory workers in manufac-
turing. A century ago this figure was less than 15¢ an hour. By 1997 it had hit a
record $13.18, a livable wage, but nothing worthy of Lifestyles of the Rich and
Famous. What’s most important about this wage is that it roughly represents
what’s earned by the great bulk of American society.
In calculating our cost of living, a good place to start is with the
basics—food, shelter, and clothing. In terms of time on the job, the cost of
a half-gallon of milk fell from 39 minutes in 1919 to 16 minutes in 1950, 10
minutes in 1975 and 7 minutes in 1997. A pound of ground beef steadily
declined from 30 minutes in 1919 to 23 minutes in 1950, 11 minutes in 1975
and 6 minutes in 1997. Paying for a dozen oranges required 1 hour 8 minutes
of work in 1919. Now it takes less than 10 minutes, half what it did in 1950.
The money price of a 3-pound fryer chicken rose from $1.23 in 1919 to $3.15
in 1997, but its cost in work time fell from 2 hours 37 minutes to just 14 min-
utes. A sample of a dozen food staples—a market basket broad enough to
provide three squares a day—shows that what required 9.5 hours to buy in
1919 and 3.5 hours in 1950 now takes only 1.6 hours.
SOURCE: W. Michael Cox and Richard Alm, 1997 Annual Report: Time Well Spent,
Federal Reserve Bank of Dallas. Reprinted with permission.
95469_22_Ch22_p603-632.qxd 4/1/07 3:40 PM Page 619

620
M O D U L E 6
Macroeconomic Foundations
GDP AND EXTERNALITIES
As we have discussed in earlier chapters, positive and
negative externalities may result from the production of
some goods and services. As a result of these externali-
ties, the equilibrium prices of these goods and services—
the figures used in GDP calculations—do not reflect
their true values to society (unless, of course, the exter-
nalities have been internalized). For example, if a steel
mill produces 100,000 more tons of steel, GDP
increases; GDP does not, however, decrease to reflect
damages from the air pollution that results from the
production of that additional steel. Likewise, additional
production of a vaccine would be reflected in the GDP,
but the positive benefit to members of society—other
than the purchaser—would not be included in the cal-
culation. In other words, while GDP measures the
goods and services produced, it does not adequately
measure the “goods” and “bads” that result from the
production processes.
QUALITY OF GOODS
GDP can also miss important changes in the
improvements in the quality of goods and services.
For example, the quality of a computer bought
today differs significantly from one that was bought
10 years ago, but it will not lead to an increase in meas-
ured GDP. The same is true of many other goods,
from cellular phones to automobiles to medical care.
OTHER MEASURES OF ECONOMIC WELL-BEING
Even if we included some of these statistics that are
difficult to measure, such as nonmarket transactions,
the underground economy, leisure, externalities, and
the quality of products, GDP would still not be a
precise measure of economic well-being. Many other
indices of well-being should be considered: life
expectancies, infant mortality rates, education and
environmental quality, levels of discrimination and
fairness, health care, low crime rates, and minimum
traffic congestion, just to name a few. GDP is a
measure of economic production, not a measure of
economic well-being. However, greater levels of
GDP can lead to improvements in economic well-
being, because society will now be able to afford
better education and health care and a cleaner, safer
environment.
GDP doesn’t measure everything that contributes to
or detracts from our well-being; it is difficult to
measure the value of those effects. Environmentalists
believe that national income accounts should adjust
for changes in the environment. But this leads to
many conceptual problems, such as how to measure
the marginal values of goods and services not sold in
markets and how to adjust for geographical differ-
ences in environmental damage. The critical issue is
whether important trends in “uncounted” goods and
services result in questionable conclusions about
whether we are becoming better or worse off.
©
Photodisc Green/Getty Images
S E C T I O N
*
C H E C K
1.
Several factors make it difficult to use GDP as a welfare indicator, including nonmarket transactions, the under-
ground economy, leisure, externalities, and the quality of goods.
2.
Nonmarket transactions are the exchanges of goods and services that do not occur in traditional markets and for which
no money is exchanged.
95469_22_Ch22_p603-632.qxd 4/1/07 3:40 PM Page 620

C H A P T E R 2 2
Measuring a Nation’s Production, Income, and Spending
621
3.
The underground economy is the unreported production and income that come from legal and illegal activities.
4.
The presence of positive and negative externalities makes it difficult to measure GDP accurately.
1.
Why do GDP measures omit nonmarket transactions?
2.
How would the existence of a high level of nonmarket activities in one country impact real GDP comparisons
between it and other countries?
3.
If we choose to decrease our hours worked because we value the additional leisure time more, will the resulting
change in real GDP accurately reflect the change in our well-being? Why or why not?
4.
How do pollution and crime affect GDP? How do pollution- and crime-control expenditures impact GDP?
Fill in the blanks:
1. _____________ accounting was created to provide a
reliable, uniform method of measuring economic per-
formance.
2. _____________ is defined as the value of all final
goods and services produced in a country in a period
of time, almost always one year.
3. A(n) _____________ good or service is one that is
ready for its designated ultimate use, in contrast to
_____________ goods or services, which are used in
the production of other goods.
4. The two primary ways of calculating economic output
are the _____________ approach and the
_____________ approach.
5. With the ______________ approach, GDP is calcu-
lated by adding up the expenditures of market partici-
pants on final goods and services over a period of
time.
6. For analytical purposes, economists usually categorize
expenditures into four categories: _____________,
_____________, _____________, and _____________.
7. Consumption spending is usually broken down into
three subcategories: _____________ goods,
_____________ consumer goods, and _____________.
8. Consumption refers to the purchase of consumer
goods and services by _____________.
9. The most important single category of consumer
durable goods is consumer _____________.
10. Sales of nondurable consumer goods tend to be
_____________ stable over time than sales of durable
goods.
11. Investment, as used by economists, refers to the cre-
ation of _____________ goods, whose purpose is to
_____________.
12. The two categories of investment purchases measured
in the expenditures approach are _____________
investment and _____________ investment.
13. When the economy is booming, investment purchases
tend to _____________ dramatically.
14. _____________ payments are not included in
government purchases because that spending does
not go to purchase newly produced goods or
services.
15. Imports must be _____________ from GDP in order to
obtain an accurate measure of domestic production.
16. The _____________ approach to measuring GDP
involves summing the incomes received by producers
of goods and services.
17. Output creates _____________ of equal value.
18. Factor payments include _____________ for the use of
labor services, _____________ for land,
_____________ payments for the use of capital goods,
and _____________ for entrepreneurs, who put labor,
land, and capital together.
19. The incomes received by persons providing goods and
services are actually payments to the owners of
_____________ resources and are sometimes called
_____________ payments.
20. _____________ must be subtracted from gross
domestic product to get net national product
(NNP).
21. _____________ income is the personal income avail-
able to individuals after taxes.
22. We must adjust for the changing purchasing power of
the dollar by constructing a price _____________.
23. The best-known price index is the _____________,
which provides a measure of the trend in the prices
of goods and services purchased for consumption
purposes.
I n t e r a c t i v e S u m m a r y
95469_22_Ch22_p603-632.qxd 4/1/07 3:40 PM Page 621

A
nswers:1.
National income
2.GDP
3.final; intermediate
4.expenditure; income
5.expenditure
6.consumption; investment; gov-
ernment purchases; net exports
7.nondurable; durable; services
8.households
9.vehicles
10.more
11.capital; produce other goods
12.fixed; inventory
13.increase
14.T
ransfer
15.excluded
16.income
17.income
18.wages; rent; interest; profits
19.productive;
factor
20.Depreciation
21.Disposable personal
22.index
23.consumer price index
24.final
25.households
26.current; base
27.more
28.nominal GDP; price-level index
29.real; total population
30.reliable
31.in the home
32.omitted
622
M O D U L E 6
Macroeconomic Foundations
K e y Te r m s a n d C o n c e p t s
national income accounting 603
gross domestic product (GDP) 604
double counting 604
expenditure approach 606
consumption 606
nondurable goods 606
durable goods 606
services 607
investment 607
fixed investment 607
producer goods 607
inventory investment 607
factor payments 609
gross national product (GNP) 609
depreciation 609
net national product (NNP) 609
indirect business taxes 609
national income (NI) 609
personal income (PI) 609
disposable personal income 609
price index 610
consumer price index (CPI) 611
GDP deflator 611
chain weighting system 612
producer price index 613
real gross domestic product per
capita 613
S e c t i o n C h e c k A n s w e r s
22.1 National Income Accounting: A Standardized Way to
Measure Economic Performance
1. Why does GDP measure only final goods and services
produced, rather than all goods and services
produced?
If the market value of every good and service sold
were included in GDP, the same output would be
counted more than once in many circumstances (as
when the sales price of, say, bread includes the value
of the flour that was used in making the bread, and
the flour, in turn, includes the value of the wheat that
was used to make the flour). Only final goods and
services are included in GDP to avoid such double
counting.
2. Why aren’t all of the expenditures on used goods in
an economy included in current GDP?
Current GDP does not include expenditures on used
goods because GDP is intended to measure the value
of currently produced goods and services in the econ-
omy. Used goods are not currently produced and have
already been counted for the year they were newly
produced.
3. Why do GDP statistics include real estate agents’ com-
missions from selling existing homes and used car deal-
ers’ profits from selling used cars, but not the value of
existing homes or used cars when they are sold?
Existing homes and used cars were both produced
in the past and therefore aren’t counted as part of
24. The GDP deflator measures the average level of prices
of all _____________ goods and services produced in
the economy.
25. The CPI is the price index that is most relevant to
_____________ trying to evaluate their changing
financial position over time.
26. A price index is equal to the cost of the chosen
market basket in the _____________ year, divided by
the cost of the same market basket in the
_____________ year, times 100.
27. While the CPI and the GDP deflator move together,
the CPI tends to be _____________ volatile.
28. The formula for converting any year’s nominal GDP
into real GDP (in base year dollars) is real GDP
equals _____________ divided by the _____________,
times 100.
29. To calculate real per capita GDP, we divide
_____________ GDP by the _____________ to get the
value of real output of final goods and services per
person.
30. We do not have _____________ enough information
on the output of nonmarket transactions to include it
in the GDP.
31. The most important nonmarket transactions omitted
from GDP are services provided directly
_____________.
32. The value that individuals place on leisure is
_____________ in calculating GDP.
95469_22_Ch22_p603-632.qxd 4/1/07 3:40 PM Page 622

C H A P T E R 2 2
Measuring a Nation’s Production, Income, and Spending
623
current GDP. However, the services provided this year
by real estate agents and used car dealers are currently
produced, so the market value of those services, meas-
ured by real estate agent commissions and the profits
earned by used car dealers, are included in GDP.
4. Why are sales of previously existing inventories
of hula hoops not included in the current year’s
GDP?
Previously existing inventories of any product are not
newly produced and are therefore not included in cur-
rent year GDP. They were already produced and
counted in an earlier period.
22.2 Measuring Total Production
1. What would happen to GDP if consumption pur-
chases (C) and net exports (X
M) both rose, hold-
ing other things equal?
Since GDP is the sum of consumption purchases (C ),
investment purchases (I), government purchases (G),
and net exports (X
M), an increase of any of these
components of GDP will increase GDP, other things
being equal. Since either an increase in consumption
(C ) or an increase in net exports (X
M) increases
GDP, both changing in the same time period will also
increase GDP, other things being equal.
2. Why do you think economic forecasters focus so much
on consumption purchases and their determinants?
Economic forecasters focus so much on consumption
purchases and their determinants because consumption
purchases are by far the largest component (roughly
two-thirds) of GDP; what happens to consumption
purchases is therefore crucial to what happens to GDP.
3. Why are durable goods purchases more unstable than
nondurable goods purchases?
Durable goods purchases are more unstable than non-
durable goods purchases because nondurable goods
are used up in a relatively short period of time; hence,
their purchase is hard to shift from one time period to
another. Durable goods, on the other hand, provide
service for long periods of time, so consumer durable
purchases can be significantly delayed to “make do”
during economic hard times and significantly acceler-
ated during good times.
4. Why does the investment component of GDP include
purchases of new capital goods but not purchases of
company stock?
New capital goods are newly produced goods, by
definition, so they are included in GDP. However,
sales of company stock do not involve a newly pro-
duced good or service (although the services of the
broker, measured by the transaction fee, are included
as a newly produced service). When someone buys
shares of stock from someone else, no goods are being
newly produced. Instead, already existing ownership
claims on the future income of the company are
simply being transferred from one person to another.
5. If Mary received a welfare check this year, would that
transfer payment be included in this year’s GDP? Why
or why not?
GDP includes only currently produced goods and
services. But since transfer payments are not payments
in exchange for newly produced goods and services,
they are not included in GDP.
6. Can inventory investment or net exports ever be
negative?
Yes. If end-of-the-year inventories are smaller than
beginning-of-the-year inventories, inventory invest-
ment is negative, and if the value of exports is smaller
than the value of imports, net exports are negative.
22.3 Other Measures of Total Production and Total Income
1. How is personal income different from national
income?
Personal income, the amount of income available
to spend by consumers, is not the same as national
income, because owners of productive resources
do not receive all of the income that they earn
and they receive “unearned” transfer payments.
Undistributed corporate profits and social insur-
ance taxes, which are not received by the factors of
production, must be subtracted from, and transfer
payments must be added to, national income to get
personal income.
2. What is the difference between GDP and national
income?
To find national income, we must subtract from
GDP: (1) indirect business taxes, such as sales taxes;
(2) depreciation—payments set aside for the replace-
ment of worn-out capital; and (3) net income of for-
eigners in the United States.
22.4 Problems in Calculating an Accurate GDP
1. If we overestimated inflation over time, would our calcu-
lations of real GDP growth be over- or underestimated?
Nominal GDP is deflated by the measure of inflation
being used to calculate real GDP and real GDP
growth. Therefore, for a given nominal GDP growth
rate, overestimating inflation over time would result
in underestimating real GDP growth over time.
2. Why does the consumer price index tend to overstate
inflation if the quality of goods and services is rising
over time?
The consumer price index does not adjust for most
quality increases that take place in goods and serv-
ices. Therefore, higher prices that actually reflect
95469_22_Ch22_p603-632.qxd 4/1/07 3:40 PM Page 623

624
M O D U L E 6
Macroeconomic Foundations
increased quality are counted as higher prices for a
given quality, and as a result the consumer price
index overstates increases in the cost of living.
3. Why would the CPI take into account some goods
imported from other countries, but not take into
account some goods produced domestically, unlike
the GDP deflator?
The CPI measures the prices of goods and services
bought by U.S. consumers, and some goods con-
sumed by U.S. consumers are imported from other
countries. The CPI also fails to take into account
those goods produced domestically that are not pur-
chased by U.S. consumers, such as investment goods
purchased by businesses and military goods bought
by the government. The GDP deflator, on the other
hand, takes into account all the goods produced in
the United States, whether purchased directly by
consumers or not.
4. Why would the growth in real GDP overstate the
growth of output per person in a country with a
growing population?
Real GDP growth measures what happens to output
for the economy as a whole. But if the population is
growing, real GDP is being split among an increasing
number of people, and thus real GDP growth exceeds
per capita real GDP growth.
5. Why doesn’t the consumer price index accurately
adjust for the cost-of-living effects of a tripling in the
price of bananas relative to the prices of other fruits?
The consumer price index assumes that people
continue to consume the same number of bananas as
in the base year (survey period). Therefore, the cost
of the banana component of the consumer price index
triples when the price of bananas triples. However,
in fact, consumers will substitute other fruits that
become relatively cheaper as a result of the banana
price increase; so this component of their cost of
living has not actually increased as fast as banana
prices.
22.5 Problems with GDP as a Measure of Economic Welfare
1. Why do GDP measures omit nonmarket transactions?
GDP measures omit nonmarket transactions because
there is no accurate way to measure the values of
those transactions, unlike for normal market transac-
tions, where market prices can be used to measure the
values involved.
2. How would the existence of a high level of nonmar-
ket activities in one country impact real GDP compar-
isons between it and other countries?
Since nonmarket activities are not included in GDP,
GDP would understate the true value of total output
more for a country with a relatively high level of non-
market activities than for a country with a smaller
proportion of nonmarket activities, making countries
with smaller shares of nonmarket activities look more
productive relative to countries with larger shares of
nonmarket activities.
3. If we choose to decrease our hours worked because
we value the additional leisure time more, will the
resulting change in real GDP accurately reflect the
change in our well-being? Why or why not?
Decreasing hours worked will reduce real GDP, other
things being equal. But if we choose to do so volun-
tarily, that would mean we place a higher value on
the leisure time (which is not counted in GDP) than
on the market output (which is counted in GDP) for-
gone by reducing hours worked, so the change in real
GDP would not accurately reflect the change in our
well-being.
4. How do pollution and crime affect GDP? How do
pollution- and crime-control expenditures impact
GDP?
Neither pollution nor crime are included (as “bads”
to be subtracted) in GDP calculations. However,
market expenditures for pollution and crime control
are included in GDP, as currently produced goods and
services.
95469_22_Ch22_p603-632.qxd 4/1/07 3:40 PM Page 624

True or False
1. Measuring the performance of our economy is important to private businesses and to macroeconomic policymakers
in setting goals and developing policy recommendations.
2. All goods and services exchanged in the current period are included in this year’s GDP.
3. The value of a good or service is determined by the market prices at which goods and services sell.
4. If we counted the value of intermediate goods as well as the full value of the final products in GDP, we would be
double counting.
5. Following the expenditure method, GDP
C I G X.
6. The distinction between whether a good is durable or nondurable is clear and easy to apply.
7. In boom periods, expenditures on consumer durables often increase more than expenditures on nondurables.
8. As incomes have risen, expenditures on services have been growing more slowly than expenditures on goods.
9. The share of total consumption going for services now exceeds 50 percent.
10. Purchases of stock are included as part of investment in the national income accounts.
11. Fixed investments include all spending on capital goods as well as on residential construction.
12. Investment spending is the most volatile category of GDP.
13. Government expenditures on goods and services as a proportion of GDP have grown slowly over the last 30 years.
14. Because exports are consumed in other countries, they are omitted from measures of domestic GDP.
15. Net exports are a small proportion of GDP and are often negative for the United States.
16. When someone makes an expenditure for a good or service, that spending creates income for someone else.
17. The net income of foreigners must be subtracted from GDP to get GNP.
18. National income is a measure of the income earned by owners of resources and available for spending after taxes.
19. The primary problem in calculating accurate U.S. GDP statistics is that the “yardstick” used in adding together the
values of different products, the U.S. dollar, changes in value over time.
20. A price index can be used to deflate current dollar GDP to real GDP expressed in dollars of constant purchasing power.
21. The consumer price index measures the average level of prices of all final goods and services produced in the economy.
22. Our ability to calculate inflation accurately is complicated by changing qualities of goods and services over time and
the creation of new products.
23. Many factors can potentially distort the CPI.
24. One benefit from chain weighting is that it reduces the upward bias of a price index.
25. The PPI is often useful in predicting changes in the CPI.
26. A Porsche produced in Germany and purchased in the United States would show up in the GDP deflator but not
in the CPI.
27. Nominal GDP equals real GDP divided by the price-level index, times 100.
28. In periods of inflation, real GDP will tend to be greater than nominal GDP growth.
29. The measure of economic welfare most often cited is real per capita gross domestic product.
30. In a country with a growing population, real GDP per capita could be falling at the same time that real GDP was rising.
31. Nonmarket transactions, the underground economy, and the value of leisure are all omitted from official measures of GDP.
32. Real GDP is a highly accurate measure of the economic welfare of a nation.
33. Marrying one’s housekeeper would leave reported GDP unchanged.
34. In less-developed countries, where a significant amount of food and clothing output is produced in the home, the fail-
ure to include nonmarket economic activity in GDP is a serious deficiency.
35. Almost all of the underground economy represents income from illegal sources, such as drug dealing.
C
H A P T E R
2 2
S T U D Y
G U I D E
625
625
95469_22_Ch22_p603-632.qxd 16/1/07 2:48 PM Page 625

36. GDP is decreased to reflect pollution resulting from production.
37. Severe shortcomings are involved when using real GDP as a welfare measure. Nonetheless, at the present time, no
alternative measure is generally accepted as better.
Multiple Choice
1. GDP is defined as the
a. value of all final goods and services produced in a country in a period of time.
b. value of all final goods produced in a country in a period of time.
c. value of all goods and services produced in a country in a period of time.
d. value of all final services produced in a country in a period of time.
2. GDP measures
a. the value of all intermediate goods produced domestically within a given period.
b. the value of all final goods and services sold in an economy within a given period.
c. the value of all final goods and services produced domestically within a given period.
d. the government’s domestic product.
3. An example of an intermediate product is
a. the purchase of tires by Ford Motor Company to put on its Ford Explorers.
b. the purchase of wood by a home construction firm.
c. the purchase of leather by a shoe manufacturer.
d. All of the above are examples of intermediate products.
4. Which of the following is not included in the calculated gross domestic product?
a. a new Ford Expedition sport-utility vehicle
b. dinner at Burger King
c. a construction firm’s purchase of lumber to build a four-bedroom home
d. the purchase of a newly constructed home
5. GDP is calculated including
a. intermediate products but not final products.
b. manufactured goods but not services.
c. final products but not intermediate products.
d. only goods purchased by consumers in a given year.
6. The expenditure measure of GDP accounting adds together
a. consumption, interest, government purchases, and net exports.
b. consumption, government purchases, wages and salaries, and net exports.
c. consumption, investment, government purchases, and net exports.
d. wages and salaries, rent, interest, and profits.
e. wages and salaries, rent, investment, and profits.
7. Which category of consumption spending tends to be the most unstable over the business cycle?
a. nondurable consumer goods
b. durable consumer goods
c. services
d. All of these categories of consumer spending are highly unstable over the business cycle.
8. Which of the following are most likely to be classified by economists as consumer durable goods?
a. stocks, bonds, EE savings bonds, CDs (certificates of deposit)
b. automobiles, furniture, CD players
c. drugs, toys, magazines, books
d. food, clothing, shelter
626
95469_22_Ch22_p603-632.qxd 16/1/07 2:49 PM Page 626

9. Investment includes
a. fixed investment.
b. fixed investment plus government investment.
c. fixed investment plus additions to business inventories.
d. fixed investment plus subtractions from business inventories.
e. fixed investment plus government investment plus additions to business inventories.
10. Included in the investment category under the expenditure approach to GDP accounting is (are)
a. additions to inventory.
b. machines and tools.
c. newly constructed residential housing.
d. all of the above.
11. Which of the following is not included in government purchases?
a. government purchases of investment goods
b. transfer payments
c. government spending on services
d. None of the above is included in government purchases.
e. Neither b nor c is included in government purchases.
12. A negative amount of net exports in the GDP expenditures accounting means
a. exports are less than imports.
b. imports are less than exports.
c. the sum of this period’s exports and imports has declined from the previous period.
d. net exports have declined from the previous period.
e. none of the above.
13. We can be certain that net exports fall if
a. both exports and imports rise.
b. both exports and imports fall.
c. exports rise and imports fall.
d. exports fall and imports rise.
e. either b or d occurs.
14. French perfume that is purchased in the United States is accounted for in which expenditure category of U.S. GDP?
a. consumption
b. investment
c. government purchases
d. net exports
e. none of the above
15. If the United States imported $1.5 billion worth of goods and services and sold $2.9 billion worth of goods and services
outside its borders, net exports would equal
a.
$4.4 billion.
b. $4.4 billion.
c. $1.4 billion.
d.
$1.4 billion.
e. none of the above.
16. The largest category of GDP is
, and the most unstable category of GDP is
.
a. consumption, consumption
b. government, investment
c. consumption, investment
d. consumption, government purchases
e. investment, consumption
627
95469_22_Ch22_p603-632.qxd 16/1/07 2:49 PM Page 627

17. Which of the following will be counted as part of this year’s U.S. GDP?
a. goods produced last year but not sold until this year
b. goods produced this year by an American working in Paris
c. purchases of Cisco Systems stock (not issued this year) that take place this March
d. sales of used lawn mowers that take place this year
e. none of the above
18. In the income approach to measuring GDP, factor payments do not include
a. wages and salaries for the use of labor services.
b. rent for land.
c. interest payments for the use of capital goods.
d. profits for entrepreneurs.
e. All of the above are included as factor payments.
19. Which of the following is not considered a factor payment?
a. wages
b. interest
c. rent
d. profit
e. transfer payments
20. What is not subtracted from GDP to get national income?
a. the net income of foreigners
b. depreciation
c. indirect business taxes
d. personal income taxes
e. All of the above are subtracted from GDP to get national income.
21. Disposable income is
a. a measure of the market value of total output.
b. a measure of the income households have to spend before paying taxes.
c. a measure of the income households have to spend after paying taxes.
d. a measure of household income from investment income, such as dividends and capital gains.
22. Disposable personal income will increase when
a. taxes rise and transfer payments rise.
b. taxes rise and transfer payments fall.
c. taxes fall and transfer payments rise.
d. taxes fall and transfer payments fall.
23. The CPI is a measure of
a. the overall cost of goods and services produced in the economy.
b. the overall cost of inputs purchased by a typical producer.
c. the overall cost of goods and services bought by a typical consumer.
d. the overall cost of stocks on the New York Stock Exchange.
24. If the consumer price index was 100 in the base year and 110 in the following year, the inflation rate was
a. 110 percent.
b. 100 percent.
c. 11 percent.
d. 10 percent.
25. The current cost of a market basket of goods is $6,000. The cost of the same basket of goods in the base year was
$4,000. The current price index is
a. 600.
b. 160.
628
95469_22_Ch22_p603-632.qxd 16/1/07 2:49 PM Page 628

c. 150.
d. 133.
e. 66.7.
26. The CPI overestimates changes in the cost of living because
a. the growth of discount stores where consumers can obtain goods at discount prices has not been adequately
represented in the construction of the CPI.
b. the CPI does not adequately deal with changes in the quality of products over time.
c. the CPI deals with a fixed market basket and doesn’t capture the savings households enjoy when they substitute
cheaper alternatives in response to a price change.
d. of all of the above.
27. Which measures of inflation tend to overstate it?
a. the CPI, but not the GDP deflator
b. the GDP deflator, but not the CPI
c. both the GDP deflator and the CPI
d. neither the GDP deflator nor the CPI
28. The cost of an aircraft carrier produced domestically would be included in
a. the CPI, but not the GDP deflator.
b. the GDP deflator, but not the CPI.
c. both the GDP deflator and the CPI.
d. neither the GDP deflator nor the CPI.
29. Nominal GDP is
a. the base year market value of all final goods and services produced domestically during a given period.
b. the current year market value of all final goods and services produced domestically during a given period.
c. usually less than real GDP.
d. the current year market value of domestic production of intermediate goods.
e. none of the above.
30. Nominal GDP differs from real GDP in that
a. nominal GDP tends to increase when total production of output in the economy increases, while real
GDP does not.
b. nominal GDP is measured in base year prices, while real GDP is measured in current year prices.
c. nominal GDP is measured in current year prices, while real GDP is measured in base year prices.
d. real GDP excludes taxes paid to the government, while nominal GDP does not.
31. The consumer price index
a. takes government purchases into account, unlike the GDP deflator.
b. takes business investment purchases into account, unlike the GDP deflator.
c. equals 100 in the base year, unlike the GDP deflator.
d. is generally used to adjust nominal GDP to calculate real GDP.
e. None of the above is true.
32. Real GDP in base year dollars equals
a. nominal GDP divided by the price index, times 100.
b. nominal GDP divided by the price index.
c. nominal GDP times the price index.
d. nominal GDP times the price index, divided by 100.
e. none of the above.
33. Suppose that nominal GDP in 2000 equals $8,000 trillion and that in 2001 nominal GDP equals $8,500 trillion.
It can be concluded that
a. total production of output decreased from 2000 to 2001.
b. total production of output increased from 2000 to 2001.
629
95469_22_Ch22_p603-632.qxd 16/1/07 2:49 PM Page 629

c. the economy experienced inflation from 2000 to 2001.
d. the economy experienced deflation from 2000 to 2001.
e. None of the above is true.
34. If real GDP increases and population increases, then real GDP per capita
a. will rise.
b. will fall.
c. will remain unchanged.
d. could either rise, fall, or remain unchanged.
35. If nominal GDP rises from $5 billion to $6 billion, when the GDP deflator goes from 100 to 120, real GDP
a. rises.
b. falls.
c. stays the same.
d. could either be rising or falling.
36. Important factors that are excluded from GDP measurements include
a. leisure.
b. the underground economy.
c. nonmarket transactions.
d. the value of changes in the environment.
e. all of the above.
37. Which of the following is measured in per capita GDP?
a. leisure
b. underground economic transactions
c. the services of homemakers
d. external benefits and costs
e. none of the above
38. If country A has a bigger underground economy than country B, and country A’s citizens work fewer hours per week
than the citizens of country B, other things being equal, then
a. GDP comparisons between the countries would overstate the economic welfare of country A compared to B.
b. GDP comparisons between the countries would understate the economic welfare of country A compared to B.
c. it is impossible to know which direction GDP comparisons between the countries would be biased as measures of
the economic welfare of the two countries.
d. it would not introduce any bias in using GDP to compare economic welfare between the countries.
e. none of the above would be true.
Problems
1. Answer the following questions about GDP:
a. What is the definition of GDP?
b. Why does GDP measure only the final value of goods and services?
c. Why does GDP measure only the value of goods and services produced within a country?
d. How does GDP treat the sales of used goods?
e. How does GDP treat sales of corporate stock from one stockholder to another?
2. Which of the following are included in GDP calculations?
a. cleaning services performed by Molly Maid Corporation
b. lawn-mowing services performed by a neighborhood child
c. drugs sold illegally on a local street corner
630
95469_22_Ch22_p603-632.qxd 16/1/07 2:50 PM Page 630

d. prescription drugs manufactured in the United States and sold at a local pharmacy
e. a rug woven by hand in Turkey
f.
air pollution that diminishes the quality of the air you breathe
g. toxic-waste cleanup performed by a local company
h. car parts manufactured in the United States for a car assembled in Mexico
i.
a purchase of 1,000 shares of IBM stock
j.
monthly Social Security payment received by a retiree
3. To which category of U.S. GDP expenditure does each of the following correspond?
a. Department of Motor Vehicles services
b. automobiles exported to Europe
c. a refrigerator
d. a newly constructed four-bedroom house
e. a restaurant meal
f.
additions to inventory at a furniture store
g. F-16 fighter jets built by a U.S. aerospace corporation and contracted for by the government
h. a new steel mill
4. The expenditures on tires by the Ford Motor Company are not included directly in GDP statistics while consumer
expenditures on replacement tires are included. Why?
5. Using any relevant information below, calculate GDP using the expenditure approach.
Inventory investment
$50 billion
Fixed investment
$120 billion
Consumer durables
$420 billion
Consumer nondurables
$275 billion
Interest
$140 billion
Indirect business taxes
$45 billion
Government wages and salaries
$300 billion
Government purchases of goods and services
$110 billion
Imports
$80 billion
Exports
$40 billion
Profits
$320 billion
Services
$600 billion
6. Fill in the missing data for the following table (in billions):
Consumption:
Consumption of durable goods: $1,200
Consumption of nondurable goods: $1,800
Consumption of services: $2,400
Investment:
Fixed investment: $800
Inventory investment: $600
Government expenditures on goods and services: $1,600
Government transfer payments: $500
Exports: $500
Imports: $650
Net exports:
GDP:
631
95469_22_Ch22_p603-632.qxd 16/1/07 2:51 PM Page 631

7. Fill in the missing data for the following table:
Nominal GDP
Real GDP
Year
GDP Deflator
(in billions)
(in billions)
1997
90.9
$7,000
1998
100
$8,000
1999
$10,000
$8,000
2000
140
$14,000
2001
150
$12,000
8. Nominal GDP in Nowhereland in 2005 and 2006 is as follows:
NGDP 2005
NGDP 2006
$4 trillion
$4.8 trillion
Can you say that the production of goods and services in Nowhereland has increased between 2005 and 2006? Why
or why not?
9. Calculate a price index for 2005, 2006, and 2007 using the following information about prices. Let the market
basket consist of one pizza, two sodas, and three video rentals. Let the year 2005 be the base year (with an index
value of 100).
Price of
Price of
Price of a
Year
a Pizza
a Soda
Video Rental
2005
$9.00
$0.50
$2.00
2006
$9.50
$0.53
$2.24
2007
$10.00
$0.65
$2.90
How much inflation occurred between 2005 and 2006? Between 2005 and 2007?
10. Say that the bundle of goods purchased by a typical consumer in the base year consisted of 20 gallons of milk at a price
of $1 per gallon and 15 loaves of bread at a price of $2 per loaf. What would the price index be in a year in which
a. milk cost $2 per gallon and bread cost $1 per loaf?
b. milk cost $3 per gallon and bread cost $2 per loaf?
c. milk cost $2 per gallon and bread cost $4 per loaf?
11. Indicate which of the following are true of the CPI and the GDP deflator:
CPI
GDP Deflator
Chain weighted
Tends to overstate inflation
More volatile
Will reflect the cost of building
an aircraft carrier domestically
Reflects the cost of imported
consumer goods
Reflects prices charged in the
underground economy
632
95469_22_Ch22_p603-632.qxd 16/1/07 2:51 PM Page 632
Wyszukiwarka
Podobne podstrony:
Exploring Economics 3e Chapter 22
Exploring Economics 4e Chapter 09
Exploring Economics 4e Chapter 18
Exploring Economics 4e Chapter 30
Exploring Economics 4e Chapter 07
Exploring Economics 4e Chapter 11
Exploring Economics 4e Chapter 17
Exploring Economics 4e Chapter 13
Exploring Economics 4e Chapter 10
Exploring Economics 4e Chapter 14
Exploring Economics 4e Chapter 27
Exploring Economics 4e Chapter 25
Exploring Economics 4e Chapter 29
Exploring Economics 4e Chapter 15
Exploring Economics 4e Chapter 23
Exploring Economics 4e Chapter 31
Exploring Economics 4e Chapter 26
Exploring Economics 4e Chapter 24
Exploring Economics 4e Chapter 32
więcej podobnych podstron