
31
C H A P T E R
conomics is largely about exchange. But up to
this point we have focused on trade between
individuals within the domestic economy. In
this chapter, we extend our coverage to inter-
national trade. Why do countries trade? Hong
Kong has no oil—how are they going to get it?
What is comparative advantage? Bananas could be
grown in the most tropical parts of the United
States or in expensive greenhouses, but wouldn't it
be easier to import bananas from Honduras?
Stop for a moment and imagine a world with-
out international trade. Chocolate is derived from
cocoa beans that are imported from South America
and Africa. There are imported cars from Germany
and Japan, shoes and sweaters from Italy, shirts from
India, and watches and clocks from Switzerland.
Consumers love trade because it provides us with
more choices. It is good for producers, too; and the
speed of transportation and communication has
opened up world markets. In addition, lower costs
are sometimes the result of economies of scale.
Free trade gives firms access to large world mar-
kets. It also fosters more competition, which helps
to keep prices down.
In this chapter, we will study the theoretical rea-
sons for the importance of trade. We will also look at
the arguments for and against trade protection.
■
31.1
The Growth in World Trade
31.2
Comparative Advantage and Gains
from Trade
31.3
Supply and Demand in International
Trade
31.4
Tariffs, Import Quotas, and Subsidies
E
I
N T E R N A T I O N A L
T
R A D E
I
N T E R N A T I O N A L
T
R A D E
95469_31_Ch31-p897-930.qxd 5/1/07 10:43 AM Page 899

900
M O D U L E 8
International Trade and Finance
IMPORTANCE OF INTERNATIONAL TRADE
In a typical year, about 15 percent of the world’s
output is traded in international markets. Of course,
the importance of the international sector varies
enormously from place to place across the world.
Some nations are virtually closed economies (no inter-
action with other economies), with foreign trade equal-
ing only a small proportion (perhaps 5 percent) of total
output, while in other countries, trade is much more
important. In the last three decades, the sum of U.S.
S E C T I O N
31.1
T h e G r o w t h i n W o r l d Tr a d e
■
What has happened to the volume of
international trade over time?
■
Who trades with the United States?
■
What does the United States export? Import?
Major U.S. Trading Partners
S E C T I O N
3 1 .1
E
X H I B I T
1
Top Five Trading Partners—Exports of Goods in 2005
Rank
Country
Percent of Total
1
Canada
23.4%
2
Mexico
13.3
3
Japan
6.1
4
China
4.6
5
United Kingdom
4.3
Top Five Trading Partners—Imports of Goods in 2005
Rank
Country
Percent of Total
1
Canada
16.9%
2
China
15.0
3
Mexico
10.0
4
Japan
8.2
5
Germany
5.0
SOURCE: CIA, The World Factbook 2006.
Demand Shifts
S E C T I O N
3 1 .1
E
X H I B I T
2
Top Imports (billions of dollars)
$8.6 Shoes
6.1 Toys
5.6 Input-output units
5.1 Data-processing machine parts
3.2 VCRs
2.6 Wood furniture
2.0 Transmission equipment
1.7 Data-storage units
1.6 Christmas items
1.6 Video games
1.6 Telephone sets
1.4 Sweaters and pullovers
Top Imports (percentage of all imports)
88% Radios
87
Christmas and festive items
83
Toys
70
Leather goods
67
Shoes
67
Handbags
65
Lamps and lights
64
Cases for cameras, eyeglasses, etc.
60
Drills, power tools
56
Household plastics
54
Sporting goods
53
Ceramic kitchenware
The United States Stocking Up on Chinese Goods
©
F
eder
al Reser
v
e Bank of Dallas
You don’t have to shop at Pier 1 Imports to see “Made In China.” A trip to just about any major U.S. retailer—
Wal-Mart, Best Buy, Toys “R” Us, Banana Republic—will turn up troves of Chinese imports that we enjoy in every-
day life. It adds up to roughly 10 percent of overall U.S. imports, up from just 0.5 percent in 1980. The United
States gets 88% of imported radios from China and 83% of imported toys. In 2002, the United States imported
$8 billion worth of shoes from China. What would we do without China? Pay more and have less, that’s for sure.
SOURCE: Federal Reserve Bank of Dallas, Annual Report 2002.
95469_31_Ch31-p897-930.qxd 5/1/07 10:43 AM Page 900

C H A P T E R 3 1
International Trade
901
imports and exports has increased from 11 percent of
GDP to roughly 30 percent. In addition, incoming
and outgoing investments (capital flows) have risen
from less than 1 percent to roughly 3 percent of GDP.
In Germany, roughly 30 percent of all output pro-
duced is exported, while Ireland and Belgium each
export more than 70 percent of GDP.
U.S. exports include capital goods, automobiles,
industrial supplies, raw materials, consumer goods,
and agricultural products. U.S. imports include crude
oil and refined petroleum products, machinery, auto-
mobiles, consumer goods, industrial raw materials,
food, and beverages.
TRADING PARTNERS
In the early history of the United States, international
trade largely took place with Europe and with Great
Britain in particular. Now the United States trades
with a number of countries, the most important of
which are shown in Exhibit 1. The single most impor-
tant U.S. trading partner is Canada, accounting for
roughly one-fifth of imports and one-fourth of exports.
Trade with Japan, Mexico, Germany, China, Taiwan,
and the United Kingdom is also particularly impor-
tant. Exhibit 2 illustrates the significance of U.S. trade
with China.
S E C T I O N
*
C H E C K
1.
The volume of international trade has increased substantially in the United States over the last 30 years. During
that time, exports and imports have grown from 11 percent to 30 percent of GDP.
2.
Our single most important trading partner, Canada, accounts for roughly one-fourth of our exports and almost
one-fifth of our imports. Trade with Japan, Mexico, China, Germany, the United Kingdom, France, and Taiwan is also
particularly important to the United States.
3.
U.S. exports include capital goods, automobiles, industrial supplies, raw materials, consumer goods, and agricultural
products. U.S. imports include crude oil and refined petroleum products, machinery, automobiles, consumer goods,
industrial raw materials, food, and beverages.
1.
Why is it important to understand the effects of international trade?
2.
Why would U.S. producers and consumers be more concerned about Canadian trade restrictions than Swedish
trade restrictions?
ECONOMIC GROWTH AND TRADE
Using simple logic, we conclude that the very existence
of trade suggests that trade is economically beneficial.
Our conclusion is true if we assume that people are
utility maximizers and are rational, are intelligent, and
engage in trade on a voluntary basis. Because almost all
trade is voluntary, it would seem that trade occurs
because the participants feel that they are better off
because of the trade. Both participants in an exchange
of goods and services anticipate an improvement in
their economic welfare. Sometimes, of course, anticipa-
tions are not realized (because the world is uncertain);
but the motive behind trade remains an expectation of
some enhancement in utility or satisfaction by both
parties.
S E C T I O N
31.2
C o m p a r a t i v e A d v a n t a g e
a n d G a i n s f r o m Tr a d e
■
Does voluntary trade lead to an improvement
in economic welfare?
■
What is the principle of comparative
advantage?
■
What benefits are derived from
specialization?
95469_31_Ch31-p897-930.qxd 5/1/07 10:43 AM Page 901

902
M O D U L E 8
International Trade and Finance
Granted, “trade must be good because people
do it” is a rather simplistic explanation. The classical
economist David Ricardo is usually given most of the
credit for developing the economic theory that more
precisely explains how trade can be mutually beneficial
to both parties, raising output and income levels in
the entire trading area.
THE PRINCIPLE OF COMPARATIVE ADVANTAGE
Ricardo’s theory of international trade centers on the
concept of comparative advantage. Persons, regions,
or countries can gain by specializing in the production
of the good in which they have a comparative
advantage. That is, if they can produce a good or
service at a lower oppor-
tunity cost than others,
we say that they have a
comparative advan-
tage
in the production
of that good or service.
In other words, a coun-
try or a region should
specialize in producing
and selling those items that it can produce at a lower
opportunity cost than other regions or countries.
David Ricardo (1772–1823)
David Ricardo was born in London to a wealthy, Jewish immigrant stockbro-
ker, the third of 17 children. His father trained him in the stock brokerage
business, which he entered at age 14. At 21, he married a young Quaker
woman, leaving the Jewish faith to become a Unitarian. This upset his
father, who disowned David. The young Ricardo joined a bank and entered
the stock market on his own. He was very successful in this enterprise,
making millions of pounds and quickly surpassing the wealth accumulated
by his father, with whom he later reconciled. Ricardo retired from the stock
exchange business at age 43 and died of an ear infection at 51, leaving
behind a large fortune.
Ricardo could accredit much of his success in the stock market to his bril-
liant ability to predict human nature and public reaction. As a member of the
House of Commons, he was also an undaunted advocate of government
reform, religious and political freedom, and free trade. A man of firm convic-
tions, he often lobbied for class-leveling policies that conflicted with his per-
sonal interests as a landowner and a man of wealth.
In his late 20s, while vacationing in Bath, England, Ricardo picked up
a copy of Adam Smith’s The Wealth of Nations and became interested in
economics. It was a few years later that Ricardo, who had no formal edu-
cation past age 14, improved upon Smith’s principle of absolute advantage.
Ricardo’s ideas, though difficult for many of his fellow politicians to under-
stand, were ingenious.
Smith argued that two countries should engage in trade if one was
better at producing one good than the other—absolute advantage. For exam-
ple, if one country is better at producing hats and the other at producing
shoes, the two countries can produce more total output by producing those
goods that they can produce best. However, Ricardo demonstrated that even
if one country was absolutely more productive than another in making all
goods and services, it would still be mutually beneficial for the two coun-
tries to engage in trade, as each had a comparative advantage in one of
the goods.
Ricardo argued this point at a time in British history when the wealthy
landowners, who had a clutch on parliament, had a virtual monopoly on grain
in England in the form of the Corn Laws, passed in 1815. These acts prevented
the importation of grain from France, although, as Ricardo argued, France
could afford to feed the British for less than it would cost them to feed them-
selves. Despite Ricardo’s argument and the fact that English laborers were
spending one-fourth of their income on bread, the Corn Laws persisted until
1846. Ricardo did, however, leave behind a remarkable concept that convinced
future economists that free trade is almost always in the best interest of an
economy as a whole.
©
Hulton Archiv
e/Getty Images
g r e a t e c o n o m i c t h i n k e r s
comparative
advantage
occurs when a person or country
can produce a good or service at a
lower opportunity cost than others
95469_31_Ch31-p897-930.qxd 5/1/07 10:43 AM Page 902
C H A P T E R 3 1
International Trade
903
Comparative advantage analysis does not mean
that nations or areas that export goods will necessarily
be able to produce those goods or services more
cheaply than other nations in an absolute sense. What
is important is comparative advantage, not absolute
advantage. For example, the United States may be
able to produce more cotton cloth per worker than
India can, but this capability does not mean that the
United States should necessarily sell cotton cloth to
India. For a highly productive nation to produce
goods in which it is only marginally more produc-
tive than other nations, the nation must take
resources from the production of other goods in
which its productive abilities are markedly superior.
As a result, the opportunity costs in India of making
cotton cloth may be less than in the United States.
With that, both can gain from trade, despite poten-
tial absolute advantages for every good in the
United States.
COMPARATIVE ADVANTAGE AND THE PRODUCTION
POSSIBILITIES CURVE
In Exhibit 1, we see the production possibilities
curves for two individuals, Wendy and Calvin. Wendy
and Calvin can produce either food or cloth. We see
that if Wendy devotes all her resources to producing
food, she can produce 30 pounds of food; if she
devotes all her resources to producing cloth, she can
produce 10 yards of cloth. We also see that when
Calvin uses all his resources to produce food, he only
using what you’ve learned
Comparative Advantage
and Absolute Advantage
Renee, a successful artist, can complete one painting in each
40-hour workweek. Each painting sells for $4,000. As a result of her
enormous success, however, Renee is swamped in paperwork. To solve the
problem, Renee hires Drake to handle all the bookkeeping and typing associ-
ated with buying supplies, answering inquiries from prospective buyers and
dealers, writing art galleries, and so forth. Renee pays Drake $300 per week
for his work. After a couple of weeks in this arrangement, Renee realizes that
she can handle Drake’s chores more quickly than Drake does. In fact, she esti-
mates that she is twice as fast as Drake, completing in 20 hours what it takes
Drake 40 hours to complete. Should Renee fire Drake?
Clearly, Renee has an absolute advantage over Drake in both paint-
ing and paperwork, because she can do twice as much paperwork in
40 hours as Drake can and Drake can’t paint well at all. Still, it would be
foolish for Renee to do both jobs. If Renee did her own paperwork, it would
take her 20 hours per week, leaving her only 20 hours to paint. Because each
watercolor takes 40 hours to paint, Renee’s output would fall from one paint-
ing per week to one painting per two weeks.
When Drake works for her, Renee’s net income is $3,700 per week
($4,000 per painting minus $300 in Drake’s wages); when Drake does not
work for her, it is only $2,000 per week (one painting every two weeks).
Even though Renee is both a better painter and better at Drake’s chores
than Drake, it pays for her to specialize in painting, in which she has a
comparative advantage, and allow Drake to do the paperwork. The
opportunity cost to Renee of paperwork is high. For Drake, who lacks
skills as a painter, the opportunity costs of doing the paperwork are
much less.
Q
A
Specialization and Trade
S E C T I O N
3 1 . 2
E
X H I B I T
1
Food (pounds)
Cloth (yards)
0
30
20
15
10
7.5
7.5 10 15
20
30
C
B
A
Wendy's
PPC
Calvin's
PPC
Total production
with specialization
Production per person
after specialization
and trade
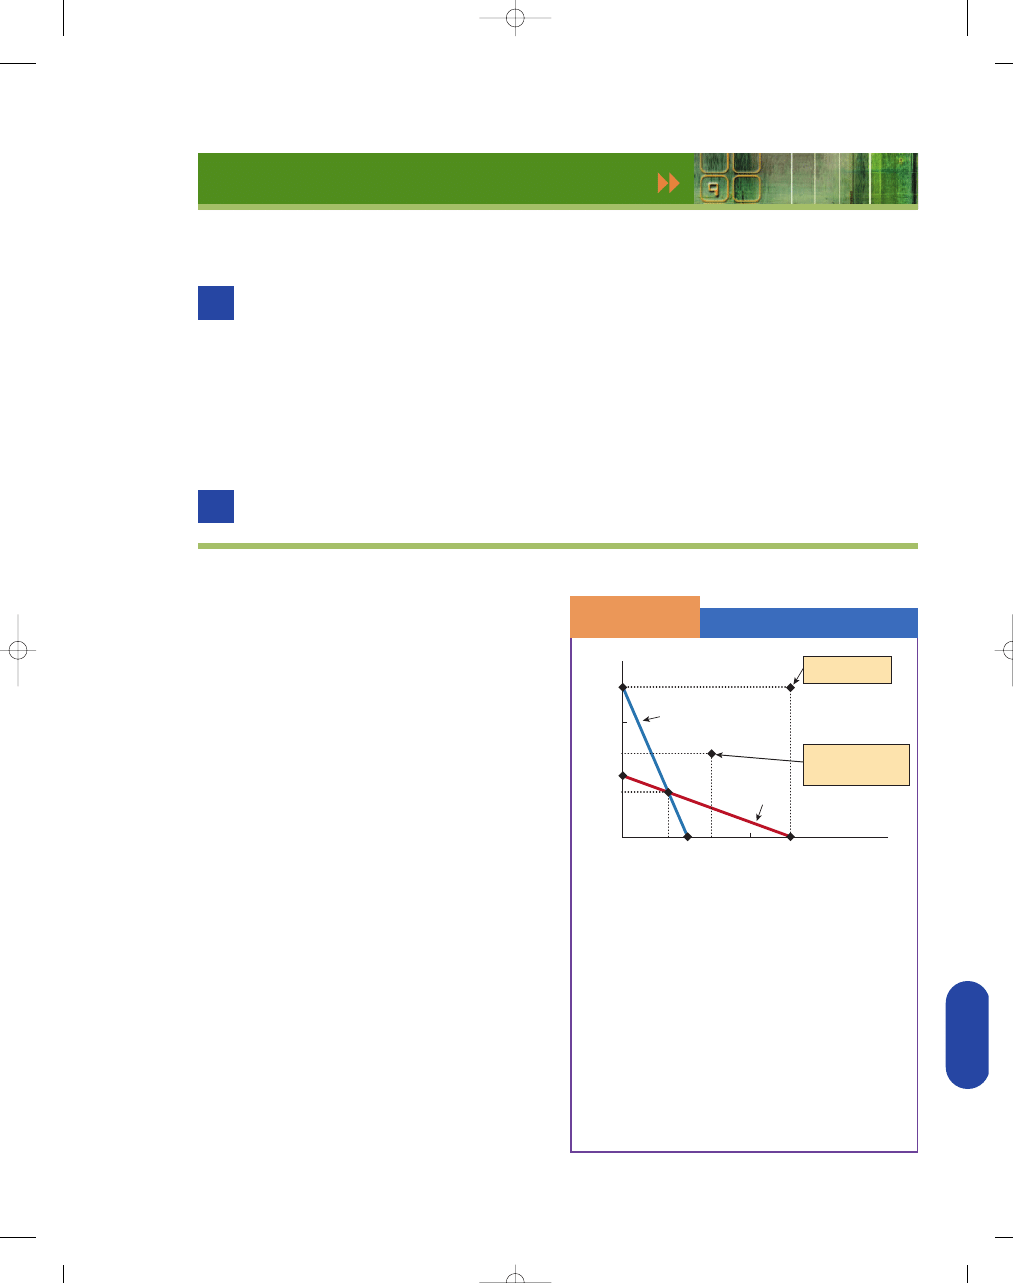
Before Trade
Point A—Without specialization, say that Wendy and
Calvin each choose to produce 7.5 pounds of food
and 7.5 yards of cloth.
Specialization and Trade
Point B—Wendy and Calvin’s total production if they
specialize: Wendy produces 30 pounds of food, and
Calvin produces 30 yards of cloth.
Point C—If Wendy and Calvin split equally their
total production after specialization, they will
each have 15 pounds of food and 15 yards
of cloth.
95469_31_Ch31-p897-930.qxd 5/1/07 10:43 AM Page 903

904
M O D U L E 8
International Trade and Finance
produces 10 pounds; but when he uses all his resources
to produce cloth, he can produce 30 yards. In this
example, then, Wendy actually has an absolute advan-
tage in food, while Calvin has an absolute advantage
in cloth. However, as we shall see, it would not affect
the result if Calvin could only produce 2 pounds of
food and 6 yards of cloth.
For simplicity, let’s assume that each producer
operates on a straight-line production possibilities
curve (PPC) and that each initially chooses to divide
her or his productive resources between these products
to produce 7.5 pounds of food and 7.5 yards of
cloth—although any amount of each good within their
respective PPCs could have been produced.
Wendy can produce food at a lower opportunity
cost than Calvin. When Wendy produces 30 pounds
of food, it costs only 10 yards of cloth. However,
when Calvin produces only 10 pounds of food, it
costs 30 yards of cloth. Wendy, then, can produce
food at a lower opportunity cost than Calvin, but
Calvin can produce cloth at a lower opportunity cost
than Wendy. When Calvin produces 30 yards of
cloth, it costs him 10 pounds of food; and when
Wendy produces 10 yards of cloth, it costs 30 pounds
of food. Calvin, then, is the lowest-cost producer
of cloth.
To demonstrate our point about comparative
advantage, we have overlapped the two production
possibility curves in Exhibit 1. At point A, we see that
Wendy produces 7.5 pounds of food and 7.5 yards
of cloth, and Calvin produces 7.5 yards of cloth and
7.5 pounds of food. However, if each specialized and
pursued his or her comparative advantage—the goods
each can produce at the lowest opportunity cost—
then Wendy could produce 30 pounds of food and
Calvin could produce 30 yards of cloth, point B. That
is, by specializing, Wendy and Calvin have produced
30 units of each good rather than 15 units, using the
same amount of total resources. Now if Wendy does
not want all food and Calvin does not want all cloth,
they can trade with each other. In fact, if Wendy
trades half of her food for half of Calvin’s cloth, then
each will have 15 units of food and cloth. This is 7.5
more pounds of food and 7.5 more yards of cloth
than they had before specialization and trade. That is,
if they choose to consume equal amounts of both
products, after specialization and trade, their new
consumption point is at point C—outside their origi-
nal PPCs.
By specializing in products in which they have a
comparative advantage, individuals, regions, and coun-
tries can increase their total production—and it is trade
that allows people to specialize in those activities they
do best. Follow the adage: do what you do best and
trade for the rest.
REGIONAL COMPARATIVE ADVANTAGE
Using a production possibilities curve, we saw how
Wendy and Calvin could benefit from specialization
and trade. The principle of comparative advantage
can be applied to regional markets as well. In fact,
trade has evolved in large part because different
geographic areas have different resources and there-
fore different production possibilities. The impact of
trade between two areas with differing resources is
shown in Exhibit 2. To keep the analysis simple, sup-
pose two trading areas can produce only two com-
modities, grain and computers. A “trading area” may
be a locality, a region, or even a nation, but for our
example suppose we think in terms of two hypotheti-
cal regions, Grainsville and Techland.
Grainsville and Techland have various potential
combinations of grain and computers that they can
produce. For each region, the cost of producing more
grain is the output of computers that must be forgone,
and vice versa. We see in Exhibit 2 that Techland can
produce more grain (40 bushels) and more comput-
ers (100 units) than Grainsville can (30 bushels and
30 units, respectively), perhaps reflecting superior
Production Possibilities,
Techland and Grainsville
S E C T I O N
3 1 . 2
E
X H I B I T
2
Grain
Computers
Region
(bushels per day)
(units per day)
Techland
0
100
10
75
20
50
30
25
40
0
Grainsville
0
30
6
24
12
18
18
12
24
6
30
0
Before Specialization
Techland
10
75
Grainsville
18
12
Total
28
87
After Specialization
Techland
0
100
Grainsville
30
0
Total
30
100
95469_31_Ch31-p897-930.qxd 5/1/07 10:43 AM Page 904

C H A P T E R 3 1
International Trade
905
using what you’ve learned
The Secret to Wealth
Do what you do best. Trade for the rest. In other words, specialize and then trade.
The farmer grows wheat, the baker makes bread, the weaver produces
cloth, the tailor sews clothing, the lumberjack harvests wood, the carpenter
builds houses. By exchanging the fruits of their labor in the marketplace, they
all can enjoy more food, clothing and shelter than they could if each tried to
meet his needs in isolation. . . .
It’s a matter of working smarter, not harder.
Societies reaped the benefits of specialization and trade for thousands
of years before English economist David Ricardo (1772–1823) finally demon-
strated why it works. His theory of comparative advantage helps explain why
the United States exports soybeans to China and imports shoes in return.
Suppose an average American worker can produce 100 bushels of soy-
beans or five pairs of shoes and a typical Chinese worker can turn out 8
bushels of soybeans or four pairs of shoes. [See Exhibit 3.]
The United States is more productive than China in both industries, but
consumers in both countries can still gain from specialization and trade.
Shifting a U.S. worker from shoe factory to soybean farm produces a gain of
100 bushels of soybeans at the cost of five pairs of shoes. Shifting two Chinese
workers from farm to factory raises shoe output by eight pairs but cuts soy-
bean production by 16 bushels. The net effect is an increase of 84 bushels of
soybeans and three pairs of shoes.
Total output of both products reaches a maximum when the United
States specializes in soybeans and China in shoes. Through trade, the two
countries can divide the added production between themselves, leaving both
better off than they were on their own.
In the real world, trade isn’t a two-party swap meet. The United States
does business with more than 225 other nations—from Albania to Zimbabwe.
The dizzying number of potential transactions increases the opportunities to
gain from trade.
This potent international division of labor enables America to take advantage
of its expertise in such industries as jet-aircraft manufacturing and financial services
while other countries exploit their edge in oil production or hand assembly.
Specialization and trade arise out of the profit motive. Except when
transaction costs are too high or governments impose barriers, buyers and
sellers will find each other. We’re not meant to go it alone.
SOURCE: W. Michael Cox and Richard Alm “The Secret of Wealth,” 2002 Annual
Report: The Fruits of Free Trade, Federal Reserve Bank of Dallas.
The Alchemy of Exchange
S E C T I O N
3 1 . 2
E
X H I B I T
3
Autarky
Free Trade
China
U.S.
China
U.S.
Labor Force
500
100
500
100
Output per worker
Shoes
4
5
4
5
Soybeans
8
100
8
100
Employment
Shoes
125
60
500
0
Soybeans
375
40
0
100
Production
Shoes
500
300
2,000
0
Soybeans
3,000
4,000
0
10,000
Consumption
Shoes
500
300
1,500
500
Soybeans
3,000
4,000
5,000
5,000
Consumption per person
Shoes
1
3
3
5
Soybeans
6
40
10
50
Five hundred Chinese workers can each produce four pairs of shoes or 8 bushels of soybeans. One hundred U.S.
workers can each produce five pairs or 100 bushels—more productive in both jobs but comparatively more so in
farming. Under an autarkic regime—isolated from foreign trade—Chinese workers can afford one pair of shoes
each and 6 bushels of soybeans; Americans, three and 40. Trading freely, China will specialize in shoes and America
in soybeans, raising world production of shoes from 800 to 2,000 pairs and soybeans from 7,000 to 10,000 bushels.
Chinese workers can then afford three pairs of shoes and 10 bushels of soybeans; American workers, five and 50. In
this case, the United States trades 10 bushels of soybeans to China for each pair of shoes.
95469_31_Ch31-p897-930.qxd 5/1/07 10:43 AM Page 905

906
M O D U L E 8
International Trade and Finance
resources (more or better labor, more land, and so on).
These numbers mean that Techland has an absolute
advantage in both products.
Suppose that, before specialization, Techland
chooses to produce 75 computers and 10 bushels of
grain per day. Similarly, suppose Grainsville decides
to produce 12 computers and 18 bushels of grain.
Collectively, then, the two areas are producing 87 com-
puters (75
12) and 28 bushels of grain (10 18) per
day before specialization.
Now, suppose the two nations specialize. Techland
decides to specialize in computers and devotes all its
resources to making that product. As a result, com-
puter output in Techland rises to 100 units per day,
some of which is sold to Grainsville. Grainsville, in
turn, devotes all its resources to grain, producing
30 bushels of grain per day and selling some of it to
Techland. Together, the two areas are producing more
of both grain and computers than before—100
instead of 87 computers and 30 instead of 28 bushels
of grain. Both areas could, as a result, have more of
both products than before they began specializing and
trading.
How can this happen? In Techland, the opportu-
nity cost of producing grain is high—25 computers
must be forgone to get 10 more bushels of grain. The
cost of one bushel of grain, then, is 2.5 computers (25
divided by 10). In Grainsville, by contrast, the oppor-
tunity cost of producing six more units of grain is
six units of computers that must be forgone; so the
cost of one unit of grain is one unit of computers.
In Techland, a unit of grain costs 2.5 computers, while
in Grainsville the same amount of grain costs only
one computer. Grain is more costly in Techland in
terms of the computers forgone than in Grainsville,
so Grainsville has the comparative advantage in the
production of grain, even though Techland has an
absolute advantage in grain.
With respect to computers, an increase in output
by 25 units, say from 25 to 50 units, costs 10 bushels
of grain forgone in Techland. The cost of one more
computer is 0.4 bushel of grain (10 divided by 25). In
Grainsville, an increase in computer output of
six units, say from 12 to 18, is accompanied by a
decrease in grain production by 6 bushels, as
resources are converted from grain to computer man-
ufacturing. The cost of one computer is 1 bushel of
grain. Computers are more costly (in terms of oppor-
tunity cost) in Grainsville and cheaper in Techland,
so Techland should specialize in the production of
computers.
Thus, by specializing in products in which it has
a comparative advantage, an area has the potential of
having more goods and services, assuming it trades
the additional output for other desirable goods and
services that others can produce at a lower opportu-
nity cost. In the scenario presented here, the people in
Techland would specialize in computers, and the
people in Grainsville would specialize in farming
(grain). We can see from this example that specializa-
tion increases both the division of labor and the inter-
dependence among groups of people.
S E C T I O N
*
C H E C K
1.
Voluntary trade occurs because the participants feel that they are better off as a result of
the trade.
2.
A nation, geographic area, or even a person can gain from trade if the good or service is produced
relatively cheaper than anyone else can produce it. That is, an area should specialize in producing
and selling those items that it can produce at a lower opportunity cost than others.
3.
Through trade and specialization in products in which it has a comparative advantage, a country can
enjoy a greater array of goods and services at a lower cost.
1.
Why do people voluntarily choose to specialize and trade?
2.
How could a country have an absolute advantage in producing one good or service without also having a
comparative advantage in its production?
3.
Why do you think the introduction of the railroad reduced self-sufficiency in the United States?
4.
If you can wash the dishes in two-thirds the time it takes your younger sister to wash them, do you have a
comparative advantage in washing dishes with respect to her?
95469_31_Ch31-p897-930.qxd 5/1/07 10:43 AM Page 906

C H A P T E R 3 1
International Trade
907
THE IMPORTANCE OF TRADE: PRODUCER
AND CONSUMER SURPLUS
Recall from Chapter 7 that the difference between the
most a consumer would be willing to pay for a quantity
of a good and what a
consumer actually has to
pay is called
consumer
surplus.
The difference
between the lowest price
for which a supplier
would be willing to
supply a quantity of a
good or service and the
revenues a supplier actu-
ally receives for selling it
is called
producer sur-
plus.
With the tools of
consumer and producer
surplus, we can better
analyze the impact of
trade. Who gains? Who
loses? What happens to
net welfare?
The demand curve represents the maximum prices
that consumers are willing and able to pay for different
quantities of a good or service; the supply curve repre-
sents the minimum prices suppliers require to be will-
ing to supply different quantities of that good or
service. For example, in Exhibit 1, the consumer is will-
ing to pay up to $7 for the first unit of output and the
producer would demand at least $1 for producing that
unit. However, the equilibrium price is $4, as indicated
by the intersection of the supply and demand curves. It
is clear that the two would gain from getting together
and trading that unit, because the consumer would
receive $3 of consumer surplus ($7
$4), and the pro-
ducer would receive $3 of producer surplus ($4
$1).
Both would also benefit from trading the second and
third units of output—in fact, from every unit up to the
equilibrium output. Once the equilibrium output is
reached at the equilibrium price, all the mutually
beneficial opportunities from trade between suppliers
and demanders will have taken place; the sum of con-
sumer surplus and producer surplus is maximized.
It is important to recognize that the total gain to the
economy from trade is the sum of the consumer and the
producer surpluses. That is, consumers benefit from
additional amounts of consumer surplus, and producers
benefit from additional amounts of producer surplus.
FREE TRADE AND EXPORTS—DOMESTIC PRODUCERS
GAIN MORE THAN DOMESTIC CONSUMERS LOSE
Using the concepts of consumer and producer sur-
plus, we can graphically show the net benefits of free
trade. Imagine an economy with no trade, where the
S E C T I O N
31.3
S u p p l y a n d D e m a n d i n
I n t e r n a t i o n a l Tr a d e
■
What is consumer surplus?
■
What is producer surplus?
■
Who benefits and who loses when a country
becomes an exporter?
■
Who benefits and who loses when a coun-
try becomes an importer?
consumer surplus
the difference between the price a
consumer is willing and able to pay for
an additional unit of a good and the
price the consumer actually pays; for
the whole market, it is the sum of all
the individual consumer surpluses—
the area below the market demand
curve and above the market price
producer surplus
the difference between what a pro-
ducer is paid for a good and the cost
of producing that unit of the good; for
the market, it is the sum of all the
individual sellers’ producer surpluses—
the area above the market supply
curve and below the market price
Consumer and Product
Surplus
S E C T I O N
3 1 . 3
E
X H I B I T
1
Price
$8
7
6
5
4
3
2
1
Quantity
0
S
D
1
2
3
4
CS
PS
CS
PS
CS
PS
Consumer surplus is the difference between what a
consumer has to pay ($4) and what the consumer is will-
ing to pay. For unit 1, consumer surplus is $3 ($7
$4).
Producer surplus is the difference between what a seller
receives for selling a good or service ($4) and the price
at which the seller is willing to supply that good or
service. For unit 1, producer surplus is $3 ($4
$1).
95469_31_Ch31-p897-930.qxd 5/1/07 10:43 AM Page 907
908
M O D U L E 8
International Trade and Finance
equilibrium price, P
BT
, and equilibrium quantity, Q
BT
,
of wheat are determined exclusively in the domestic
economy, as shown in Exhibit 2. Suppose that this
imaginary economy decides to engage in free trade. You
can see that the world price (established in the world
market for wheat), P
AT
, is higher than the domestic price
before trade, P
BT
. In other words, the domestic econ-
omy has a comparative advantage in wheat, because it
can produce wheat at a lower relative price than the rest
of the world. So this wheat-producing country sells
some wheat to the domestic market and some wheat to
the world market, all at the going world price.
The price after trade (P
AT
) is higher than the price
before trade (P
BT
). Because the world market is huge,
the demand from the rest of the world at the world
price (P
AT
) is assumed to be perfectly elastic. That is,
domestic wheat farmers can sell all the wheat they
want at the world price. If you were a wheat farmer
in Nebraska, would you rather sell all your bushels of
wheat at the higher world price or the lower domes-
tic price? As a wheat farmer, you would surely prefer
the higher world price. But this preference is not good
news for domestic cereal and bread eaters, who now
have to pay more for products made with wheat
because P
AT
is greater than P
BT
.
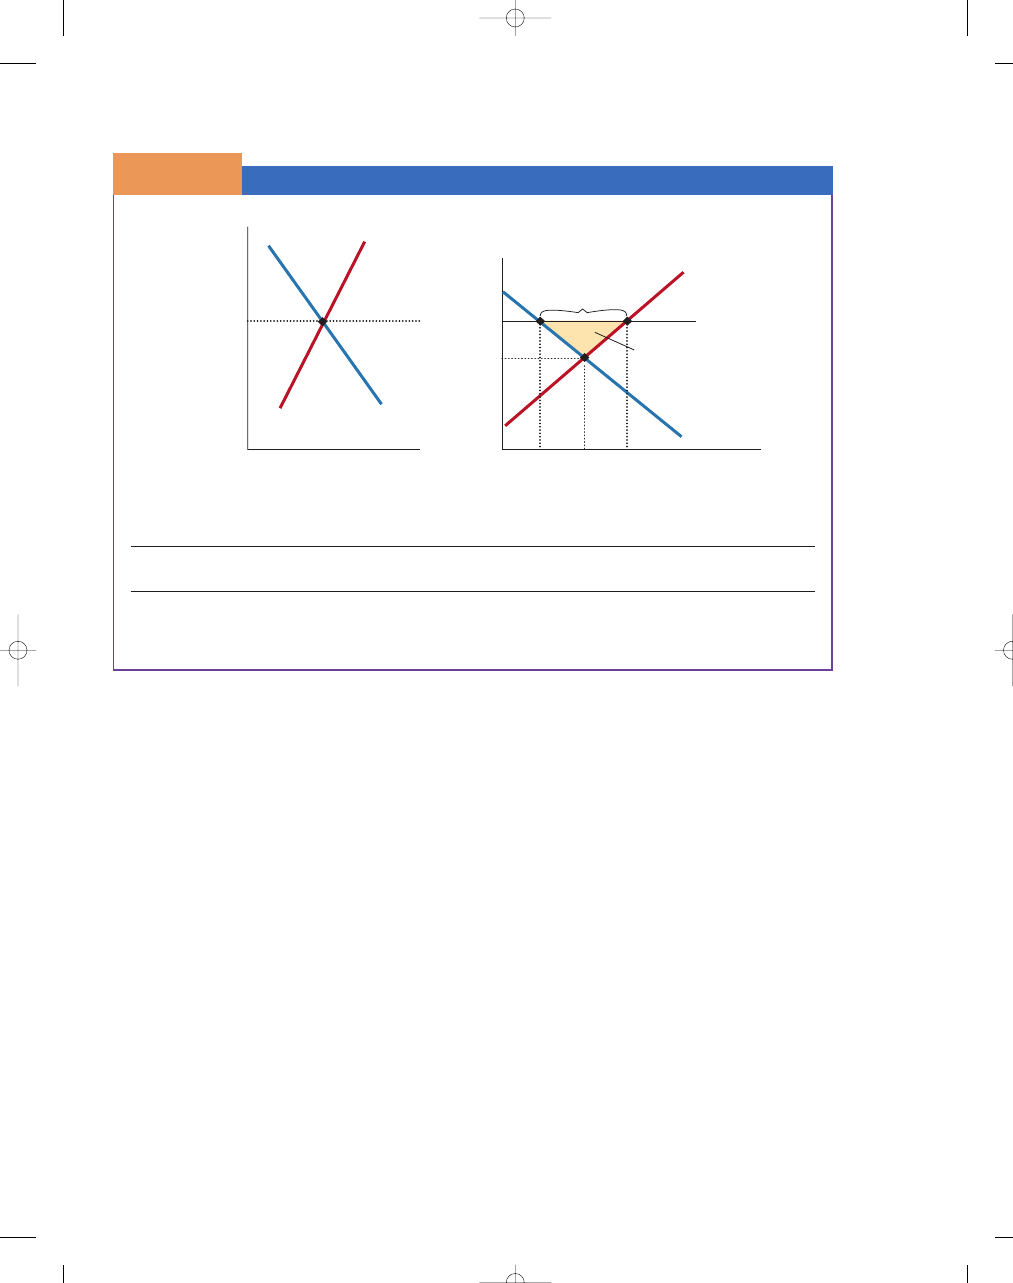
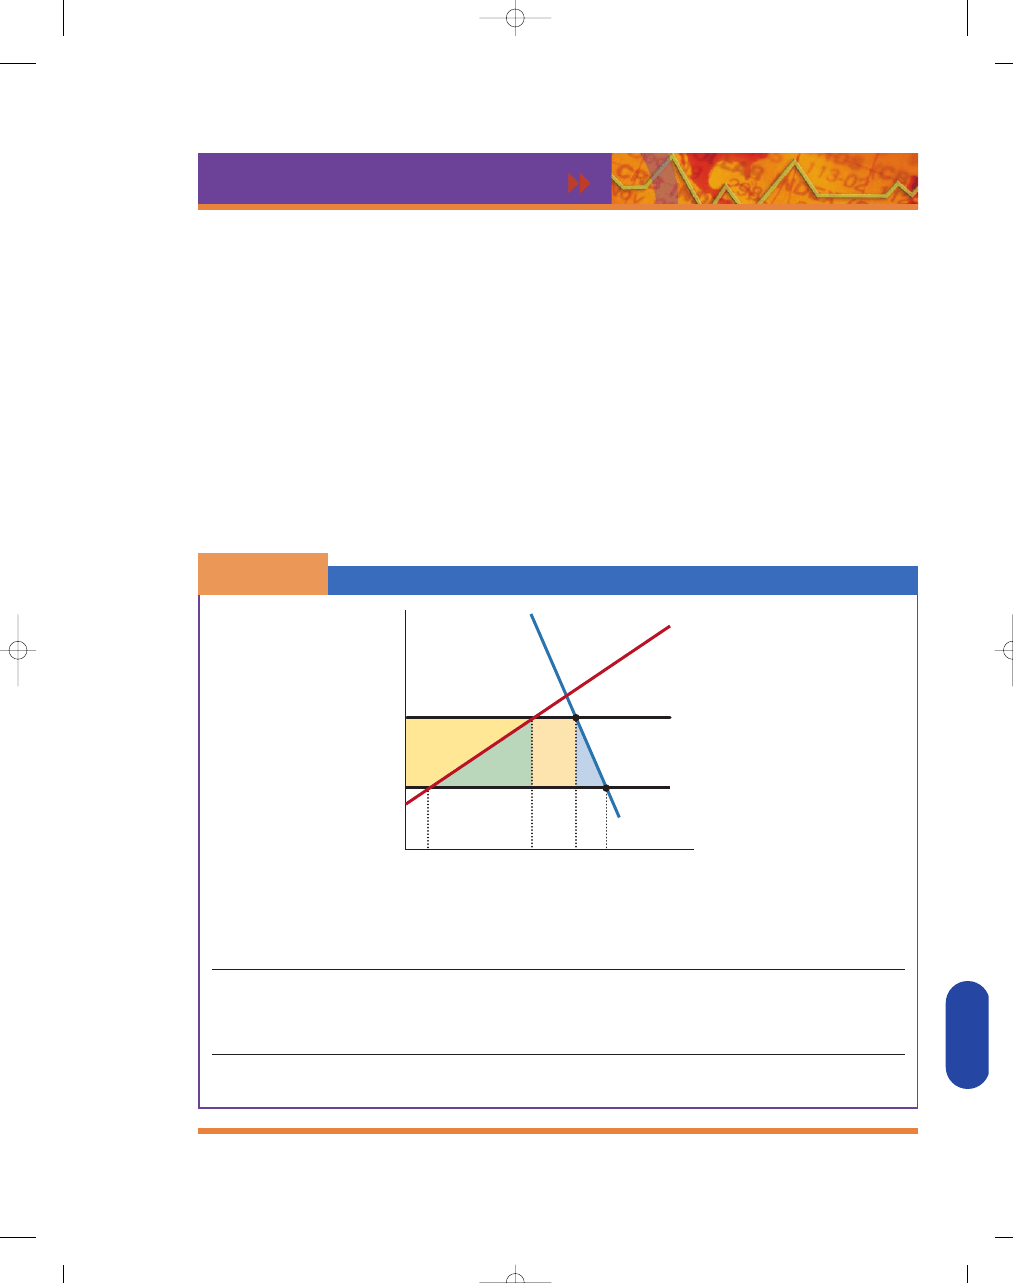
Graphically, we can see how free trade and
exports affect both domestic consumers and domestic
producers. At the higher world price, P
AT
, domestic
wheat producers are receiving larger amounts of pro-
ducer surplus. Before trade, they received a surplus
equal to area e
f; after trade, they received surplus
b
c d e f, for a net gain of area b c d.
However, part of the domestic producers’ gain comes
at domestic consumers’ expense. Specifically, consumers
had a consumer surplus equal to area a
b c
before the trade (at P
BT
), but they now have only area
a (at P
AT
)—a loss of area b
c.
Area b reflects a redistribution of income,
because producers are gaining exactly what con-
sumers are losing. Is that good or bad? We can’t say
objectively whether consumers or producers are
more deserving. However, the net benefits from
allowing free trade and exports are clearly visible in
area d. Without free trade, no one gets area d. That
is, on net, members of the domestic society gain
when domestic wheat producers are able to sell their
wheat at the higher world price. Although domestic
wheat consumers lose from the free trade, those neg-
ative effects are more than offset by the positive gains
captured by producers. Area d is the net increase in
Free Trade and Exports
S E C T I O N
3 1 . 3
E
X H I B I T
2
World Market
Domestic Market
P
AT
P
BT
Q
BT
Q
S
AT
Q
D
AT
S
DOMESTIC
D
DOMESTIC
Price of
Wheat (domestic)
Price of
Wheat (w
orld)
Quantity of Wheat (domestic)
Exports
a
b
d
e
c
f
World Price
Net domestic gain
from trade
P
WORLD
S
WORLD
D
WORLD
Quantity of Wheat (world)
0
0
Domestic Gains and Losses from Free Trade (exports)
Area
Before Trade
After Trade
Change
Consumer Surplus (CS)
a
b c
a
b c
Producer Surplus (PS)
e
f
b
c d e f
b c d
Total Welfare from Trade (CS
PS)
a
b c e f
a
b c d e f
d
Domestic producers gain more than domestic consumers lose from exports when free trade takes place. On net,
domestic wealth rises by area d.
95469_31_Ch31-p897-930.qxd 5/1/07 10:43 AM Page 908

C H A P T E R 3 1
International Trade
909
domestic wealth (the welfare gain) from free trade
and exports.
FREE TRADE AND IMPORTS—DOMESTIC
CONSUMERS GAIN MORE THAN DOMESTIC
PRODUCERS LOSE
Now suppose that our economy does not produce
shirts as well as other countries of the world. In
other words, other countries have a comparative
advantage in producing shirts, and the domestic
price for shirts is above the world price. This sce-
nario is illustrated in Exhibit 3. At the new, lower
world price, the domestic producer will supply
quantity Q
S
AT
. However, at the lower world price,
the domestic producers will not produce the entire
amount demanded by domestic consumers, Q
D
AT
. At
the world price, reflecting the world supply and
demand for shirts, the difference between what is
domestically supplied and what is domestically
demanded is supplied by imports.
At the world price (established in the world
market for shirts), we assume that the world supply to
the domestic market curve is perfectly elastic—that
the producers of the world can supply all that domestic
consumers are willing to buy at the going price. At the
world price, Q
S
AT
is supplied by domestic producers,
and the difference between Q
D
AT
and Q
S
AT
is imported
from other countries.
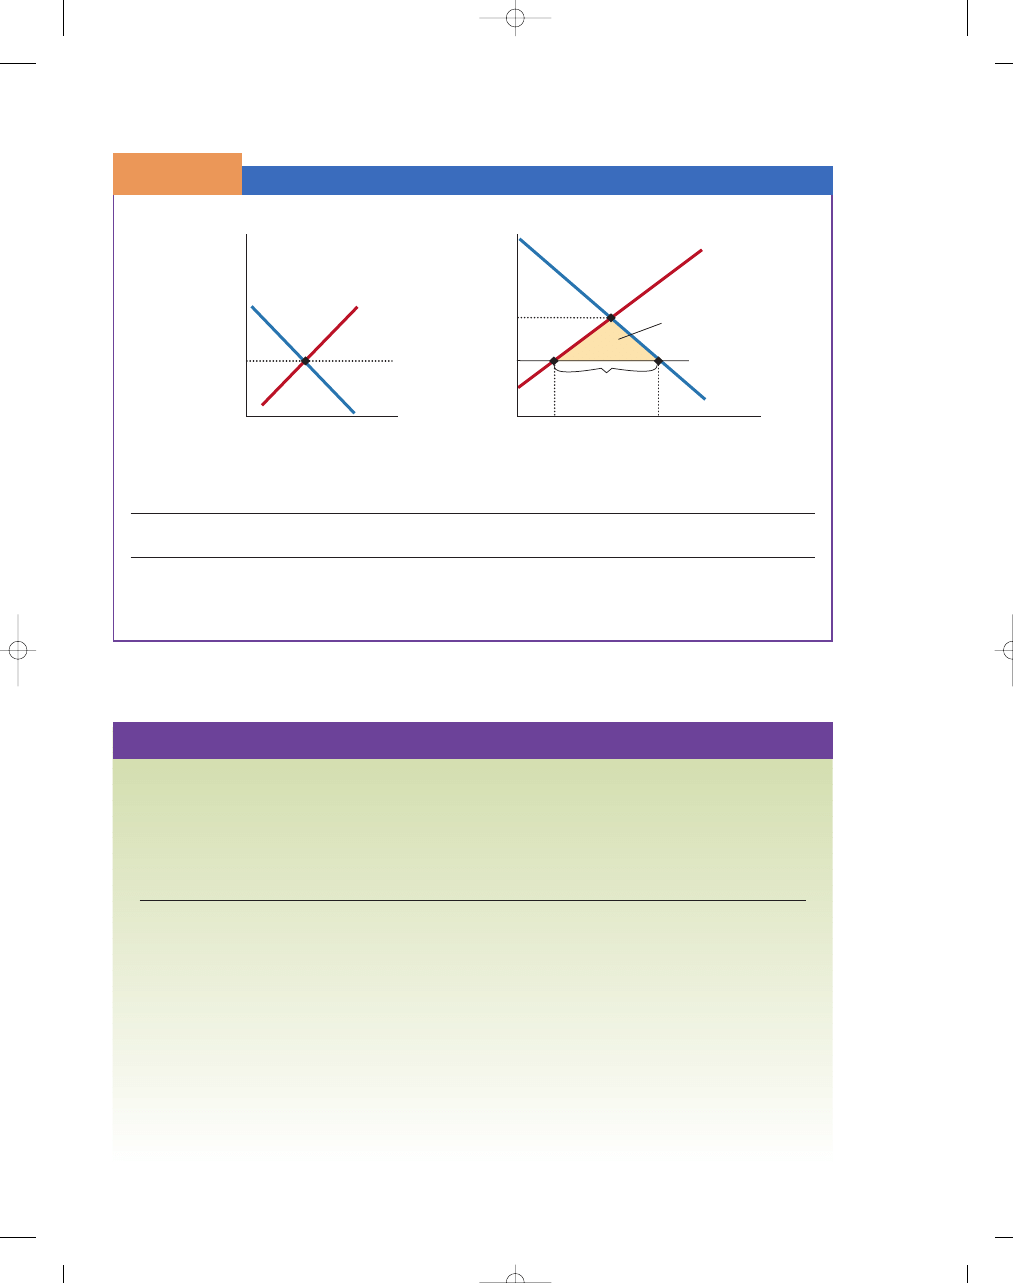
Who wins and who loses from free trade and
imports? Domestic consumers benefit from paying a
lower price for shirts. In Exhibit 3, before trade, con-
sumers only received area a in consumer surplus. After
trade, the price fell and quantity purchased increased,
causing the area of consumer surplus to increase from
area a to area a
b d, a gain of b d. Domestic pro-
ducers lose because they are now selling their shirts at
the lower world price, P
AT
. The producer surplus before
trade was b
c. After trade, the producer surplus falls
to area c, reducing producer surplus by area b. Area b,
then, represents a redistribution from producers to con-
sumers; but area d is the net increase in domestic wealth
(the welfare gain) from free trade and imports.
Big Gains for Mexico from Free Trade
The $229 billion worth of trade between the United States and Mexico result-
ing from NAFTA has improved life on both sides of the border.
■
Wages have grown 150 percent for Mexican truck drivers and overall
unemployment has fallen below 2 percent.
■
Recent elections in Mexico installed a new leadership that wants to
improve U.S.–Mexico political and social relations.
■
Mexico has made it possible to extradite drug traffickers to face criminal
charges in the United States.
■
Mexico has pledged to stop publicly defending Cuba’s poor human rights
record.
■
Although Mexican officials have pledged to find solutions to immigration
problems, it is predicted that within 10 years the rising prosperity in
Mexico resulting from free trade will reduce illegal immigration to the
United States anyway.
■
More than 200,000 new jobs have been created in the U.S. economy as a
direct result of NAFTA, surpassing Clinton administration predictions.
■
Americans also benefit from low-priced Mexican goods, such as produce,
computers, and cars.
■
Legislation is under way to allow private investment in electricity produc-
tion—meaning new power plants and potential gains for power-starved
areas of the United States.
SOURCE: Editorial, “Bush Border Crossing Salutes U.S.-Mexican Trade Gains,” USA
Today, 16 February 2001; and National Center for Policy Analysis, http://www.ncpa.org.
g l o b a l w a t c h
©
K
eith Dannemiller/CORBIS Saba
In 1993, the North American Free Trade Agreement (NAFTA) was
passed. This lowered the trade barriers between Mexico, Canada, and
the United States. Proponents of freer trade, especially economists,
viewed the agreement as a way to gain greater wealth through spe-
cialization and trade for all three countries. Opponents thought the
agreement would take away U.S. jobs and lower living standards or,
in the words of former presidential candidate Ross Perot, it would
cause “a giant sucking sound.”
95469_31_Ch31-p897-930.qxd 5/1/07 10:43 AM Page 909
910
M O D U L E 8
International Trade and Finance
Free Trade and Imports
S E C T I O N
3 1 . 3
E
X H I B I T
3
World Market
Domestic Market
P
BT
P
AT
Price of Shir
ts (domestic)
Quantity of Shirts (domestic)
0
a
b
d
c
0
Imports
S
DOMESTIC
D
DOMESTIC
World
Net domestic gain
from trade
Price of Shir
ts (w
orld)
P
WORLD
S
WORLD
D
WORLD
Quantity of Shirts (world)
Q
S
AT
Q
D
AT
Domestic Gains and Losses from Free Trade (imports)
Area
Before Trade
After Trade
Change
Consumer Surplus (CS)
a
a
b d
b
d
Producer Surplus (PS)
b
c
c
b
Total Welfare from Trade (CS
PS)
a
b c
a
b c d
d
Domestic consumers gain more than domestic producers lose from imports when free trade is allowed. On net,
domestic wealth rises by area d.
S E C T I O N
*
C H E C K
1.
The difference between what a consumer is willing and able to pay and what a consumer actually has
to pay is called consumer surplus.
2.
The difference between what a supplier is willing and able to supply and the price a supplier actually
receives for selling a good or service is called producer surplus.
3.
With free trade and exports, domestic producers gain more than domestic consumers lose.
4.
With free trade and imports, domestic consumers gain more than domestic producers lose.
1.
How does voluntary trade generate both consumer and producer surplus?
2.
If the world price of a good is greater than the domestic price prior to trade, why does it imply that
the domestic economy has a comparative advantage in producing that good?
3.
If the world price of a good is less than the domestic price prior to trade, why does it imply that the
domestic economy has a comparative disadvantage in producing that good?
4.
When a country has a comparative advantage in the production of a good, why do domestic producers
gain more than domestic consumers lose from free international trade?
5.
When a country has a comparative disadvantage in a good, why do domestic consumers gain more than
domestic producers lose from free international trade?
6.
Why do U.S. exporters, such as farmers, favor free trade more than U.S. producers of domestic products
who face competition from foreign imports, such as the automobile industry?
95469_31_Ch31-p897-930.qxd 5/1/07 10:43 AM Page 910
C H A P T E R 3 1
International Trade
911
TARIFFS
A
tariff
is a tax on imported goods. Tariffs are usually
relatively small revenue producers that retard the
expansion of trade. They bring about higher prices
and revenues for
domestic producers,
and lower sales and
revenues for foreign
producers. Moreover,
tariffs lead to higher
prices for domestic consumers. In fact, the gains to
producers are more than offset by the losses to con-
sumers. With the aid of a graph we will see how the
gains and losses from tariffs work.
THE DOMESTIC ECONOMIC IMPACT OF TARIFFS
The domestic economic impact of tariffs is presented
in Exhibit 1, which illustrates the supply and demand
curves for domestic consumers and producers of shoes.
S E C T I O N
31.4
Ta r i f f s , I m p o r t Q u o t a s , a n d S u b s i d i e s
■
What is a tariff?
■
What are the effects of a tariff?
■
What are the effects of an import quota?
■
What is the economic impact of subsidies?
tariff
a tax on imports
Free Trade and Tariffs
S E C T I O N
3 1 . 4
E
X H I B I T
1
World Market
Domestic Market
Price of Shoes (w
orld)
Quantity of Shoes (world)
0
0
P
W+T
Q
S
Q
S
Q
D
Q
D
P
W
Price of Shoes (domestic)
Imports before tariff
Quantity of Shoes (domestic)
Imports after
tariff
c
d
e
f
a
b
g
S
DOMESTIC
S
WORLD+TARIFF
S
WORLD
D
WORLD
S
WORLD
P
WORLD
D
DOMESTIC
Gains and Losses from Tariffs
Area
Before Tariffs
After Tariffs
Change
Consumer Surplus (CS)
a
b c d e f
a
b
c d e f
Producer Surplus (PS)
g
c
g
c
Government Revenues (Tariff)
0
e
e
Total Welfare from Tariff
a
b c d e f g
a
b c e g
d f
(CS
PS Tariff Revenues)
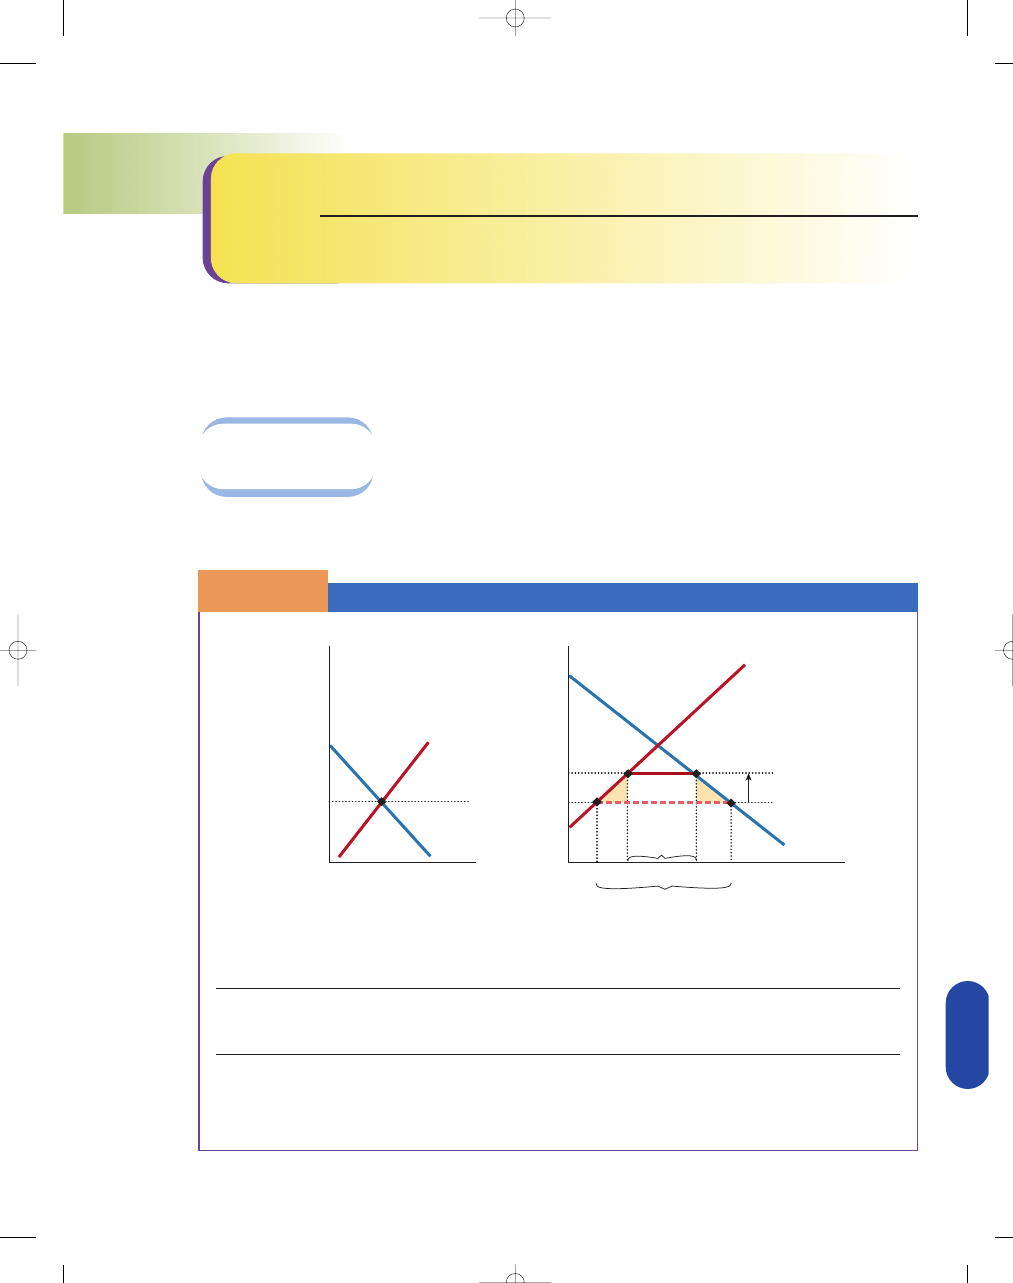
In the case of a tariff, we see that consumers lose more than producers and government gain. On net, the dead-
weight loss associated with the new tariff is represented by area d
f.
95469_31_Ch31-p897-930.qxd 5/1/07 10:43 AM Page 911

912
M O D U L E 8
International Trade and Finance
In a typical international supply and demand illus-
tration, the intersection of the world supply and
demand curves would determine the domestic market
price. However, with import tariffs, the domestic
price of shoes is greater than the world price, as in
Exhibit 1. We consider the world supply curve (S
W
)
for domestic consumers to be perfectly elastic; that
is, we can buy all we want at the world price (P
W
).
At the world price, domestic producers are only will-
ing to provide quantity Q
S
, but domestic consumers
are willing to buy quantity Q
D
—more than domestic
producers are willing to supply. Imports make up the
difference.
As you can see in Exhibit 1, the imposition of the
tariff shifts the perfectly elastic supply curve from for-
eigners to domestic consumers upward from S
WORLD
to S
WORLD
TARIFF
, but it does not alter the domestic
supply or demand curve. At the resulting higher
domestic price (P
W
T
), domestic suppliers are willing
to supply more, Q'
S
, but domestic consumers are will-
ing to buy less, Q'
D
. At the new equilibrium, the
domestic price (P
W
T
) is higher and the quantity of
shoes demanded (Q'
D
) is lower. But at the new price,
the domestic quantity demanded is lower and the
quantity supplied domestically is higher, reducing the
quantity of imported shoes. Overall, then, tariffs lead
to (1) a smaller total quantity sold, (2) a higher price
for shoes for domestic consumers, (3) greater sales of
shoes at higher prices for domestic producers, and
(4) lower sales of foreign shoes.
Although domestic producers do gain more sales
and higher earnings, consumers lose much more. The
increase in price from the tariff results in a loss in con-
sumer surplus, as shown in Exhibit 1. After the tariff,
shoe prices rise to P
W
T
, and, consequently, consumer
surplus falls by area c
d e f, representing the
welfare loss to consumers from the tariff. Area c in
Exhibit 1 shows the gain to domestic producers as a
result of the tariff. That is, at the higher price, domes-
tic producers are willing to supply more shoes, repre-
senting a welfare gain to producers resulting from the
tariff. As a result of the tariff revenues, government
gains area e. This is the import tariff—the revenue
government collects from foreign countries on imports.
However, we see from Exhibit 1 that consumers lose
more than producers and government gain from the
tariff. That is, on net, the deadweight loss associated
with the tariff is represented by area d
f.
ARGUMENTS FOR TARIFFS
Despite the preceding arguments against trade restric-
tions, they continue to be levied. Some rationale for
their existence is necessary. Three common arguments
for the use of trade restrictions deserve our critical
examination.
Temporary Trade Restrictions Help
Infant Industries Grow
A country might argue that a protective tariff will
allow a new industry to more quickly reach a scale of
operation at which economies of scale and production
efficiencies can be realized. That is, temporarily
shielding the young industry from competition from
foreign firms will allow the infant industry a chance
to grow. With early protection, these firms will even-
tually be able to compete effectively in the global
market. It is presumed that without this protection,
the industry could never get on its feet. At first hear-
ing, the argument sounds valid, but it involves many
problems. How do you identify “infant industries”
that genuinely have potential economies of scale and
will quickly become efficient with protection? We do
not know the long-run average total cost curves of
industries, a necessary piece of information. Moreover,
if firms and governments are truly convinced of the
advantages of allowing an industry to reach a large
scale, would it not be wise to make massive loans to
the industry, allowing it to begin large-scale produc-
tion all at once rather than slowly and at the expense
of consumers? In other words, the goal of allowing
the industry to reach its efficient size can be reached
without protection. Finally, the history of infant indus-
try tariffs suggests that the tariffs often linger long
after the industry is mature and no longer in need of
protection.
Tariffs Can Reduce Domestic Unemployment
Exhibit 1 shows how tariffs increase output by
domestic producers, thus leading to increased employ-
ment and reduced unemployment in industries where
tariffs have been imposed. Yet the overall employment
effects of a tariff imposition are not likely to be pos-
itive; the argument is incorrect. Why? First, the
imposition of a tariff by the United States on, say,
foreign steel is going to be noticed in the countries
adversely affected by the tariff. If a new tariff on steel
lowers Japanese steel sales to the United States, the
Japanese will likely retaliate by imposing tariffs on
U.S. exports to Japan, say, on machinery exports.
The retaliatory tariff will lower U.S. sales of machin-
ery and thus employment in the U.S. machinery
industries. As a result, the gain in employment in the
steel industry will be offset by a loss of employment
elsewhere.
Even if other countries did not retaliate, U.S.
employment would likely suffer outside the industry
95469_31_Ch31-p897-930.qxd 5/1/07 10:43 AM Page 912

C H A P T E R 3 1
International Trade
913
gaining tariff protection. The way that other countries
pay for U.S. goods is by getting dollars from sales to
the United States—imports to us. If new tariffs lead to
restrictions on imports, fewer dollars will be flowing
overseas in payment for imports, which means that
foreigners will have fewer dollars available to buy our
exports. Other things being equal, this situation will
tend to reduce our exports, thus creating unemploy-
ment in the export industries.
Tariffs Are Necessary for Reasons
of National Security
Sometimes it is argued that tariffs are a means of pre-
venting a nation from becoming too dependent on
foreign suppliers of goods vital to national security.
That is, by making foreign goods more expensive, we
can protect domestic suppliers. For example, if oil is
vital to operating planes and tanks, a cutoff of foreign
supplies of oil during wartime could cripple a nation’s
defenses.
The national security argument is usually not
valid. If a nation’s own resources are depletable, tariff-
imposed reliance on domestic supplies will hasten
depletion of domestic reserves, making the country
even more dependent on imports in the future. If we
impose a high tariff on foreign oil to protect domestic
producers, we will increase domestic output of oil in
the short run; but in the process, we will deplete the
stockpile of available reserves. Thus, the defense argu-
ment is of questionable validity. From a defense stand-
point, it makes more sense to use foreign oil in
peacetime and perhaps stockpile “insurance” supplies
so that larger domestic supplies would be available
during wars.
Are Tariffs Necessary to Protect
against Dumping?
Dumping occurs when a foreign country sells its prod-
ucts at prices below their costs or below the prices for
which they are sold on the domestic market. For
example, the Japanese government has been accused
for years of subsidizing Japanese steel producers as
they attempt to gain a greater share of the world steel
market and greater market power. That is, the short-
term losses from selling below cost may be offset by
the long-term economic profits from employing this
strategy. Some have argued that tariffs are needed to
protect domestic producers against low-cost dumpers
because they will raise the cost to foreign producers
and offset their cost advantage.
The United States has antidumping laws; if a
foreign country is found guilty of dumping, the United
States can impose antidumping tariffs on that country’s
products, thereby raising the price of the foreign goods
that are being dumped. In practice, however, it is
often difficult to prove dumping; foreign countries
may simply have lower steel production costs. So
what may seem like dumping may in fact be compar-
ative advantage.
IMPORT QUOTAS
Like tariffs,
import quotas
directly restrict imports,
leading to reductions in trade and thus preventing
nations from fully real-
izing their comparative
advantage. The case for
quotas is probably even
weaker than the case
for tariffs. Unlike what
occurs with a tariff, the
U.S. government does
not collect any revenue
as a result of the import quota. Despite the higher
prices, the loss in consumer surplus, and the loss in
government revenue, quotas come about because
people often view them as being less protectionist
than tariffs—the traditional, most-maligned form of
protection.
Besides the rather blunt means of curtailing
imports by using tariffs and quotas, nations have
devised still other, more subtle means of restricting
international trade. For example, nations sometimes
impose product standards, ostensibly to protect con-
sumers against inferior merchandise. Effectively, how-
ever, those standards may be simply a means of
restricting foreign competition. For example, France
might keep certain kinds of wine out of the country
on the grounds that they are made with allegedly infe-
rior grapes or have an inappropriate alcoholic con-
tent. Likewise, the United States might prohibit
automobile imports that do not meet certain stan-
dards in terms of pollutants, safety, and gasoline
mileage. Even if these standards are not intended to
restrict foreign competition, the regulations may
nonetheless have that impact, restricting consumer
choice in the process.
THE DOMESTIC ECONOMIC IMPACT
OF AN IMPORT QUOTA
The domestic economic impact of an import quota on
autos is presented in Exhibit 2. The introduction of an
import quota increases the price from the world price,
P
W
(established in the world market for autos) to P
W
Q
.
The quota causes the price to rise above the world
import quota
a legal limit on the imported
quantity of a good that is produced
abroad and can be sold in domestic
markets
95469_31_Ch31-p897-930.qxd 5/1/07 10:43 AM Page 913

914
M O D U L E 8
International Trade and Finance
price. The domestic quantity demanded falls and the
domestic quantity supplied rises. Consequently, the
number of imports is much smaller than it would
be without the import quota. Compared with free
trade, domestic producers are better off but domestic
consumers are worse off. Specifically, the import
quota results in a gain in producer surplus of area c and
a loss in consumer surplus of area c
d e f.
However, unlike the tariff case, where the government
gains area e in revenues, the government does not
gain any revenues with a quota. Consequently, the
deadweight loss is even greater with quotas than with
tariffs. That is, on net, the deadweight loss associated
with the quota is represented by area d
e f. Recall
that the deadweight loss was only d
f for tariffs.
If tariffs and import quotas hurt importing
countries, why do they exist? The reason they exist
is that producers can make large profits or “rents”
from tariffs and import quotas. Economists call these
efforts to gain profits from government protection
rent seeking.
Because this money, time, and effort
spent on lobbying could
have been spent pro-
ducing something else,
the deadweight loss
from tariffs and quotas
will likely understate
the true deadweight
loss to society.
THE ECONOMIC IMPACT OF SUBSIDIES
Working in the opposite direction, governments
sometimes try to encourage exports by subsidizing
producers. With a subsidy, revenue is given to
Free Trade and Import Quotas
S E C T I O N
3 1 . 4
E
X H I B I T
2
World Market
Domestic Market
P
W+Q
S
WORLD
D
WORLD
P
WORLD
Q
S
Q
S
Q
D
Q
D
P
W
Price of A
utos (domestic)
Price of A
utos (w
orld)
Imports before quota
Quantity of Autos
(world)
Quantity of Autos
(domestic)
0
0
Imports after
quota
a
b
c
d
f
e
g
S
DOMESTIC
S
WORLD
QUOTA
S
WORLD
D
DOMESTIC
Gains and Losses from Import Quotas
Area
Before Quota
After Quota
Change
Consumer Surplus (CS)
a
b c d e f
a
b
c d e f
Producer Surplus (PS)
g
c
g
c
Total Welfare (CS
PS)
a
b c d e f g
a
b c g
d e f
from Quota
With an import quota, the price rises from P
W
to P
W
Q
. Compared with free trade, consumers lose area c
d e f,
while producers gain area b. The deadweight loss from the quota is area d
e f. Under quotas, consumers lose
and producers gain. The difference in deadweight loss between quotas and tariffs is area d, which the government
is not able to pick up with import quotas.
rent seeking
efforts by producers to gain profits
from government protections such
as tariffs and import quotas
95469_31_Ch31-p897-930.qxd 5/1/07 10:43 AM Page 914
C H A P T E R 3 1
International Trade
915
p o l i c y a p p l i c a t i o n
The Sugar Quota
The world price of sugar is much lower than the U.S. price. For example, in
recent years, the U.S. price of sugar has been as high as 25 cents per pound
while the world price was less than a nickel per pound. Why? The reason is
that a sugar import quota protects the domestic sugar industry, by con-
trolling how much foreign sugar can enter the country. This policy raised
the price of U.S. sugar and helps both domestic producers and those for-
eign producers who have lobbied successfully for quota allotment. In 2006,
five of the largest producing Caribbean nations received increases in their
quota because of the devastation done to the sugar plantations in
Louisiana by Hurricane Katrina.
The sugar quota impacts the price of everything from beverages to birth-
day cakes. As we can see graphically in Exhibit 3, this policy may be good for
domestic sugar producers but it is clearly bad for consumers (and those
producers who use sugar as an input to further production such as candy
makers, several of whom have moved out of the United States). Even
though the numbers are hypothetical for ease of quantifying, they are
close enough to reality that you can see the monetary impact of the
quota.
Notice the cost to consumers of this policy is area a
+ b + c + d, or
$2.1 billion a year. But, part of what consumers lose, producers gain. U.S.
producers gain area a, or $850 million, and foreign producers with quota
allotments for the U.S. market received $600 million (remember they
would have had to sell their sugar for $0.10, instead of $0.20, on the
world market). Areas b and d represent the deadweight loss from this
policy—$65 billion.
The Sugar Quota
S E C T I O N
3 1 . 4
E
X H I B I T
3
0
3
14
20
22
Demand
Domestic
Supply
Domestic
U.S. Price (with quota)
World Price
a
b
c
d
0.08
0.10
$0.20
Quantity of Sugar
(billions of pounds)
Price
(dollars per Pound)
E
2
E
1
Q
S
Q
′
S
Q
′
D
Q
D
Gains and Losses Associated with Sugar Quota
Loss of Consumer Surplus
Area a
b c d $2.1 billion
Gain to U.S. Producers of Sugar
Area a
$850 million
Gain to Foreign Sugar Producers with Quota Allotments
Area c
$600 million
Deadweight Loss
Area b
d $650 million
Area a
$850 million ($0.10 11 billion 0.5) ($0.10 3 billion) Area c $600 million ($0.10 6 billion)
Area b
$550 million ($0.10 11 billion 0.5)
Area d
$100 million ($0.10 2 billion 0.5)
95469_31_Ch31-p897-930.qxd 5/1/07 10:44 AM Page 915
916
M O D U L E 8
International Trade and Finance
i n t h e n e w s
Do What You Do Best, Outsource the Rest?
International trade generates higher overall output by redirecting jobs to
those who create the most added values—that is, to those who maximize their
productive abilities. Put simply, the benefits of free trade can be summarized
as: “Do what you do best. Trade for the rest.” But times are changing, and so
are many traded commodities.
The newest U.S. trade commodity is skilled white-collar work, with an
estimated 60 percent of these outsourced jobs going to India. As with most
traded commodities, outsourcing work abroad is the product of lower foreign
labor costs and potentially higher future profits. And like free trade, out-
sourcing has become controversial.
Outsourcing’s critics see only the elimination of work previously done in
the United States and view outsourcing as exporting white-collar jobs to
other countries. What they fail to recognize is that attempting to protect
these jobs would mean higher prices for consumers and the unrealized poten-
tial for more productive jobs in new industries.
What is outsourcing? Why is India the leading country in attracting out-
sourced work? And what are the economic and political implications as firms
do what they do best and outsource the rest?
OUTSOURCING: WHAT IT IS AND WHY IT IS DONE
Outsourcing occurs when an organization transfers some of its tasks to an out-
side supplier. In many recent cases, businesses in India have served as suppliers.
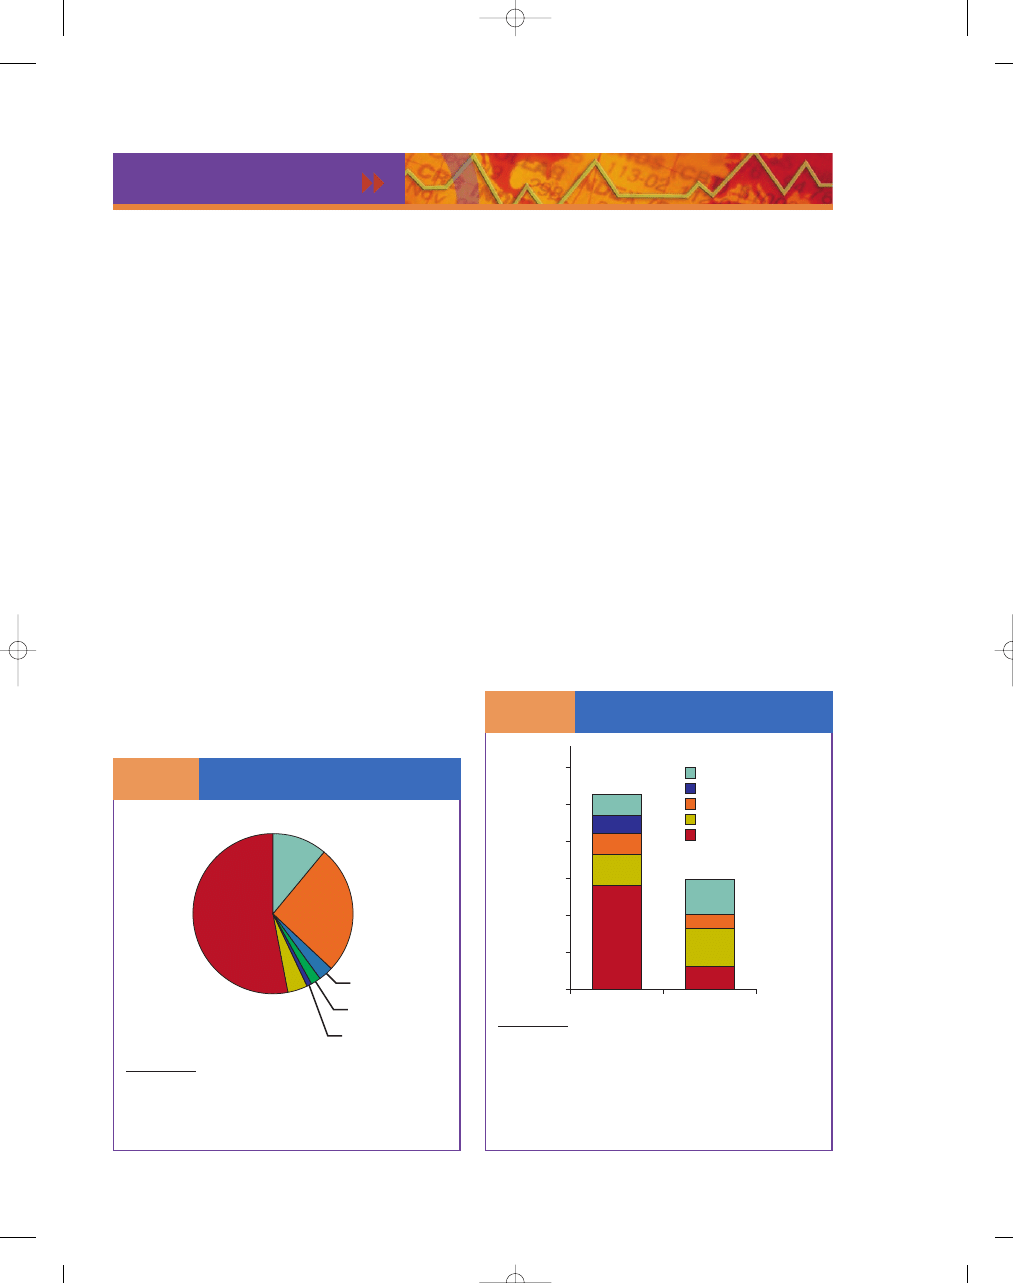
A variety of jobs are being outsourced, including routine office work,
computer-related work, business (accounting and finance), architecture, legal,
art and design, and sales (Chart 1 ). The availability of real-time information
via the Internet, satellite and transoceanic communications allows businesses
to be sustained instantaneously around the globe. New information tech-
nologies let fewer people do more work and also help quickly bring new skills
to learners everywhere.
Specialized tasks—such as software development, financial research and
call centers—can often be accomplished elsewhere in the world at a fraction
of U.S. costs. Through outsourcing, it is not uncommon for companies to real-
ize net cost savings of 30 to 50 percent (Chart 2 ). As a result, it is often in a
firm’s best interest to outsource certain tasks and use the abilities of its
remaining workers in other, more productive activities.
WHY INDIA?
Many countries offer low production and labor costs. But to make outsourc-
ing viable, other business-promoting factors must be considered as well, such
as the number and quality of skilled workers, maturity of the outsource
market, government support, the legal system, political stability, location and
accessibility, education, infrastructure, time differentials, technological
modernity and English language skills.
For myriad services, India has emerged as the most appealing country in
many of these areas. India has the second-largest English-speaking population
in the world (after the United States) and an educated technical workforce
A Variety of Jobs
Being Outsourced
C
H A RT
1
Computer
26%
Business
11%
Office
53%
Architecture
3%
Legal
2%
Art, design
1%
Sales
4%
NOTE: Percentages computed on estimates for 2000.
SOURCE: John C. McCarthy (2002), “3.3 Million U.S. Services Jobs
to Go Offshore,” TechStrategy Research Brief, Forrester Research
Inc., November 11.
Outsourcing to India
Can Net Large Savings
C
H A RT
2
Profit
Tax*
Overhead
Telecom/Network
Wages
0
United States
India
1
2
3
4
5
6
U
.S.
dollar
s (in millions)
*India exempts taxes for exports, including call centers for
foreign businesses.
NOTE: This comparison is based on annual costs for a 100-seat call
center.
SOURCE: Antonio Riera, Janmejaya Sinha, and Alpesh Shah (2002),
“Passage to India: The Rewards of Remote Business Processing,”
The Boston Consulting Group.
(continued)
95469_31_Ch31-p897-930.qxd 5/1/07 10:44 AM Page 916

C H A P T E R 3 1
International Trade
917
i n t h e n e w s ( c o n t . )
pool of more than 4.1 million workers. In addition, the outsourcing market in
India—especially for information technology (IT) services—has had time to
mature and gain support from U.S. businesses.
India’s 1991 Statement on Industrial Policy facilitated foreign direct
investment and technology transfers, ushering in a new era with fewer of
the regulatory burdens that had previously kept foreign firms from estab-
lishing business operations there. In the decade since this policy reform,
foreign direct investment in India has increased more than fiftyfold. And
even though India’s basic infrastructure is among the worst in the world,
businesses in India have found ways to compete globally in the IT arena,
making India one of the world’s leaders in software exports. The city of
Bangalore—home to many IT outsourcing firms and U.S. corporations—
contributed $2.5 billion last year to India’s total software exports of
$9.5 billion.
Furthermore, promoting IT is one of the Indian government’s top priori-
ties. The Ministry of Information Technology was established in October 1999
to accelerate the implementation of IT projects in government, education and
the private sector. India has many universities dedicated to maintaining state-
of-the-art IT curriculums, and more than 70,000 software engineers graduate
annually from Indian institutes.
OUTSOURCING’S IMPLICATIONS
As long as there are workers in India (or elsewhere) willing and able to
perform the same work for less pay, U.S. firms will increasingly examine
outsourcing as an option to hold the line on costs and remain globally
competitive. Forrester Research estimates that the number of out-
sourced jobs will increase to nearly 600,000 by 2005 and to 3.3 million
by 2015, including jobs requiring management and life science skills. This
is unwelcome news to U.S. workers whose jobs will be lost. But history
suggests that this phenomenon will also generate many better, higher-
paying jobs at home as long as the United States can keep its competi-
tive advantage in innovation. Entrepreneurship and innovation depend
on a broadly educated workforce committed to continuous learning and
risk-taking.
Even though these are anxious times for U.S. workers, consumers are
sure to benefit from outsourcing. In 1776, Adam Smith emphasized that
“it is not from the benevolence of the butcher, the brewer, or the baker,
that we expect our dinner, but from their regard to their own interest.”
1
Following Smith’s ideas, modern companies participate in the international
1
Adam Smith, An Enquiry into the Nature and Causes of the Wealth of
Nations (1776), reprint, ed. Edwin Cannan (New York: Modern Library), 1937,
p. 14.
market and pursue their own interests by making the most productive
use of their resources. By pursuing profit maximization, firms remain
competitive.
For U.S. consumers, competition leads to more and better economic
choices. And the desire to meet consumer demand is the reason for all
productive activity. Competition sustained through outsourcing has posi-
tively affected the well-being of consumers and producers. By participat-
ing in international trade, we increase our ability to consume the goods
and services we value most, and we can do so at lower cost. If firms did
not pursue outsourcing, or if governments placed barriers or limits on
outsourcing in an attempt to “help” American workers, there would be
less motivation to produce (because of lower profit potential) and higher
prices for consumers.
International competition is often blamed for job losses and
depressed sales. But protecting lost jobs is always harmful to consumers.
Even so, several states are contemplating legislation that would prohibit
their state government from contracting with foreign firms to perform
services. Such actions cost taxpayers more by taking away opportunities
for significant savings.
THINK GLOBALLY, ACT GLOBALLY
With specialization comes trade. Work once sheltered from faraway competi-
tion is no longer secure. Innovations that create economic growth simultane-
ously destroy specific jobs as new technologies replace older ones. The fact is,
the Internet creates jobs and the Internet destroys jobs.
Businesses in India and elsewhere are developing an important com-
petitive advantage in outsourcing by providing quality services at low costs.
In the Internet Age—where a company’s physical location is of little rele-
vance and information travels quickly and cheaply—firms will continue to
boost productivity and keep costs low by doing what they do best and out-
sourcing the rest.
And consumers reap the benefits.
—Thomas F. Siems
Adam S. Ratner
Siems is a senior economist and policy advisor in the Research Department
of the Federal Reserve Bank of Dallas. Ratner is a student at DePauw
University.
SOURCE: Thomas F. Siems and Adam S. Ratner, “Beyond the Border: Do What You
Do Best, Outsource the Rest?” Federal Reserve Bank of Dallas Southwest Economy
November/December 2003, pp. 13–14.
95469_31_Ch31-p897-930.qxd 5/1/07 10:44 AM Page 917

918
M O D U L E 8
International Trade and Finance
producers for each exported unit of output, which
stimulates exports. Although not a barrier to trade
like tariffs and quotas, subsidies can distort trade pat-
terns and lead to inefficiencies. How do these distor-
tions happen? With subsidies, producers will export
goods not because their costs are lower than those of
a foreign competitor but because their costs have
been artificially reduced by government action, trans-
ferring income from taxpayers to the exporter. The
subsidy does not reduce the amounts of actual labor,
raw material, and capital costs of production—soci-
ety has the same opportunity costs as before. The
nation’s taxpayers end up subsidizing the output of
producers who, relative to producers in other coun-
tries, are inefficient. The nation, then, is exporting
products in which it does not have a comparative
advantage. Gains from trade in terms of world
output are eliminated or reduced by such subsidies.
Thus, subsidies, usually defended as a means of
increasing exports and improving a nation’s interna-
tional financial position, are usually of dubious
worth to the world economy and even to the econ-
omy doing the subsidizing.
Buy American. The Job You Save May Be Your Own. A common
myth is that it’s better for Americans to spend their money at
home than abroad. The best way to expose the fallacy in this
argument is to take it to its logical extreme. If it’s better for me
to spend my money here than abroad, then it’s even better to
buy in Texas than in New York, better yet to buy in Dallas than
in Houston . . . in my own neighborhood . . . within my own
family . . . to consume only what I can produce. Alone and poor.
©
F
eder
al Reser
v
e Bank of Dallas
S E C T I O N
*
C H E C K
1.
A tariff is a tax on imported goods.
2.
Tariffs bring about higher prices and revenues to domestic producers and lower sales and revenues to foreign
producers. Tariffs lead to higher prices and reduce consumer surplus for domestic consumers. Tariffs result
in a net loss in welfare because the loss in consumer surplus is greater than the gain to producers and the
government.
3.
Arguments for the use of tariffs include: tariffs help infant industries grow; tariffs can reduce domestic unemployment;
new tariffs can help finance our international trade; and tariffs are necessary for national security reasons.
4.
Like tariffs, import quotas restrict imports, lowering consumer surplus and preventing countries from fully realizing
their comparative advantage. The net loss in welfare from a quota is proportionately larger than for a tariff because
it does not result in government revenues.
5.
Sometimes government tries to encourage production of a certain good by subsidizing its production with taxpayer
dollars. Because subsidies stimulate exports, they are not a barrier to trade like tariffs and import quotas. However,
they do distort trade patterns and cause overall inefficiencies.
1.
Why do tariffs increase domestic producer surplus but decrease domestic consumer surplus?
2.
How do import tariffs increase employment in “protected” industries but at the expense of a likely decrease in
employment overall?
3.
Why is the national security argument for tariffs questionable?
4.
Why is the domestic argument for import quotas weaker than the case for tariffs?
5.
Why would foreign producers prefer import quotas to tariffs, even if they resulted in the same reduced level of
imports?
6.
Why does subsidizing exports by industries without a comparative advantage tend to harm the domestic economy,
on net?
95469_31_Ch31-p897-930.qxd 5/1/07 10:44 AM Page 918

C H A P T E R 3 1
International Trade
919
I n t e r a c t i v e S u m m a r y
Fill in the blanks:
1. In a typical year, about
percent of
the world’s output is traded in international markets.
2. In the global economy, one country’s exports are
another country’s
.
3.
trade implies that both partici-
pants in an exchange of goods and services anticipate
an improvement in their economic welfare.
4. The theory that explains how trade can be beneficial
to both parties centers on the concept of
.
5. A person, a region, or a country has a comparative
advantage over another person, region, or country in
producing a particular good or service if it produces a
good or service at a lower
than
others do.
6. What is important for mutually beneficial specializa-
tion and trade is
advantage,
not advantage.
7. Trade has evolved in large part because different geo-
graphic areas have
resources and
therefore production
possibilities.
8. If Techland can produce more of both grain and
computers than Grainsville, Techland has a(n)
advantage in both products.
9. The difference between the most a consumer would
be willing to pay for a quantity of a good and
what a consumer actually has to pay is called
surplus.
10. We can better analyze the impact of trade with the
tools of
and
surplus.
11. Once the equilibrium output is reached at the equilib-
rium price, the sum of
and
is maximized.
12. When the domestic economy has a comparative
advantage in a good because it can produce it at a
lower relative price than the rest of the world can,
international trade
the domestic
market price to the world price, benefiting domestic
but harming domestic
.
13. When the domestic economy has a comparative
advantage in a good, allowing international trade
redistributes income from domestic
to domestic
, but
surplus increases more than
surplus decreases.
14. When a country does not produce a good
relatively as well as other countries do,
international trade will
the
domestic price to the world price, with the
difference between what is domestically supplied
and what is domestically demanded supplied
by .
15. When a country does not produce a good relatively
as well as other countries do, international trade
redistributes income from domestic
to domestic
and causes a net
in domestic wealth.
16. A(n)
is a tax on imported goods.
17. Tariffs bring about
prices and
revenues to domestic producers,
sales and revenues to foreign producers, and
prices to domestic consumers.
18. With import tariffs, the domestic price of goods
is
than the world price.
19. If import tariffs are imposed, at the new price the
domestic quantity demanded is
,
and the quantity supplied domestically is
, the
quantity
of imported goods.
20. Import tariffs benefit domestic
and but
harm
domestic
.
21. One argument for tariffs is that tariff protection is
necessary
to allow a new industry
to more quickly reach a scale of operation at which
economies of scale and production efficiencies can be
realized.
22. Tariffs lead to
output and employ-
ment and reduced unemployment in domestic indus-
tries where tariffs are imposed.
23. If new tariffs lead to restrictions on imports,
dollars will be flowing overseas
in payment for imports, which means that foreigners
will have
dollars available to
buy U.S. exports.
24. If a nation’s own resources are depletable, tariff-
imposed reliance on domestic supplies will
depletion of domestic reserves.
25. An import
gives producers from
another country a maximum number of units of the
good in question that can be imported within any
given time span.
95469_31_Ch31-p897-930.qxd 5/1/07 10:44 AM Page 919

920
M O D U L E 8
International Trade and Finance
26. The case for import quotas is
than
the case for import tariffs.
27. Tariffs and import quotas are rather suspect and
exist because of producers’ lobbying efforts to gain
profits from government protection, which is called
.
28. Dumping occurs when a foreign country sells its
products at prices
their costs
or
the prices they are sold at in
the domestic market.
29. If a foreign country is found guilty of dumping,
the United States can impose
tariffs.
30. Governments sometimes try to encourage exports
by producers.
31. With subsidies, a nation’s taxpayers end up subsidiz-
ing the output of producers who, relative to producers
in other countries, are
.
32. Gains from trade in terms of world output are
by export subsidies.
A
nswers: 1.
15
2.imports
3.V
oluntary
4.comparative advantage
5.opportunity cost
6.comparative; absolute
7.different; different
8.absolute
9.consumer
10.consumer; producer
11.consumer surplus; producer surplus
12.raises; producers; consumers
13.c
on
sumers; producers; producer; consumer
14.lower; imports
15.producers; consumers; increase
16.tariff
17.higher; lower;
higher
18.greater
19.lower; greater; reducing
20.producers; the government; consumers
21.temporarily
22.increased
23.fewer;
fewer
24.hasten
25.quota
26.weaker
27.rent seeking
28.below; below
29.antidumping
30.subsidizing
31.inefficient
32.reduced
K e y Te r m s a n d C o n c e p t s
comparative advantage 902
consumer surplus 907
producer surplus 907
tariff 911
import quota 913
rent seeking 914
S e c t i o n C h e c k A n s w e r s
31.1 The Growth in World Trade
1. Why is it important to understand the effects of
international trade?
All countries are importantly affected by interna-
tional trade, although the magnitude of the interna-
tional trade sector varies substantially by country.
International connections mean that any of a large
number of disturbances that originate elsewhere
may have important consequences for the domestic
economy.
2. Why would U.S. producers and consumers be more
concerned about Canadian trade restrictions than
Swedish trade restrictions?
The United States and Canada are the two largest
trading partners in the world. This means that the
effects of trade restrictions imposed by Canada
would have a far larger effect on the United States
than similar restrictions imposed by Sweden. (For
certain items, however, the magnitude of our trade
with Sweden is greater than it is with Canada, so for
these items Swedish restrictions would be of more
concern.)
31.2 Comparative Advantage and Gains from Trade
1. Why do people voluntarily choose to specialize
and trade?
Voluntary specialization and trade among self-
interested parties only takes place because all the
parties involved expect that their benefits from this
specialization (according to comparative advantage)
and exchange will exceed their costs.
2. How could a country have an absolute advantage in
producing one good or service without also having a
comparative advantage in its production?
If one country was absolutely more productive at
everything than another country but wasn’t equally
more productive at everything, there would still be
some things in which it had a comparative disadvan-
tage. For instance, if country A was three times as
productive in making X and two times as productive
in making Y as country B, it would have a compara-
tive advantage in making X (it gives up less Y for
each X produced) and a comparative disadvantage in
making Y (it gives up more X for each Y produced),
relative to country B.
95469_31_Ch31-p897-930.qxd 5/1/07 10:44 AM Page 920

C H A P T E R 3 1
International Trade
921
3. Why do you think the introduction of the railroad
reduced self-sufficiency in the United States?
Prior to the introduction of the railroad, the high
cost of transportation overwhelmed the gains from
specializing according to comparative advantage in
much of the United States (production cost differences
were smaller than the costs of transportation). The
railroads reduced transportation costs enough that
specialization and exchange became beneficial for
more goods and services, and self-sufficiency due to
high transportation costs declined.
4. If you can wash the dishes in two-thirds the time it
takes your younger sister to wash them, do you have
a comparative advantage in washing the dishes with
respect to her?
We can’t know the answer to this question without
more information. It is not the time taken to wash the
dishes that matters in determining comparative advan-
tage but the opportunity cost of the time in terms of
forgone value elsewhere. If your younger sister is less
than two-thirds as good at other chores than you, she
is relatively better at washing the dishes and so would
have a comparative advantage in washing the dishes. If
she is more than two-thirds as good at other chores,
she is relatively better at these chores and so would
have a comparative disadvantage in washing the dishes.
31.3 Supply and Demand in International Trade
1. How does voluntary trade generate both consumer
and producer surplus?
Voluntary trade generates consumer surplus because a
rational consumer would not purchase if he did not
value the benefits of purchase at greater than its cost,
and consumer surplus is the difference between that
value and the cost he is forced to pay. Voluntary trade
generates producer surplus because a rational pro-
ducer would not sell additional units unless the price
he received was greater than his marginal cost, and
producer surplus is the difference between the rev-
enues received and the costs producers must bear to
produce the goods that generate those revenues.
2. If the world price of a good is greater than the
domestic price prior to trade, why does it imply that
the domestic economy has a comparative advantage
in producing that good?
If the world price of a good is greater than the domes-
tic price prior to trade, this implies that the domestic
marginal opportunity cost of production is less than
the world marginal opportunity cost of production.
But this means that the domestic economy has a com-
parative advantage in that good.
3. If the world price of a good is less than the domestic
price prior to trade, why does it imply that the domestic
economy has a comparative disadvantage in producing
that good?
If the world price of a good is less than the domestic
price prior to trade, this implies that the domestic
marginal opportunity cost of production is greater
than the world marginal opportunity cost of produc-
tion. But this means that the domestic economy has a
comparative disadvantage in that good.
4. When a country has a comparative advantage in the
production of a good, why do domestic producers
gain more than domestic consumers lose from free
international trade?
When a country has a comparative advantage in pro-
ducing a good, the marginal benefit from exporting
is the world price, which is greater than the forgone
value domestically (along the domestic demand curve)
for those units of domestic consumption “crowded
out” and greater than the marginal cost of the expanded
output. Therefore, there are net domestic gains to
international trade (the gains to domestic producers
exceed the losses to domestic consumers).
5. When a country has a comparative disadvantage
in a good, why do domestic consumers gain more
than domestic producers lose from free international
trade?
When a country has a comparative disadvantage
in producing a good, the marginal cost of importing
is the world price, which is less than the additional
value (along the domestic demand curve) for those
units of expanded domestic consumption and less
than the marginal cost of the domestic production
“crowded out.” Therefore, there are net domestic
gains to international trade (the gains to domestic
consumers exceed the losses to domestic producers).
6. Why do U.S. exporters, such as farmers, favor free
trade more than U.S. producers of domestic products
who face competition from foreign imports, such as
the automobile industry?
Exporters favor free trade over restrictions on what
they sell in other countries because it increases the
demand and therefore the price for their products,
which raises their profits. Those who must compete
with importers want those imports restricted rather
than freely traded because it increases the demand
and therefore the price for their domestically pro-
duced products, which raises their profits.
31.4 Tariffs, Import Quotas, and Subsidies
1. Why do tariffs increase domestic producer surplus but
decrease domestic consumer surplus?
Tariffs raise the price of imported goods to domestic
consumers, resulting in higher prices received by
domestic producers as well. Thus, the higher price
95469_31_Ch31-p897-930.qxd 5/1/07 10:44 AM Page 921

922
M O D U L E 8
International Trade and Finance
reduces domestic consumer surplus but increases
domestic producer surplus.
2. How do import tariffs increase employment in
“protected” industries but at the expense of a likely
decrease in employment overall?
Import tariffs increase employment in “protected”
industries because the barriers to lower-price imports
increase the demand faced by domestic producers,
increasing their demand for workers. However, imports
are the means by which foreigners get the dollars to
buy our exports, so restricted imports will mean
restricted exports (even more so if other countries retal-
iate with import restrictions of their own). In addition,
by raising the prices domestic consumers pay for the
protected products (remember that domestic consumers
lose more than domestic producers gain from protec-
tionism), consumers are made poorer in real terms,
which will reduce demand for goods, and therefore the
labor to make them, throughout the economy.
3. Why is the national security argument for tariffs
questionable?
The national security argument for tariffs is question-
able because tariffs increase current reliance on
domestic supplies, which depletes the future stockpile
of available reserves. With fewer domestic reserves,
the country will be even more dependent on foreign
supplies in the future. Buying foreign supplies and
stockpiling them makes more sense as a way of reduc-
ing reliance on foreign supplies in wartime.
4. Why is the domestic argument for import quotas
weaker than the case for tariffs?
Tariffs at least use the price system as the basis of
trade. Tariff revenues end up in a country’s treasury,
where they can be used to produce benefits for the
country’s citizens or to reduce the domestic tax
burden. Import quotas, however, transfer most of
those benefits to foreign producers as the higher prices
they receive.
5. Why would foreign producers prefer import quotas to
tariffs, even if they resulted in the same reduced level
of imports?
Restricting imports reduces supply, which increases
the price that foreign producers receive on the units
they sell, thus benefiting them. Tariffs, on the other
hand, reduce the after-tariff price that foreign produc-
ers receive. If both reduce foreign sales by the same
amount, foreign producers would clearly prefer
import restrictions over tariffs.
6. Why does subsidizing exports by industries without a
comparative advantage tend to harm the domestic
economy, on net?
Subsidizing industries in which a country has a
comparative disadvantage (higher costs) must, by
definition, require shifting resources from where it has
a comparative advantage (lower costs) to where it has
a comparative disadvantage. The value of the output
produced from those resources (indirectly in the case
of specialization and exchange) is lower as a result.
95469_31_Ch31-p897-930.qxd 5/1/07 10:44 AM Page 922

True or False
1. Although the importance of the international sector varies enormously from place to place, the volume of interna-
tional trade increased substantially.
2. U.S. imports are considered a credit item in the balance of payment because the dollars sold to buy the necessary
foreign currency add to foreign claims against U.S. buyers.
3. Our imports provide the means by which foreigners can buy our exports.
4. Nations’ imports and exports of services are the largest component of the balance of payments.
5. When the United States runs a trade deficit in goods and services with the rest of the world, the rest of the world
must be running a trade surplus in goods and services with the United States.
6. When the United States runs a trade deficit in goods, it must run a trade surplus in services.
7. In the global economy, imports equal exports because one country’s exports are another country’s imports.
8. In voluntary trade, both participants in an exchange anticipate an improvement in their economic welfare.
9. An area should specialize in producing and selling those items in which it has an absolute advantage.
10. Differences in opportunity costs provide an incentive to gain from specialization and trade.
11. The principle of comparative advantage can be applied to regional markets.
12. A trading area may be a locality, a region, or a nation.
13. If two nations with different opportunity costs of production specialize, total output of both products may be
higher as a result.
14. By specializing in products in which it has a comparative advantage, an area can have more goods and services if it
trades the added output for other goods and services that others can produce at a lower opportunity cost.
15. By specialization according to comparative advantage and trade, two parties can each achieve consumption possibili-
ties that would be impossible for them without trade.
16. The difference between the least amount for which a supplier is willing to supply a quantity of a good or service and
the revenues a supplier actually receives for selling it is called consumer surplus.
17. Trading at the market equilibrium price generates both consumer surplus and producer surplus.
18. Once the equilibrium output is reached at the equilibrium price, all of the mutually beneficial opportunities from
trade between suppliers and demanders will have taken place.
19. The total gain to the economy from trade is the sum of consumer and producer surpluses.
20. When the domestic economy has a comparative advantage in a good, allowing international trade benefits domestic
consumers but harms domestic producers.
21. When the domestic economy has a comparative advantage in a good, exporting that good increases domestic wealth
because, while domestic consumers lose from the free trade, these negative effects are more than offset by the positive
gains captured by producers.
22. When a country does not produce a good relatively as well as other countries do, international trade benefits domes-
tic consumers but harms domestic producers.
23. When a country does not produce a good relatively as well as other countries do, allowing international trade will
increase consumer surplus less than producer surplus decreases.
24. Tariffs are usually relatively large revenue producers for governments.
25. Tariffs result in gains to domestic producers that are more than offset by losses to domestic consumers.
26. The history of infant-industry tariffs suggests that the tariffs often linger long after the industry is mature and no
longer in need of protection.
27. When foreign countries are dumping, they are trying to gain a greater share of the world market for their
products.
28. What may seem like dumping may in fact be comparative advantage.
C
H A P T E R
3 1
S T U D Y
G U I D E
923
95469_31_Ch31-p897-930.qxd 5/1/07 10:44 AM Page 923

29. The overall domestic employment effects of a tariff imposition are likely to be positive.
30. If the imposition of a tariff leads to retaliatory tariffs by other countries, domestic employment outside the industry
gaining the tariff protection will likely suffer.
31. Exporters in a country would generally be supportive of their country’s imposing import tariffs.
32. From a national defense standpoint, rather than imposing import tariffs, it makes more sense to use foreign sup-
plies in peacetime and perhaps stockpile “insurance” supplies so that large domestic supplies would be available
during wars.
33. Like tariffs, quotas directly restrict imports; but the U.S. government does not collect any revenue as the result of an
import quota, as it does with tariffs.
34. Nations have sometimes used product standards ostensibly designed to protect consumers against inferior, unsafe,
dangerous, or polluting merchandise as a means of restricting foreign competition.
35. Because resources being spent on lobbying efforts could have produced something instead, the measured deadweight
loss from tariffs and quotas will likely understate the true deadweight loss to society.
36. Unlike import tariffs and quotas, export subsidies tend to increase efficiency.
37. With subsidies, producers export goods not because their costs are lower than those of a foreign competitor but
because their costs have been artificially reduced by government action transferring income from taxpayers to the
exporter.
38. Export subsidies lead nations to export products in which they do not have a comparative advantage.
Multiple Choice
1. Assume that the opportunity cost of producing a pair of pants in the United States is 2 pounds of rice, while in
China, it is 5 pounds of rice. As a result,
a. the United States has a comparative advantage over China in the production of pants.
b. China has a comparative advantage over the United States in the production of rice.
c. mutual gains from trade can be realized by both countries if the United States exports rice to China in exchange
for shoes.
d. mutual gains from trade can be realized by both countries if the United States exports pants to China in exchange
for rice.
e. all of the above except c are true.
2. In Samoa the opportunity cost of producing one coconut is four pineapples, while in Guam the opportunity cost of
producing one coconut is five pineapples. In this situation,
a. if trade occurs, both countries will be able to consume beyond the frontiers of their original production
possibilities.
b. Guam will be better off if it exports coconuts and imports pineapples.
c. both Samoa and Guam will be better off if Samoa produces both coconuts and pineapples.
d. mutually beneficial trade cannot occur.
3. Mutually beneficial trade will occur whenever the exchange rate between the goods involved is set at a level
where
a. each country can export a good at a price above the opportunity cost of producing the good in the domestic
market.
b. each country can import a good at a price above the opportunity cost of producing the good in the domestic
market.
c. the exchange ratio is exactly equal to the opportunity cost of producing the good in each country.
d. each country will specialize in the production of those goods in which it has an absolute advantage.
e. either b or d is true.
924
95469_31_Ch31-p897-930.qxd 5/1/07 10:44 AM Page 924

Questions 4–6 refer to the following data: Alpha can produce either 18 tons of oranges or 9 tons of apples in a year, while
Omega can produce either 16 tons of oranges or 4 tons of apples in a year.
4. The opportunity costs of producing 1 ton of apples for Alpha and Omega, respectively, are
a. 0.25 ton of oranges and 0.5 ton of oranges.
b. 9 tons of oranges and 4 tons of oranges.
c. 2 tons of oranges and 4 tons of oranges.
d. 4 tons of oranges and 2 tons of oranges.
e. 0.5 ton of oranges and 0.25 ton of oranges.
5. Which of the following statements is true?
a. Alpha should export to Omega, but Omega should not export to Alpha.
b. Because Alpha has an absolute advantage in both goods, no mutual gains from trade are possible.
c. If Alpha specializes in growing apples and Omega specializes in growing oranges, they could both gain by
specialization and trade.
d. If Alpha specializes in growing oranges and Omega specializes in growing apples, they could both gain by
specialization and trade.
e. Because Alpha has a comparative advantage in producing both goods, no mutual gains from trade are possible.
6. Which of the following exchange rates between apples and oranges would allow both Alpha and Omega to gain by
specialization and exchange?
a. 1 ton of apples for 3 tons of oranges
b. 3 tons of apples for 3 tons of oranges
c. 2 tons of apples for 3 tons of oranges
d. 1 ton of oranges for 0.2 ton of apples
e. 1 ton of oranges for 0.8 ton of apples
7. After the United States introduces a tariff in the market for steel, the price of steel in the United States will
a. decrease.
b. increase.
c. remain the same.
d. change in an indeterminate manner.
8. If Japan does not have a comparative advantage in producing rice, the consequences of adopting a policy of reducing
or eliminating imports of rice into Japan would include the following:
a. Japan will be able to consume a combination of rice and other goods beyond their domestic production
possibilities curve.
b. The real incomes of Japanese rice producers would rise, but the real incomes of Japanese rice consumers
would fall.
c. The real incomes of Japanese rice consumers would rise, but the real incomes of Japanese rice producers
would fall.
d. The price of rice in Japan would fall.
9. The infant-industry argument for protectionism claims that an industry must be protected in the early stages of its
development so that
a. firms will be protected from subsidized foreign competition.
b. domestic producers can attain the economies of scale to allow them to compete in world markets.
c. adequate supplies of crucial resources will be available if needed for national defense.
d. None of the above reflect the infant-industry argument.
10. Protectionist legislation is often passed because
a. employers in the affected industry lobby more effectively than the workers in that industry.
b. both employers and workers in the affected industry lobby for protectionist policies.
925
95469_31_Ch31-p897-930.qxd 5/1/07 10:45 AM Page 925

c. trade restrictions often benefit domestic consumers in the long run, even though they must pay more in the
short run.
d. none of the above
11. Introducing a tariff on vitamin E would
a. reduce imports of vitamin E.
b. increase U.S. consumption of domestically produced vitamin E.
c. decrease total U.S. consumption of vitamin E.
d. do all of the above.
e. do none of the above.
12. A new U.S. import quota on imported steel would be likely to
a. raise the cost of production for steel-using American firms.
b. generate tax revenue to the government.
c. decrease U.S. production of steel.
d. increase the production of steel-using American firms.
e. do all of the above.
13. An import quota does which of the following?
a. decreases the price of the imported goods to consumers
b. increases the price of the domestic goods to consumers
c. redistributes income away from domestic producers of those products toward domestic producers of exports
d. a and c
e. b and c
14. A crucial difference between the impacts of import quotas and of tariffs is that
a. import quotas generate revenue to the domestic government, but tariffs do not.
b. import quotas generate no revenue to the domestic government, but tariffs do.
c. tariffs increase the prices paid by domestic consumers, but quotas do not.
d. a and c
e. b and c
15. If the United States could produce 0.5 ton of potatoes or 1 ton of wheat per worker per year, while Ireland could
produce 3 tons of potatoes or 2 tons of wheat per worker per year, the country with the comparative advantage in
producing wheat is
and the country with the absolute advantage in producing potatoes is
.
a. the United States; the United States
b. the United States; Ireland
c. Ireland; the United States
d. Ireland; Ireland
16. According to international trade theory, a country should
a. import goods in which it has an absolute advantage.
b. export goods in which it has an absolute advantage.
c. import goods in which it has a comparative disadvantage.
d. import goods in which it has an absolute disadvantage.
e. import goods when it has either a comparative or absolute disadvantage in producing them.
17. Relative to a no-international-trade initial situation, if the United States imported wine, the U.S. domestic price
of wine
a. would rise, but domestic output would fall.
b. would fall, but domestic output would rise.
c. would rise, and domestic output would rise.
d. would fall, and domestic output would fall.
926
95469_31_Ch31-p897-930.qxd 5/1/07 10:45 AM Page 926
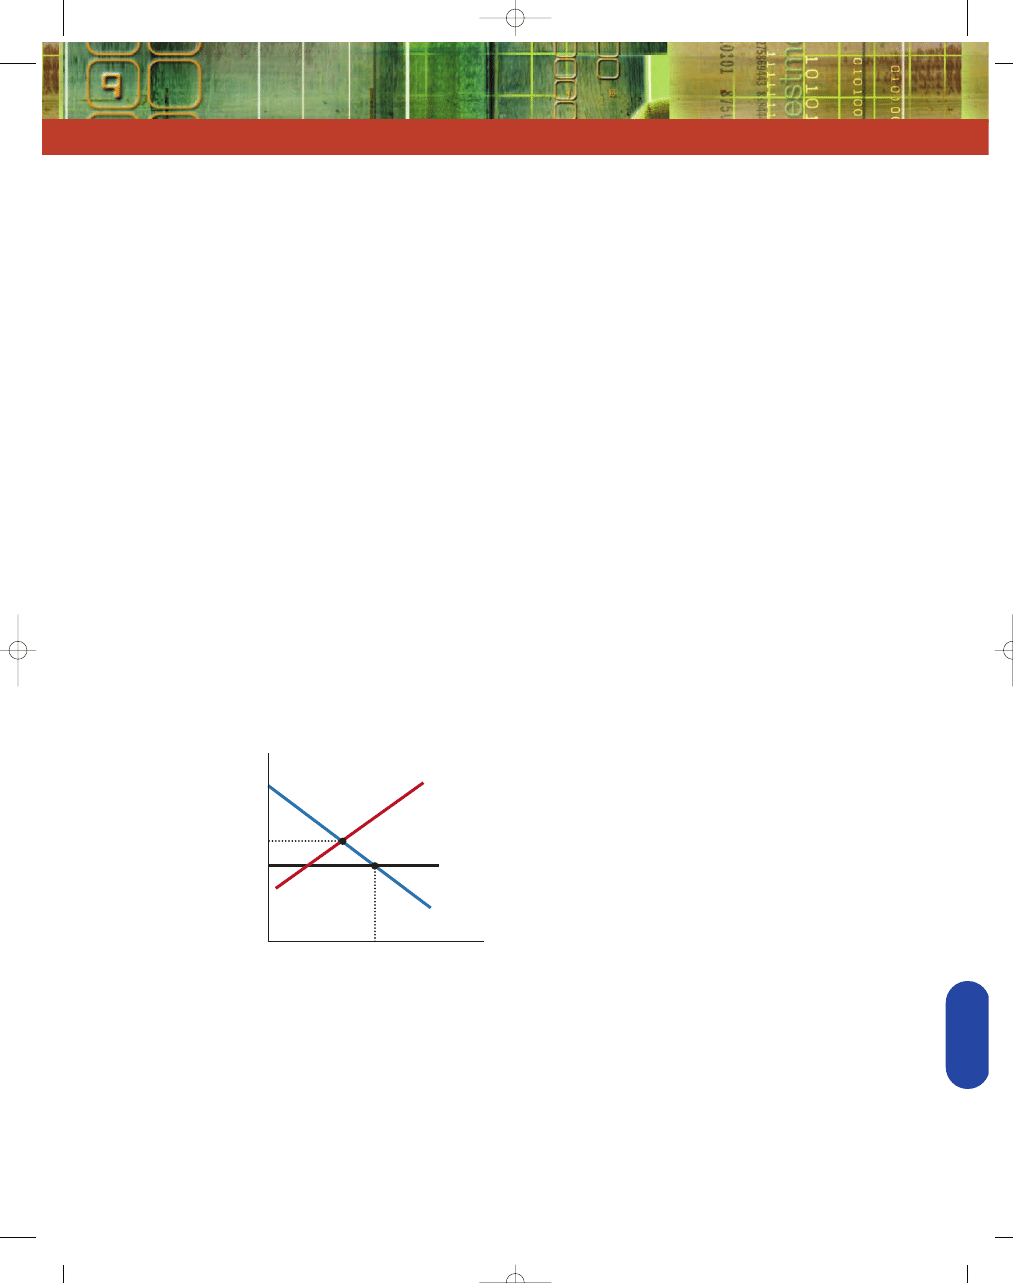
18. Relative to a no-international-trade initial situation, if the United States exported wine, the U.S. domestic price of wine
a. would rise, but domestic output would fall.
b. would fall, but domestic output would rise.
c. would rise, and domestic output would rise.
d. would fall, and domestic output would fall.
Problems
1. Bud and Larry have been shipwrecked on a deserted island. Their economic activity consists of either gathering
berries or fishing. We know that Bud can catch four fish in one hour or harvest two buckets of berries. In the same
time Larry can catch two fish or harvest two buckets of berries.
a. Fill in the following table assuming that they each spend four hours a day fishing and four hours a day harvesting berries.
Fish per Day
Buckets of Berries per Day
Bud
____________
____________
Larry
____________
____________
Total
____________
____________
b. If Bud and Larry don’t trade with each other, who is better off? Why?
c. Assume that Larry and Bud operate on straight-line production possibilities curves. Fill in the following table:
Opportunity Cost of a
Opportunity Cost
Bucket of Berries
of a Fish
Bud
____________
____________
Larry
____________
____________
d. If they traded, who has the comparative advantage in fish? In berries?
e. If Larry and Bud specialize in and trade the good in which they have a comparative advantage, how much of each
good will be produced in an eight-hour day? What are the gains from trade?
2. To protect its domestic apple industry, Botswana has for many years prevented international trade in apples. The fol-
lowing graph represents the Botswana domestic market for apples. P
BT
is the current price, and P
AT
is the world price.
a. If the government allows world trade in apples, what will happen to the price of apples in Botswana? Why?
b. Indicate the amount of apples domestic producers produce after there is trade in apples as Q
DT
. How many apples are
imported?
c. Trade in imports causes producer surplus to be reduced by the amount b. Show b on the graph.
d. The gains from trade equal the amount increased consumer surplus exceeds the loss in producer surplus. Show
this gain, g, on the graph.
e. Explain why consumers in Botswana would still be better off if they were required to compensate producers for
their lost producer surplus.
Price (per Apple)
Quantity of Apples
0
World Price
Q
AT
P
AT
P
BT
S
Domestic
D
Domestic
927
95469_31_Ch31-p897-930.qxd 5/1/07 10:46 AM Page 927

3. Using the accompanying graphs, illustrate the effects of opening up the domestic market to international trade on the
domestic price, the domestic quantity purchased, the domestic quantity produced, imports or exports, consumer sur-
plus, producer surplus, and the total welfare gain from trade.
4. Use the accompanying graphs to illustrate the effects of imposing a tariff on imports on the domestic price, the
domestic quantity purchased, the domestic quantity produced, the level of imports, consumer surplus, producer
surplus, the tariff revenue generated, and the total welfare effect from the tariff.
5. The following table represents the production possibilities in two countries:
Country A
Country B
Good X
Good Y
Good X
Good Y
0
32
0
24
4
24
4
18
8
16
8
12
12
8
12
6
16
0
16
0
Which country has a comparative advantage at producing Good X? How can you tell?
Which country has a comparative advantage at producing Good Y?
Quantity of Shoes
(world)
0
0
Price of Shoes (world)
Price of Shoes (domestic)
Quantity of Shoes (domestic)
S
DOMESTIC
D
WORLD
S
WORLD
D
DOMESTIC
World Market
Domestic Market
Price of Wheat (domestic)
Price of Wheat (world)
Quantity of Wheat (domestic)
S
WORLD
D
WORLD
Quantity of Wheat (world)
World Market
Domestic Market
0
0
D
DOMESTIC
S
DOMESTIC
928
95469_31_Ch31-p897-930.qxd 5/1/07 10:46 AM Page 928

6. Suppose the United States can produce cars at an opportunity cost of two computers for each car it produces.
Suppose Mexico can produce cars at an opportunity cost of eight computers for each car it produces. Indicate how
both countries can gain from free trade.
7. Evaluate the following statement: “Small developing economies must first become self-sufficient before benefiting
from international trade.”
8. Evaluate the following statement: “The United States has an absolute advantage in growing wheat. Therefore, it must
have a comparative advantage in growing wheat.”
9. Explain why imposing a tariff causes a net welfare loss to the domestic economy.
10. If imposing tariffs and quotas harms consumers, why don’t consumers vigorously oppose the implementation of these
protectionist policies?
11. NAFTA (North American Free Trade Agreement) is an agreement among the United States, Canada, and Mexico to
reduce trade barriers and promote the free flow of goods and services across borders. Many U.S. labor groups were
opposed to NAFTA.
Can you explain why? Can you predict how NAFTA might alter the goods and services produced in the partici-
pating countries?
12. Go through your local newspaper and locate four news items regarding the global economy. Identify the significance
of each of these news items to the U.S. economy and whether they are likely to affect international trade.
929
95469_31_Ch31-p897-930.qxd 5/1/07 10:47 AM Page 929

95469_31_Ch31-p897-930.qxd 5/1/07 10:47 AM Page 930
Wyszukiwarka
Podobne podstrony:
Exploring Economics 4e Chapter 09
Exploring Economics 4e Chapter 18
Exploring Economics 4e Chapter 30
Exploring Economics 4e Chapter 07
Exploring Economics 4e Chapter 11
Exploring Economics 4e Chapter 22
Exploring Economics 4e Chapter 17
Exploring Economics 4e Chapter 13
Exploring Economics 4e Chapter 10
Exploring Economics 4e Chapter 14
Exploring Economics 4e Chapter 27
Exploring Economics 4e Chapter 25
Exploring Economics 4e Chapter 29
Exploring Economics 4e Chapter 15
Exploring Economics 4e Chapter 23
Exploring Economics 4e Chapter 26
Exploring Economics 4e Chapter 24
Exploring Economics 4e Chapter 32
Exploring Economics 4e Chapter 21
więcej podobnych podstron