1
Podstawy Biochemii
Wyk
ł
ad 2.
Chemia Biologiczna III R
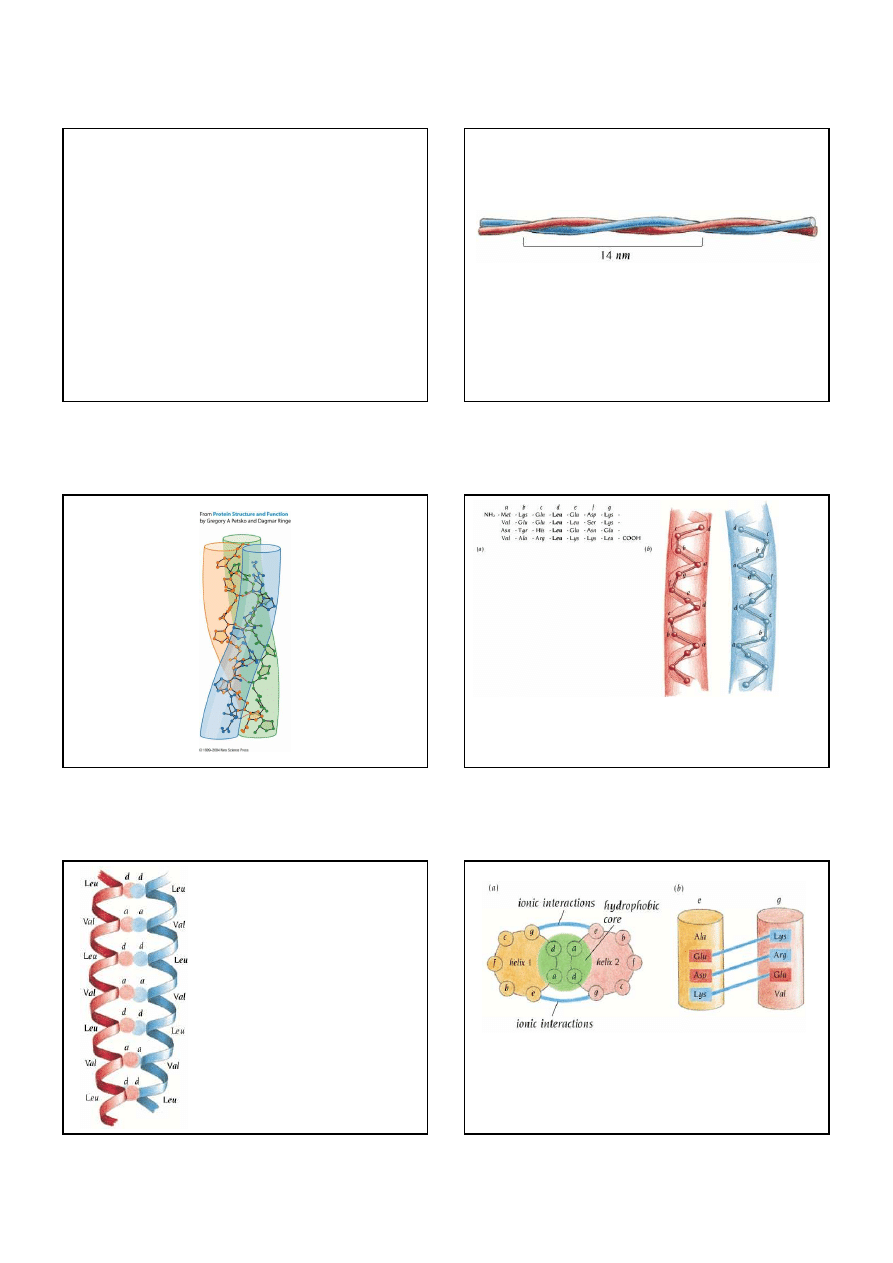
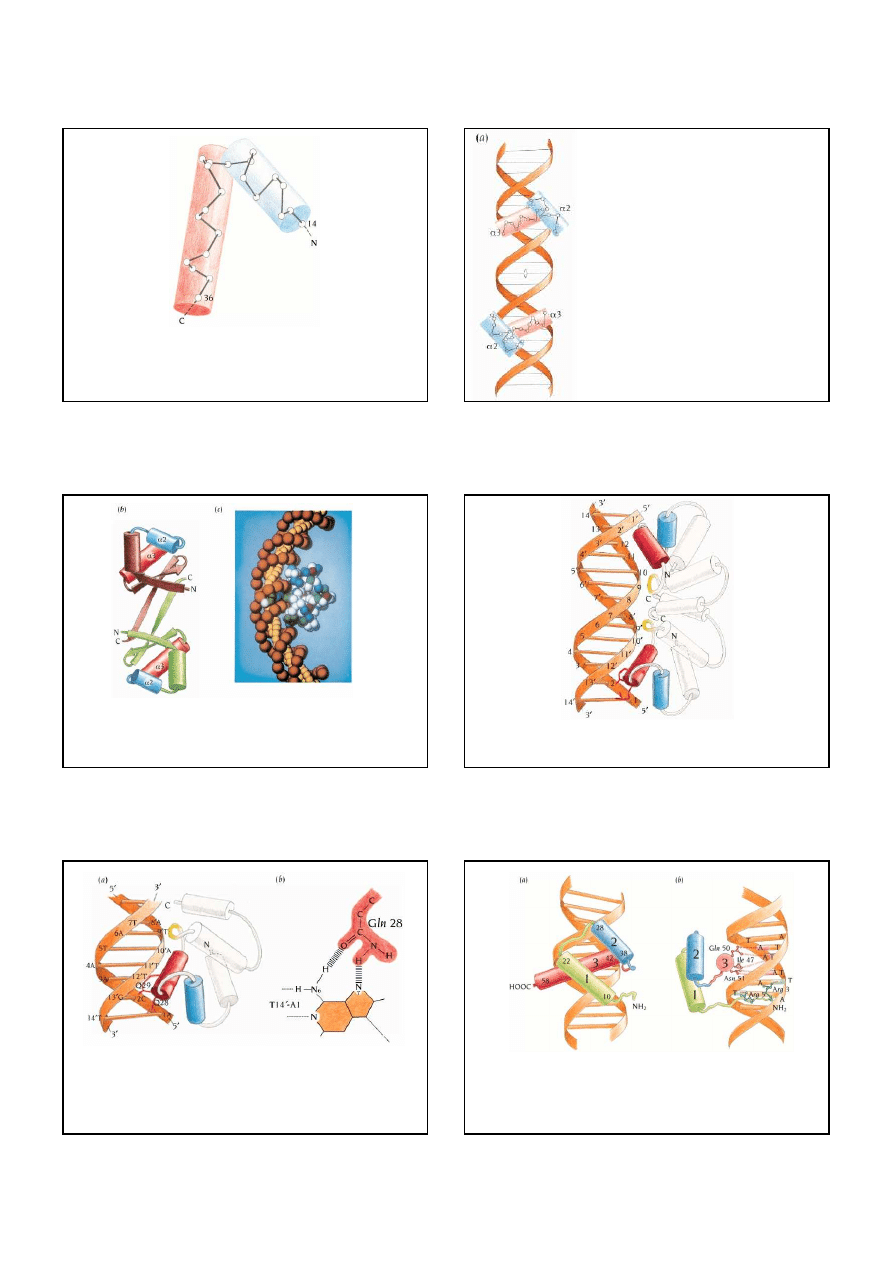
Schematic diagram of the coiled-coil structure. Two
α
helices are
intertwined and gradually coil around each other.
Bia
ł
ka helikalne
Structure of collagen
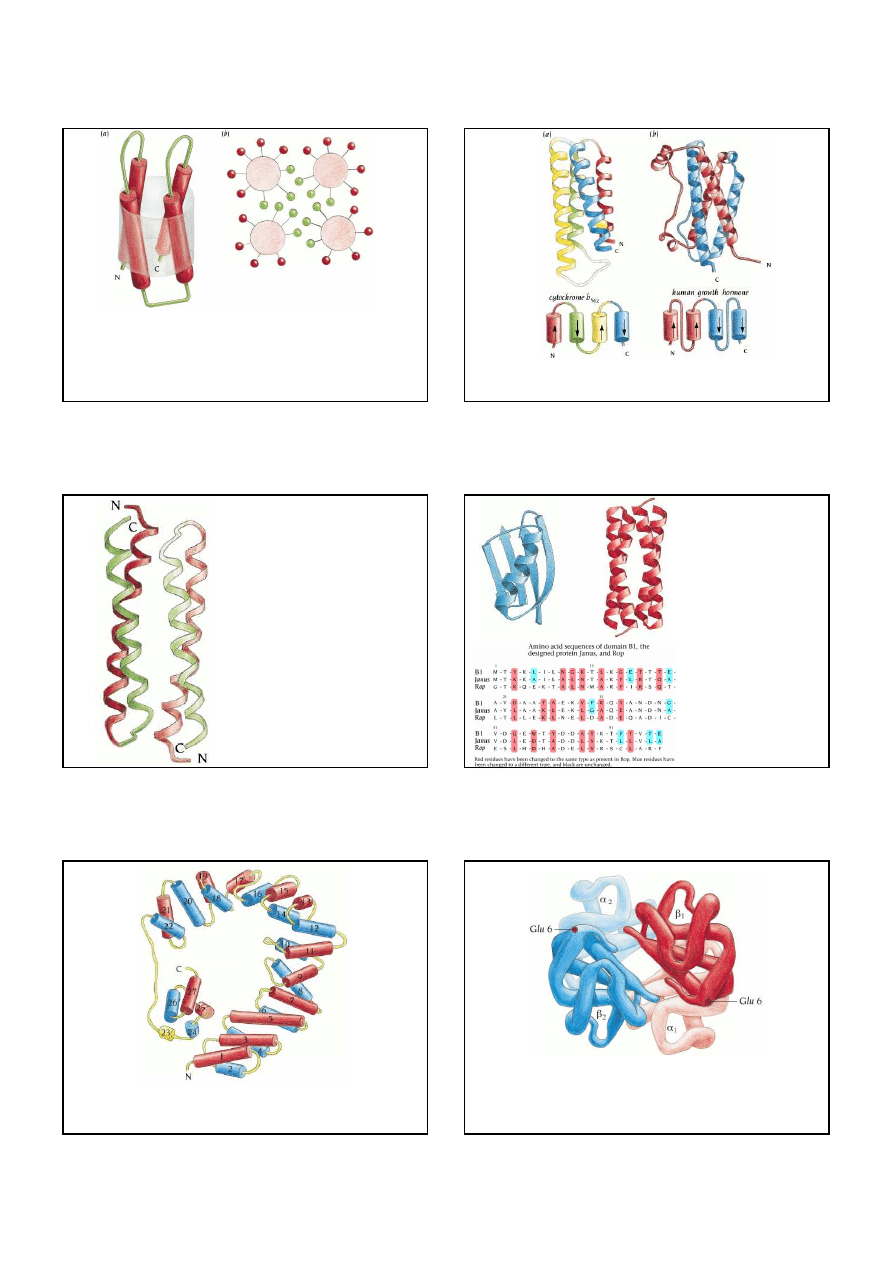
Repetitive pattern of amino acids in a coiled-coil a helix. (a) The amino acid sequence of the
transcription
factor GCN4
showing a heptad repeat of leucine residues. Within each heptad the amino acids are labeled
a-g. (b) Schematic diagram of one heptad repeat in a coiled-coil structure showing the backbone of the
polypeptide chain. The
α
helices in the coiled-coil are slightly distorted so that the helical repeat is 3.5
residues rather than 3.6, as in a regular helix. There is therefore an integral repeat of seven residues along
the helix.
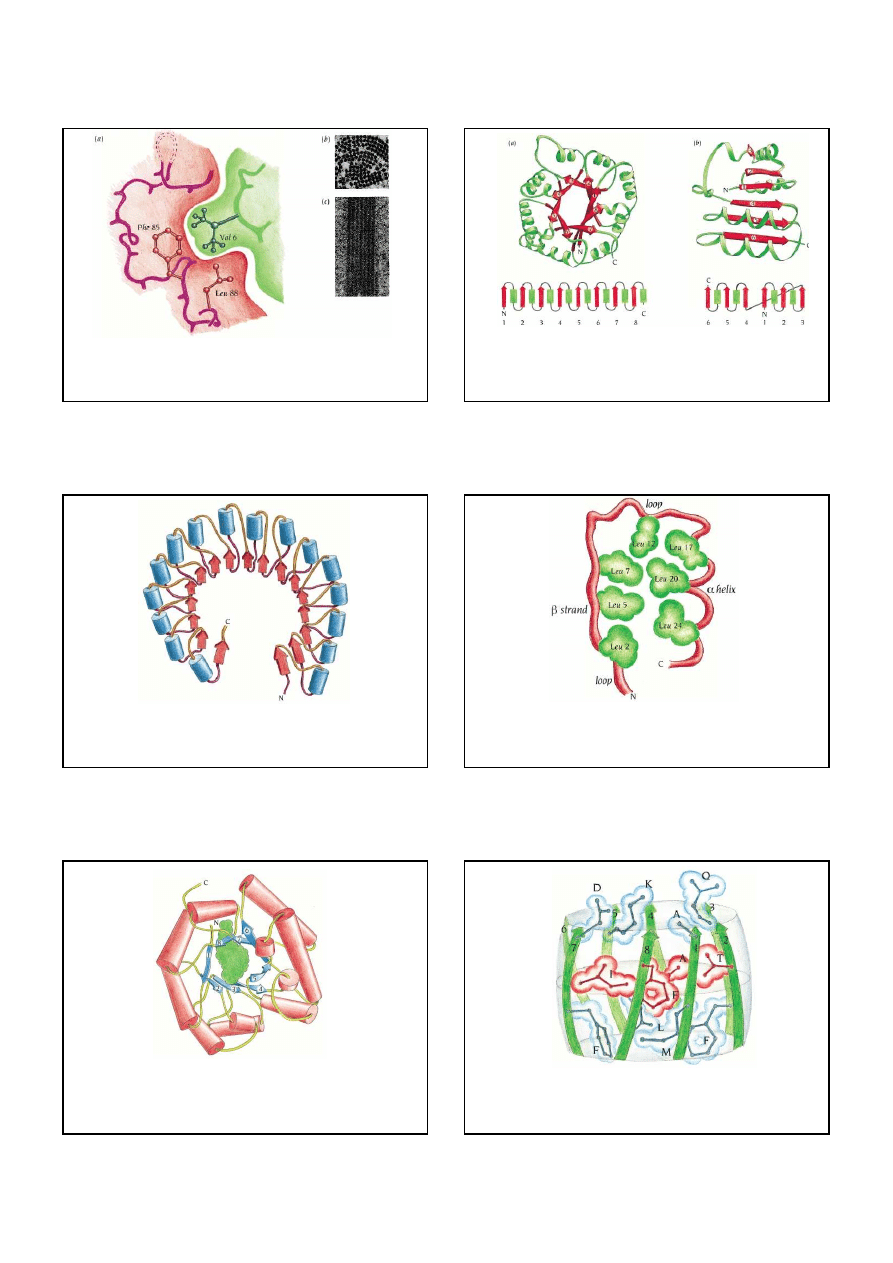
Schematic diagram showing the packing of hydrophobic
side chains between the two a helices in a coiled-coil
structure. Every seventh residue in both
α
helices is a
leucine, labeled "d." Due to the heptad repeat, the d-
residues pack against each other along the coiled-coil.
Residues labeled "a" are also usually hydrophobic and
participate in forming the hydrophobic core along the
coiled-coil.
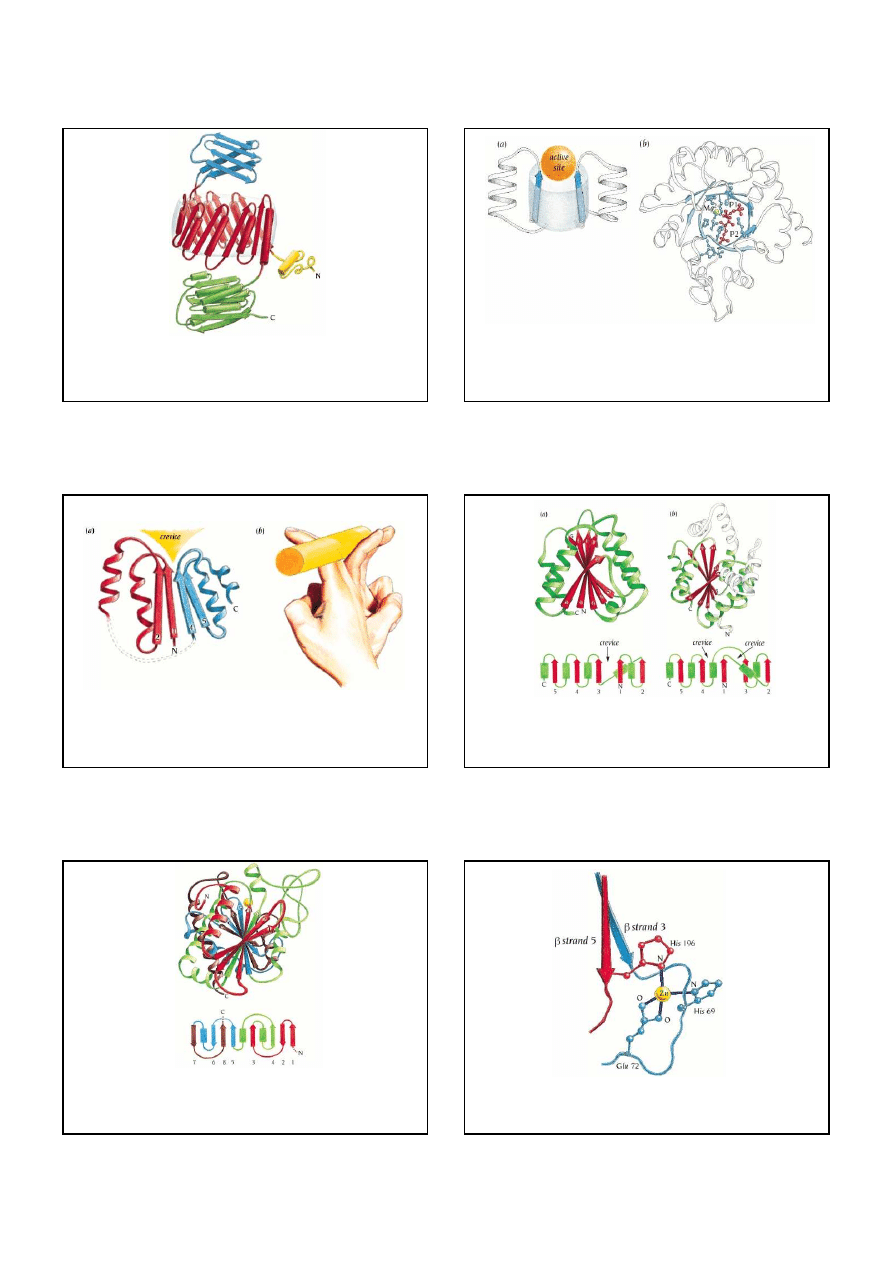
Salt bridges can stabilize coiled-coil structures and are sometimes important for the formation
of heterodimeric coiled-coil structures. The residues labeled "e" and "g" in the heptad sequence
are close to the hydrophobic core and can form salt bridges between the two
α
helices of a
coiled-coil structure, the e-residue in one helix with the g-residue in the second and vice versa.
(a) Schematic view from the top of a heptad repeat. (b) Schematic view from the side of a
coiled-coil structure.
2
Four-helix bundles
frequently occur as domains in a proteins. The arrangement of the
α
helices is such
that adjacent helices in the amino acid sequence are also adjacent in the three-dimensional structure. Some
side chains from all four helices are buried in the middle of the bundle, where they form a hydrophobic core.
(a) Schematic representation of the path of the polypeptide chain in a four-helix-bundle domain. Red
cylinders are a helices. (b) Schematic view of a projection down the bundle axis. Large circles represent the
main chain of the
α
helices; small circles are side chains. Green circles are the buried hydrophobic side
chains; red circles are side chains that are exposed on the surface of the bundle, which are mainly
hydrophilic.
The polypeptide chains of
cytochrome b562
and
human growth hormone
both form four-helix-
bundle structures. In cytochrome b562 (a) adjacent helices are antiparallel, whereas the human
growth hormone (b) has two pairs of parallel a helices joined in an antiparallel fashion.
Schematic diagram of the dimeric
Rop
molecule.
Each subunit comprises two
α
helices arranged
in a coiled-coil structure with side chains packed
into the hydrophobic core according to the
"knobs in holes" model. The two subunits are
arranged in such a way that a bundle of four
α
helices is formed.
Ribbon diagram
representations of the
structures of domain B1
from protein G (blue) and
the dimer of Rop (red).
The
fold of B1 has been
converted to an
α
-helical
protein like Rop by
changing 50 % of its
amino acids sequence.
Schematic diagram of the structure of one domain of a bacterial
muramidase
, comprising
450 amino acid residues. The structure is built up from
27
α
helices
arranged in a two-
layered ring. The ring has a large central hole, like a doughnut, with a diameter of about 30 Å
The hemoglobin molecule is built up of four polypeptide chains: two
α
chains and two
β
chains. Each chain has a three-dimensional structure similar to that of myoglobin: the
globin fold
. In
sickle-cell
hemoglobin
Glu 6 in the
ββββ
chain is mutated to Val
, thereby
creating a hydrophobic patch on the surface of the molecule.
3
Sickle-cell hemoglobin molecules polymerize due to the hydrophobic patch introduced by the
mutation Glu 6 to Val in the
β
chain
. The diagram (a) illustrates how this hydrophobic patch
(green) interacts with a hydrophobic pocket (red) in a second hemoglobin molecule, whose
hydrophobic patch interacts with the pocket in a third molecule, and so on. Electron micrographs
of sickle-cell hemoglobin fibers are shown in cross-section in (b) and along the fibers in (c).
Alpha/beta
domains are found in many proteins. They occur in different classes,
two of which are shown here: (a) a closed barrel exemplified by schematic and topological
diagrams of the enzyme
triosephosphate isomerase
and (b) an open twisted sheet with helices
on both sides, as in the coenzyme-binding domain of some
dehydrogenases
. Both classes are
built up from
β
-
α
-
β
motifs that are linked such that the
β
strands are parallel. Rectangles
represent
α
helices, and arrows represent
β
strands in the topological diagrams.
Schematic diagram of the structure of the
ribonuclease inhibitor
. The molecule, which is
built up by repetitive
β
-loop-
α
motifs
, resembles a horseshoe with a 17-stranded parallel
β
sheet on the inside and 16
α
helices on the outside. The
β
sheet is light red,
α
helices are blue,
and loops that are part of the
β
-loop-
α
motifs are orange.
Schematic diagram illustrating the role of the conserved leucine residues (green) in the
leucine-
rich motif
in stabilizing the
β
-loop-
α
structural module. In the
ribonuclease inhibitor,
leucine residues 2, 5, and 7 from the
β
strand pack against leucine residues 17, 20, and 24 from
the a helix as well as leucine residue 12 from the loop to form a hydrophobic core between the
β
strand and the a helix.
Schematic diagram of the structure of the
α
αα
α
/
ββββ
-barrel
domain of the enzyme
methylmalonyl-
coenzyme A mutase
.
Alpha helices are red, and
β
strands are blue. The inside of the barrel is
lined by small hydrophilic side chains (serine and threonine) from the
β
strands, which creates a
hole in the middle where one of the substrate molecules,
coenzyme A (green),
binds along
the axis of the barrel from one end to the other.
In most
α
αα
α
/
ββββ
-barrel
structures the eight
β
strands of the barrel enclose a tightly packed
hydrophobic core formed entirely by side chains from the
β
strands. The core is arranged in three
layers, with each layer containing four side chains from alternate
β
strands. The schematic
diagram shows this packing arrangement in the
α
/
β
barrel of the enzyme
glycolate oxidase
4
The polypeptide chain of the enzyme
pyruvate kinase
folds into several domains, one of
which is an
α
αα
α
/
ββββ
barrel
(red). One of the loop regions in this barrel domain is extended and
comprises about 100 amino acid residues that fold into a separate domain (blue) built up from
antiparallel
ββββ
strands
.
The C-terminal region of about 140 residues forms a third domain
(green), which is an open
twisted
α
αα
α
/
ββββ
structure
.
The active site in all
α
αα
α
/
ββββ
barrels
is in a pocket formed by the loop regions that connect the carboxy ends of
the
β
strands with the adjacent a helices, as shown schematically in (a), where only two such loops are
shown. (b) A view from the top of the barrel of the active site of the enzyme
RuBisCo
(ribulose
bisphosphate carboxylase),
which is involved in CO2 fixation in plants. A substrate analog (red) binds
across the barrel with the two phosphate groups, P1 and P2, on opposite sides of the pocket. A number of
charged side chains (blue) from different loops as well as a Mg2+ ion (yellow) form the substrate-binding
site and provide catalytic groups.
(a) The
active site in open twisted
α
αα
α
/
ββββ
domains
is in a crevice outside the carboxy ends of
the
β
strands. This crevice is formed by two adjacent loop regions that connect the two strands
with
α
helices on opposite sides of the
β
sheet. This is illustrated by the curled fingers of two
hands (b), where the top halves of the fingers represent loop regions and the bottom halves
represent the
β
strands. The rod represents a bound molecule in the binding crevice.
Examples of different types of open
twisted
α
/
β
structures
.
Both schematic and topological
diagrams are given. In the topological diagrams, arrows denote strands of
β
sheet and rectangles
denote
α
helices. (a) The
FMN-binding redox protein flavodoxin
. (b) The enzyme
adenylate
kinase
, which catalyzes the reaction AMP + ATP 2 ADP.
Schematic and topological diagrams for the structure of the enzyme
carboxypeptidase
. The
central region of the mixed
β
sheet contains four adjacent parallel
β
strands (numbers 8, 5, 3, and
4), where the strand order is reversed between strands 5 and 3. The active-site zinc atom (yellow
circle) is bound to side chains in the loop regions outside the carboxy ends of these two
β
strands.
The first part of the polypeptide chain is red, followed by green, blue, and brown.
Detailed view of the zinc environment in
carboxy-peptidase
. The active-site zinc atom is bound
to His 69 and Glu 72, which are part of the loop region outside
β
strand 2. In addition, His 196,
which is the last residue of
β
strand 5, also binds the zinc.
5
The enzyme superoxide dismutase
(SOD). SOD is a
β
structure comprising
eight antiparallel
β
strands
(a). In addition, SOD has two metal atoms, Cu and Zn (yellow circles), that participate
in the catalytic action: conversion of a superoxide radical to hydrogen peroxide and oxygen. The
eight
β
strands are arranged around the surface of a barrel, which is viewed along the barrel axis
in (b) and perpendicular to this axis in (c).
Beta
bia
ł
ka
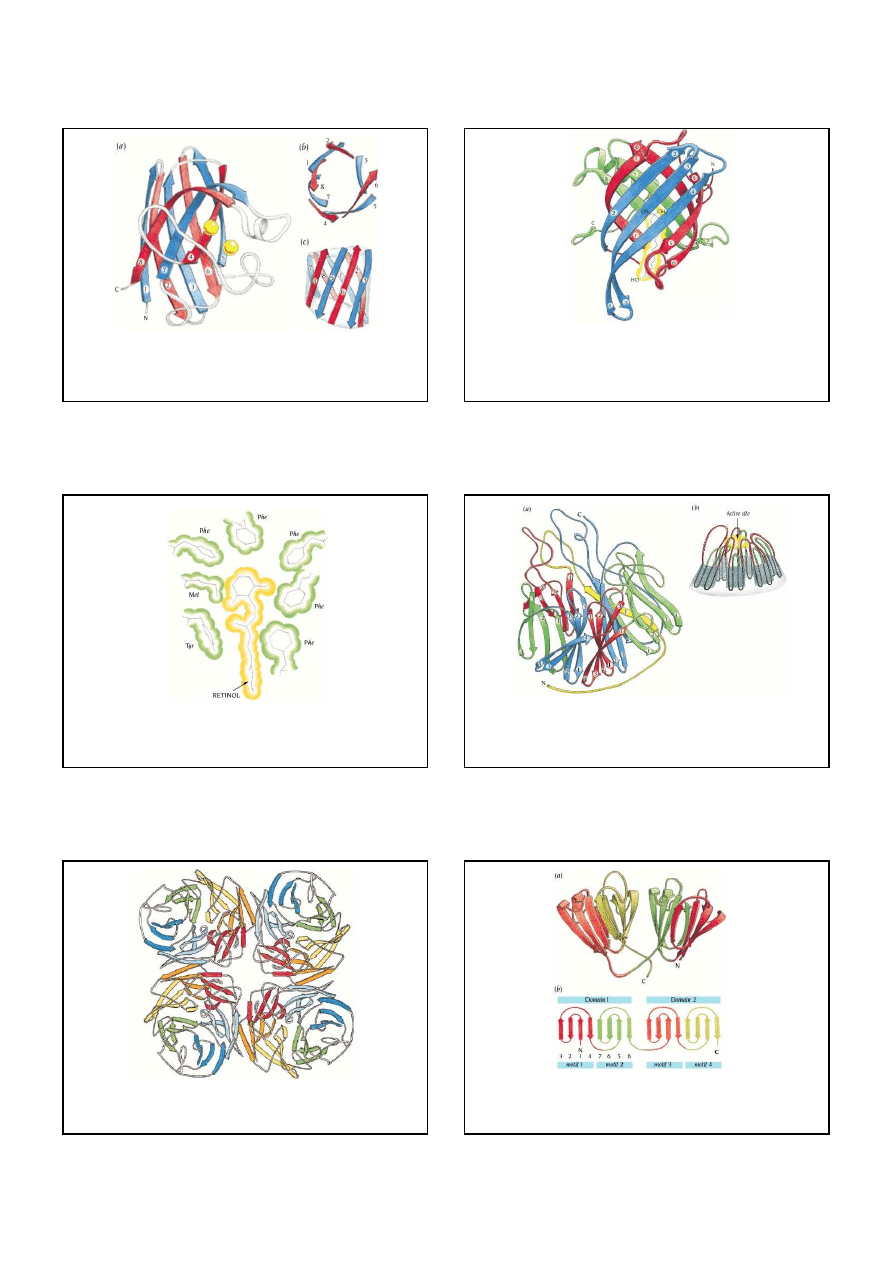
Schematic diagram of the structure of human
plasma retinol-binding protein (RBP),
which is
an up-and-down
β
barrel. The
eight antiparallel
β
strands twist and curl such that the structure
can also be regarded as two
β
sheets (green and blue) packed against each other. Some of the
twisted
β
strands (red) participate in both
β
sheets. A
retinol molecule,
vitamin A (yellow),
is bound inside the barrel, between the two
β
sheets, such that its only hydrophilic part (an OH
tail) is at the surface of the molecule.
The binding site for retinol inside the RBP barrel is lined with hydrophobic residues. They
provide a hydrophobic surrounding for the hydrophobic part of the retinol molecule.
The
six four-stranded motifs
in a single subunit of
neuraminidase
form the
six blades
of a
propeller-like structure. A schematic diagram of the subunit structure shows the propeller viewed
from its side (a). An idealized propeller structure viewed from the side to highlight the position of
the active site is shown in (b). The loop regions that connect the motifs (red in b) in combination
with the loops that connect strands 2 and 3 within the motifs (green in b) form a wide funnel-
shaped active site pocket.
Schematic view down the fourfold axis of the
tetrameric molecule of
neuraminidase
Schematic diagram (a) and topology diagram (b) for the
γγγγ
-crystallin molecule
. The two
domains of the complete molecule have the same topology; each is composed of
two Greek key
motifs
that are joined by a short loop region.
6
Bacteriophage P22 tailspike protein
.
Schematic diagrams of the
three-sheet
β
helix
. (a) The
three sheets of parallel
β
strands are colored green, blue and yellow. Seven complete coils are
shown in this diagram but the number of coils varies in different structures. Two of the
β
sheets
(blue and yellow) are parallel to each other and are perpendicular to the third (green). (b) Each
structural unit is composed of three
β
strands connected by three loop regions (labeled a, b and c).
Loop a (red) is invariably composed of only two residues, whereas the other two loop regions
vary in length.
Schematic diagrams of the structure of the enzyme
pectate lyase C
, which has a
three-
sheet parallel
ββββ
-helix topology
. (a)
Idealized diagram highlighting the helical nature of
the path of the polypeptide chain which comprises eight helical turns. Dotted regions indicate positions
where large external loops have been removed for clarity. (b) Ribbon diagram of the polypeptide chain.
The predominant secondary structural elements are three parallel
β
sheets which are colored green, blue
and yellow. Each
β
sheet is composed of 7-10 parallel b strands with an average length of four to five
residues in each strand. The short loop regions of two residues length are shown in red.
Examples of schematic diagrams of the type pioneered by Jane Richardson. Diagram (a)
illustrates the structure of
myoglobin
(b)
thiophosphate isomerase
. Such diagrams can
easily be obtained from databases of protein structures, such as PDB, SCOP or CATH,
available on the World Wide Web.
Beta sheets are usually represented simply by arrows in topology diagrams that show both the
direction of each
β
strand and the way the strands are connected to each other along the
polypeptide chain. Such topology diagrams are here compared with more elaborate schematic
diagrams for different types of
β
sheets. (a)
Four strands. Antiparallel
β
sheet
in one domain of
the enzyme
aspartate transcarbamoylase
. (b)
Five strands. Parallel
β
sheet in the redox protein
flavodoxin
(c)
Eight strands. Antiparallel barrel
in the electron carrier
plastocyanin
. This is a
closed barrel where the sheet is folded such that
β
strands 2 and 8 are adjacent.
Two
α
helices that are connected by a short loop region in a specific geometric arrangement
constitute a helix-turn-helix motif. Two such motifs are shown: the
DNA-binding motif
and
the
calcium-binding motif
(b), which is present in many proteins whose function is
regulated by calcium.
Motywy strukturalne
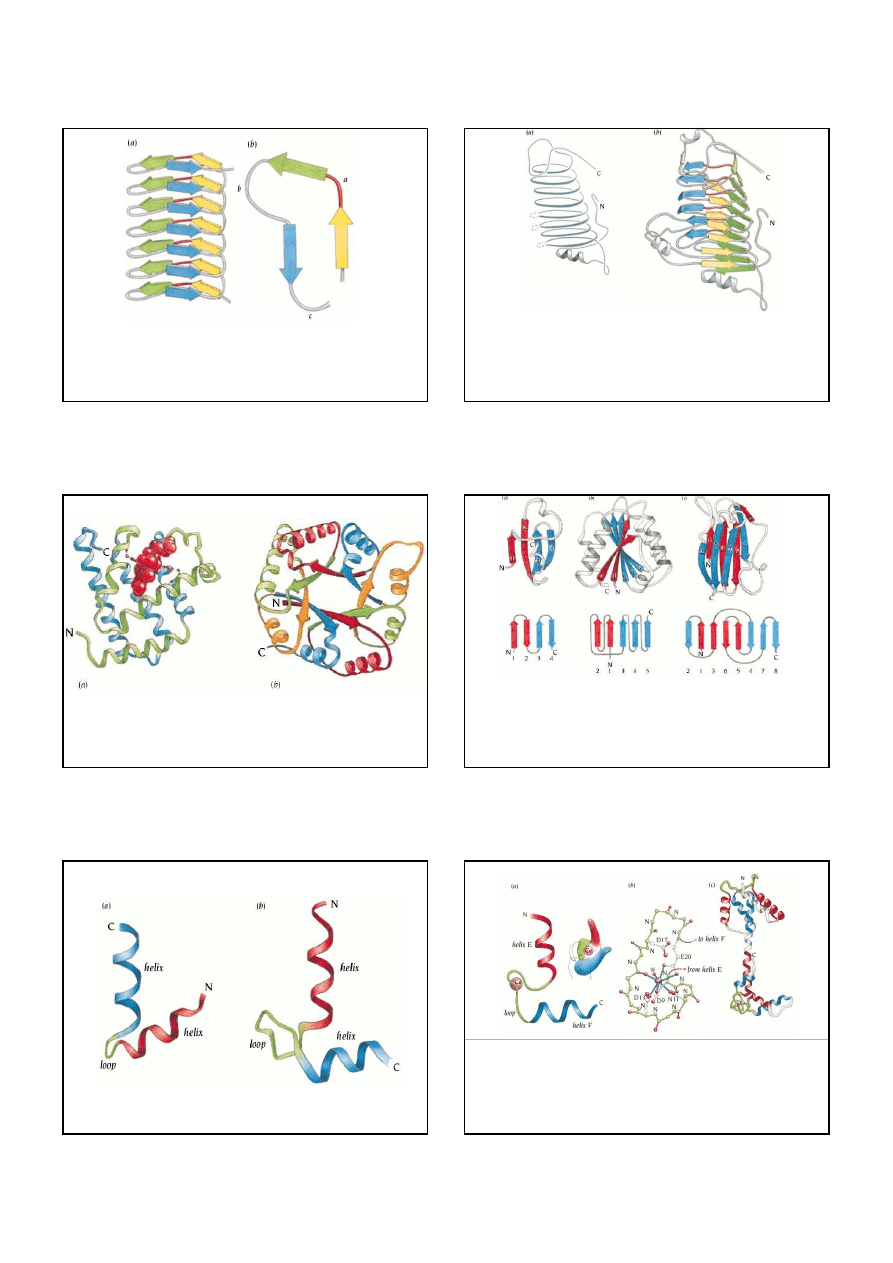
Schematic diagrams of the calcium-binding motif
. (a) The calcium-binding motif is symbolized by a
right hand. Helix E (red) runs from the tip to the base of the forefinger. The flexed middle finger corresponds
to the green loop region of 12 residues that binds calcium (pink). Helix F (blue) runs to the end of the thumb.
(b) The calcium atom is bound to one of the motifs in the muscle protein
troponin-C
through six oxygen
atoms: one each from the side chains of Asp (D) 9, Asn (N) 11, and Asp (D) 13; one from the main chain of
residue 15; and two from the side chain of Glu (E) 20. In addition, a water molecule (W) is bound to the
calcium atom. (c) Schematic diagram illustrating that the structure of
troponin-C
is built up from four EF
motifs-colored as in (a). Two of these bind Ca (pink balls) in the molecules that were used for the structure
determination.
7
Schematic diagram of the conformational changes of
calmodulin
upon peptide binding. (a) In the
free form the calmodulin molecule is dumbbell-shaped comprising two domains (red and green),
each having two
EF hands
with bound
calcium
(yellow). (b) In the form with bound peptides
(blue) the
α
helix linker has been broken, the two ends of the molecule are close together and
they form a compact globular complex. The internal structure of each domain is essentially
unchanged. The bound peptide binds as an
α
helix.
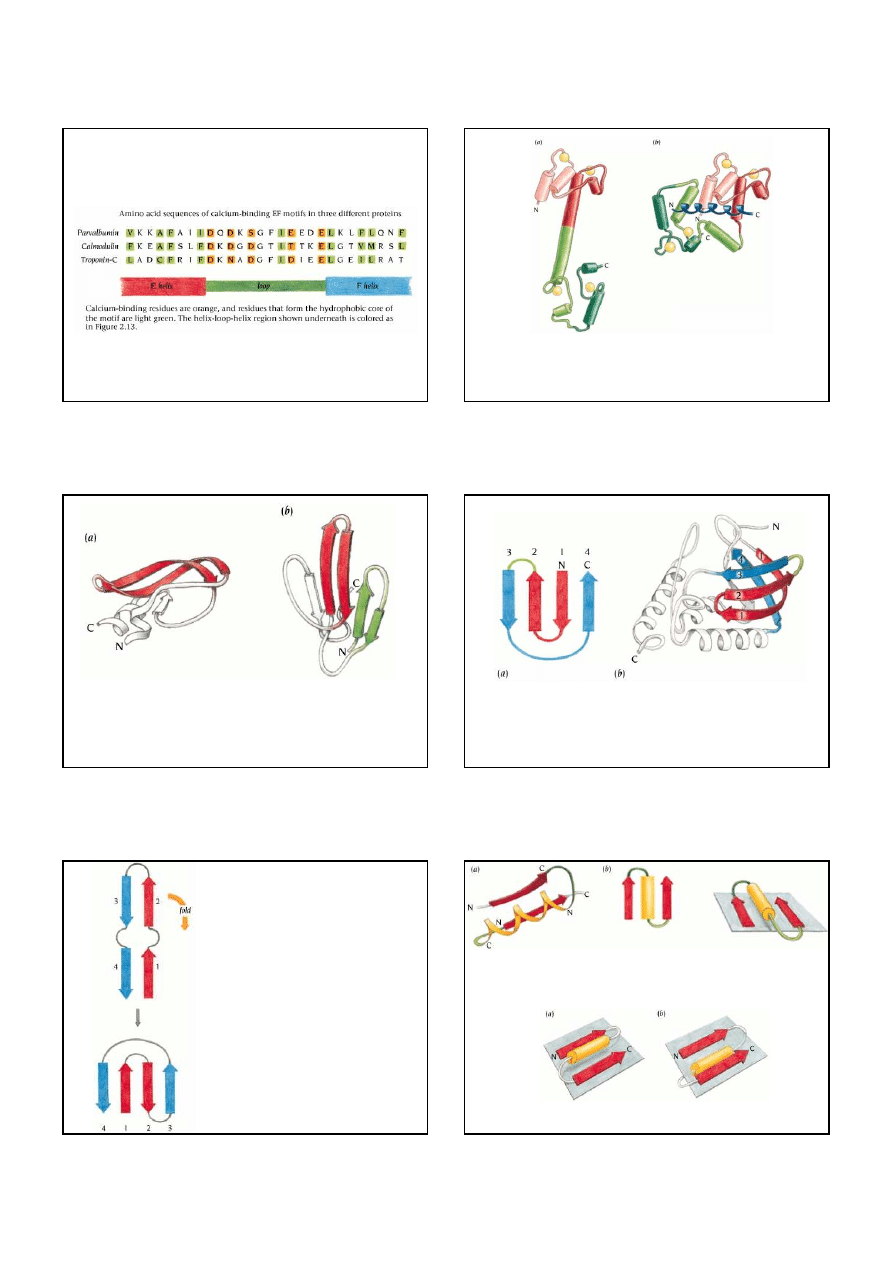
The hairpin motif
is very frequent in
β
sheets and is built up from two adjacent
β
strands
that are joined by a loop region. Two examples of such motifs are shown. (a) Schematic
diagram of the structure of
bovine trypsin inhibitor
.
The hairpin motif is colored red. (b)
Schematic diagram of the structure of the
snake venom erabutoxin
. The two hairpin motifs
within the
β
sheet are colored red and green.
The Greek key motif
is found in antiparallel
β
sheets when four adjacent
β
strands are
arranged in the pattern shown as a topology diagram in (a). The motif occurs in many
β
sheets and is exemplified here by the enzyme
Staphylococcus nuclease
(b). The four
β
strands that form this motif are colored red and blue.
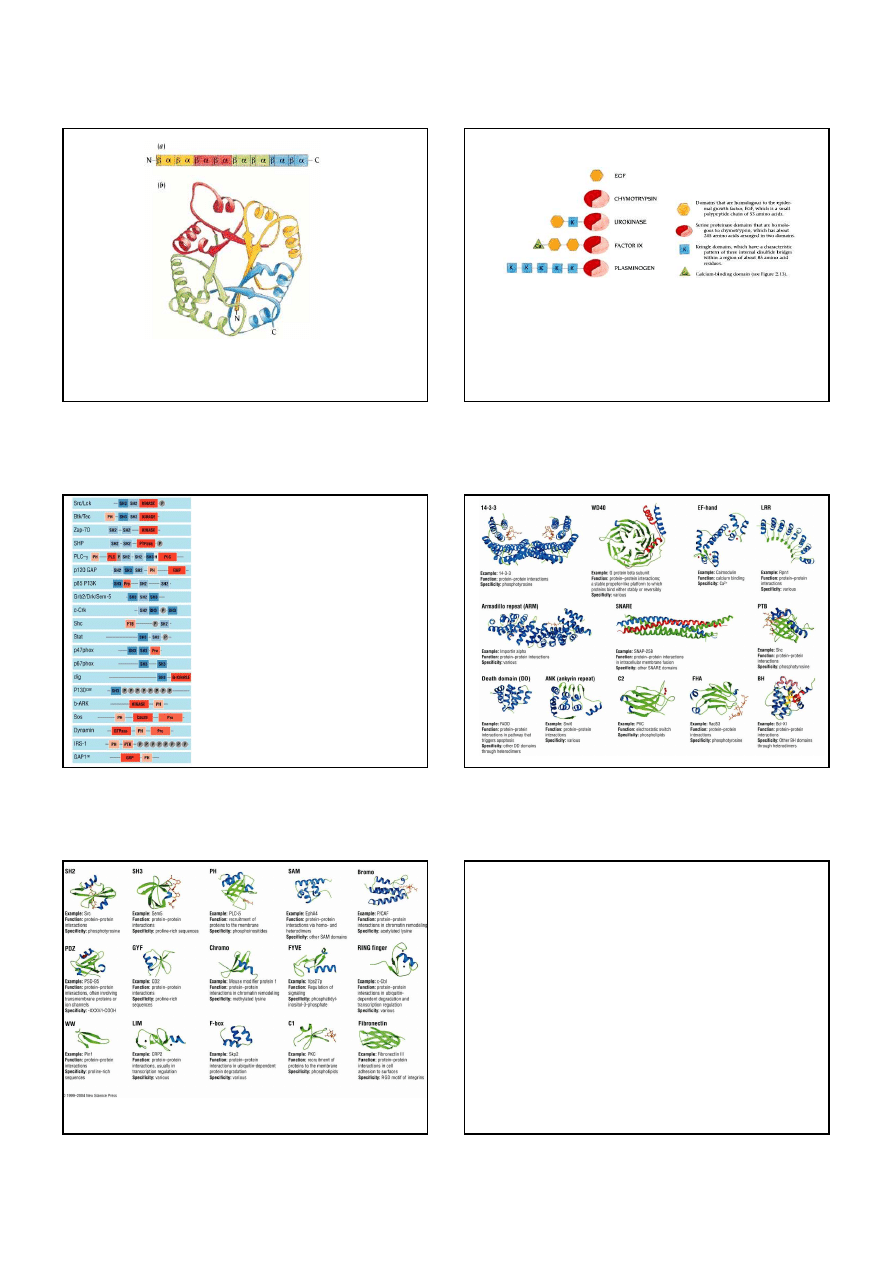
Suggested folding pathway from a hairpinlike
structure to the Greek key motif. Beta strands 2
and 3 fold over such that strand 2 is aligned
adjacent and antiparallel to strand 1.
Two adjacent parallel
β
strands are usually connected by an
α
helix from the C-terminus of strand 1 to the
N-terminus of strand 2. Most protein structures that contain parallel
β
sheets are built up from
combinations of such
ββββ
-
α
αα
α
-
ββββ
motifs
. Beta strands are red, and a helices are yellow. Arrows represent
β
strands, and cylinders represent helices. (a) Schematic diagram of the path of the main chain. (b)
Topological diagrams of the
β
-
α
-
β
motif.
The
β
-
α
-
β
motif can in principle have two "hands." (a) This connection with the helix above the sheet
is found in almost all proteins and is called right-handed because it has the same hand as a right-handed
α
helix. (b) The left-handed connection with the helix below the sheet.
8
Motifs that are adjacent in the amino acid sequence are also usually adjacent in the three-
dimensional structure.
Triose-phosphate isomerase
is built up from four
ββββ
-
α
αα
α
-
ββββ
-
α
αα
α
motifs
that are consecutive both in the amino acid sequence (a) and in the three-dimensional structure
(b).
Organization of polypeptide chains into domains. Small protein molecules like the epidermal
growth factor, EGF, comprise only one domain. Others, like the serine proteinase
chymotrypsin, are arranged in two domains that are required to form a functional unit. Many
of the proteins that are involved in blood coagulation and fibrinolysis, such as urokinase,
factor IX, and plasminogen, have long polypeptide chains that comprise different
combinations of domains homologous to EGF and serine proteinases and, in addition,
calcium-binding domains and Kringle domains.
Schematic diagram of the domain
arrangement of a number of signal
transduction proteins
Interaction domains
Interaction domains
9
The
DNA-binding helix-turn-helix motif
in lambda Cro. Ca positions of the amino
acids in this motif have been projected onto a plane and the two helices outlined. The second
helix (red) is called the recognition helix because it is involved in sequence-specific recognition
of DNA.
The
helix-turn-helix motif
in
lambda Cro
bound to DNA
(orange) with the two recognition helices (red) of the Cro
dimer sitting in the major groove of DNA. The binding
model, suggested by Brian Matthews, is shown
schematically in (a) with connected circles for the Ca
positions.
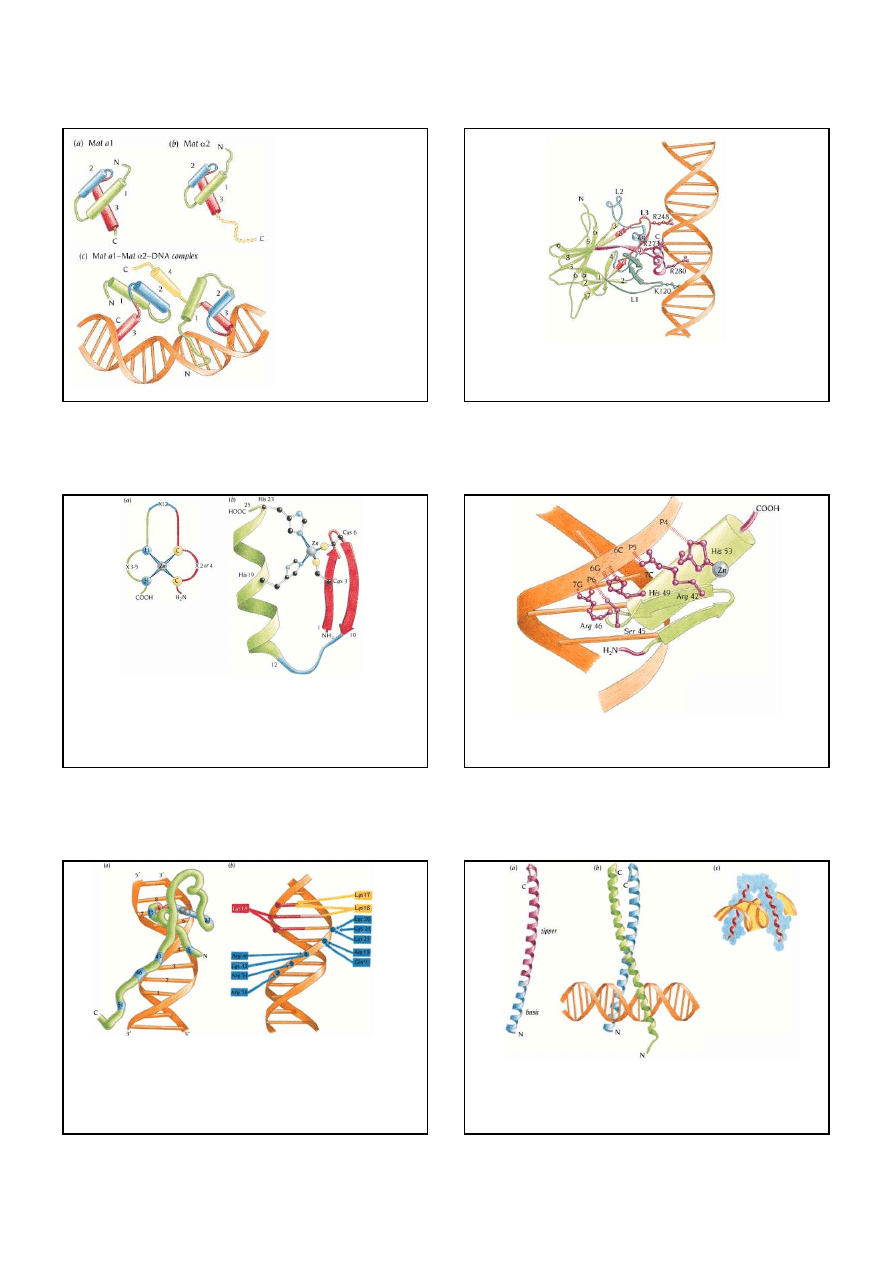
The
helix-turn-helix motif
in lambda Cro bound to DNA (orange) with the two recognition
helices (red) of the Cro dimer sitting in the major groove of DNA. (b) A schematic diagram of
the Cro dimer with different colors for the two subunits. (c) A schematic space-filling model
of the dimer of Cro bound to a bent B-DNA molecule. The sugar-phosphate backbone of
DNA is orange, and the bases are yellow. Protein atoms are colored red, blue, green, and
white.
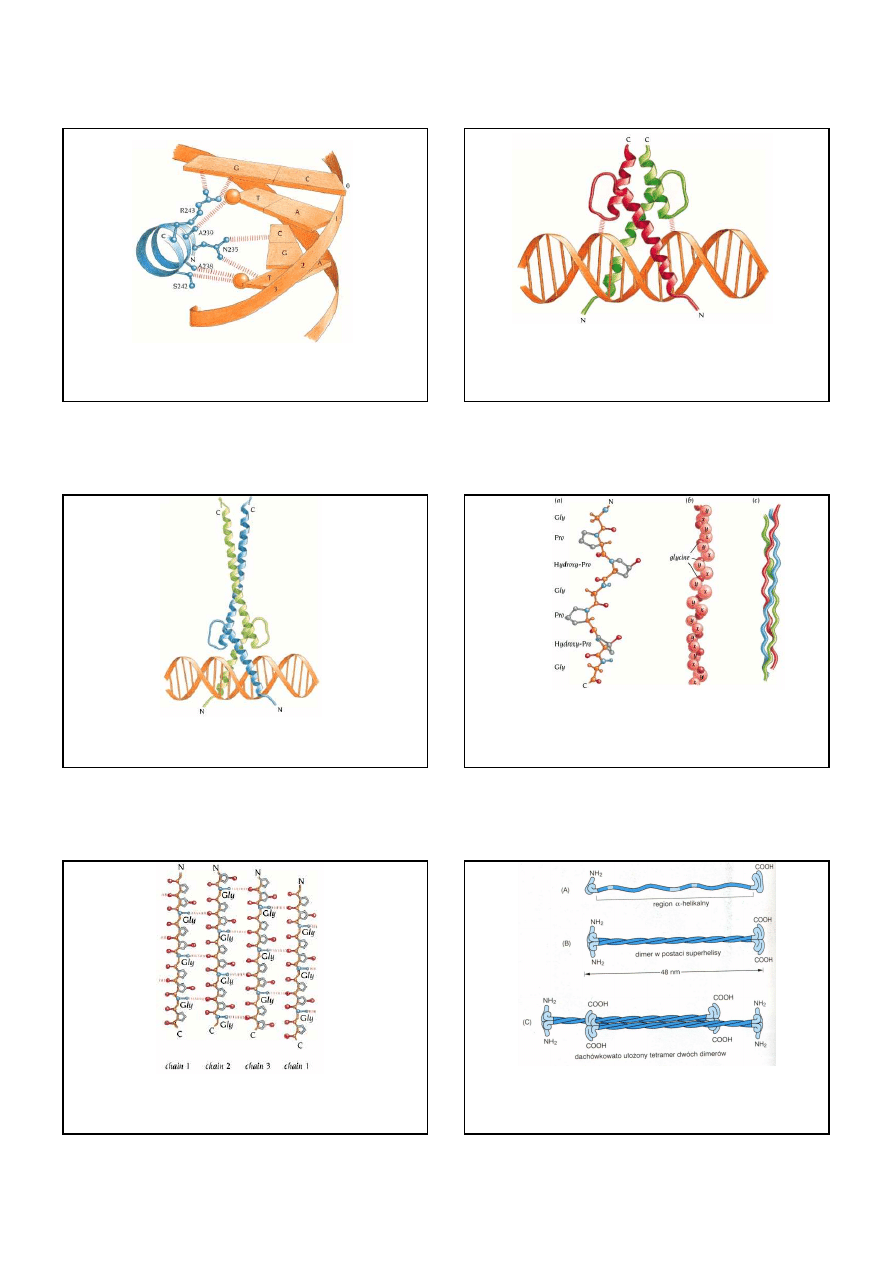
Overall view of the complex between
434 repressor
fragment
and a palindromic synthetic
14mer of DNA. The two binding sites of the repressor dimer to the DNA are identical. The
recognition helices of the repressor are red, and the first helix of the
helix-turn-helix
motif is
blue.
Sequence-specific protein-DNA interactions provide a general recognition signal for
operator
regions in 434 bacteriophage
. (a) In this complex between 434 repressor fragment and a synthetic
DNA there are two glutamine residues (28 and 29) at the beginning of the recognition helix in the
helix-turn-helix motif that provide such interactions with the first three base pairs of the operator
region. The side chain of Gln 28 forms two hydrogen bonds (b) to the edge of the adenine base of
base pair T14'-A1 in the major groove of the DNA.
Schematic diagrams illustrating the complex between DNA (orange) and one monomer of the
homeodomain
. The recognition helix (red) binds in the major groove of DNA and provides the
sequence-specific interactions with bases in the DNA. The N-terminus (green) binds in the minor
groove on the opposite side of the DNA molecule and arginine side chains make nonspecific
interactions with the phosphate groups of the DNA.
10
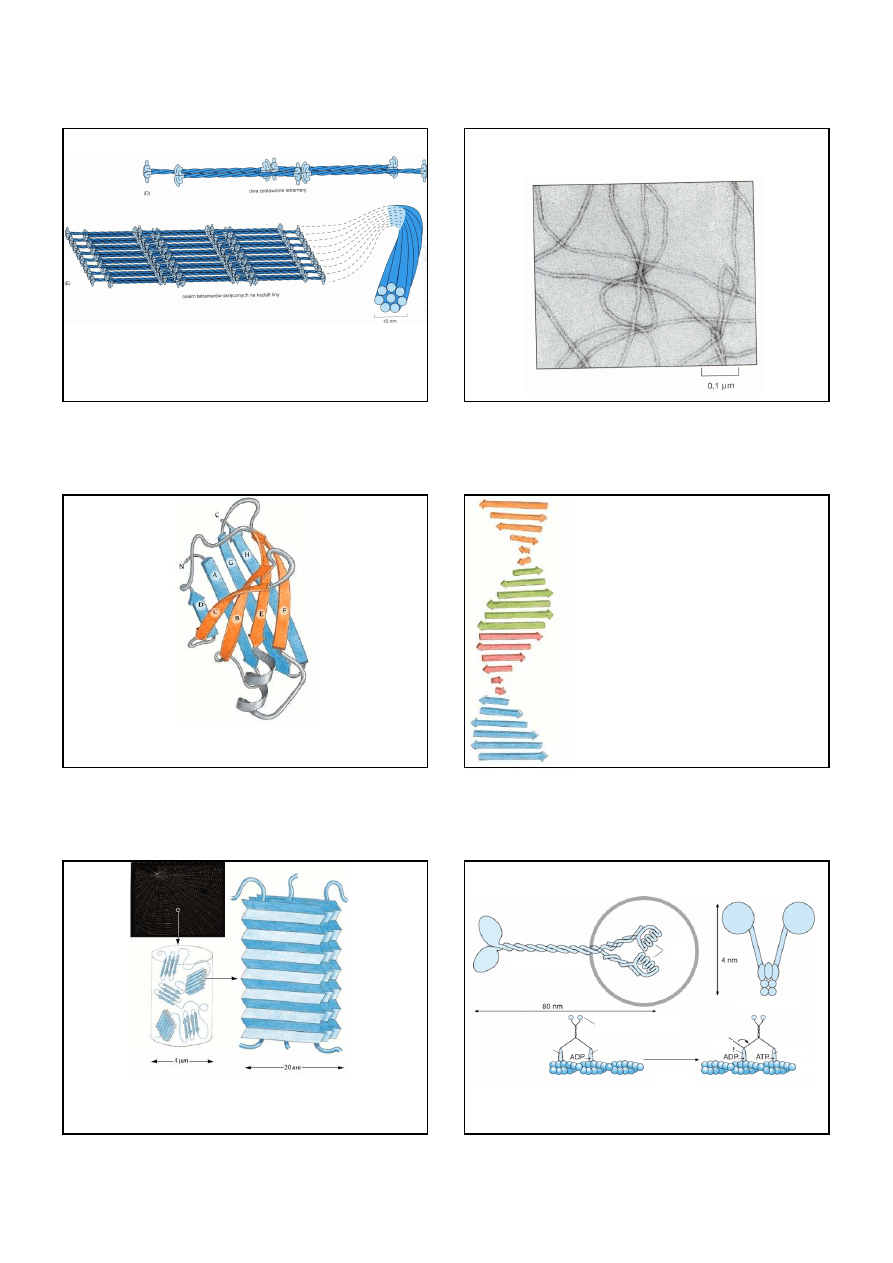
Schematic diagram of the structure of
the heterodimeric
yeast transcription
factor Mat
α
2-Mat
α
1
bound to
DNA. Both Mat
α
2 and Mat
α
1 are
homeodomains
containing the helix-
turn-helix motif. The first helix in this
motif is colored blue and the second,
the recognition helix, is red. (a) The
assumed structure of the Mat
α
1
homeodomain in the absence of DNA,
based on its sequence similarity to
other homeodomains of known
structure. (b) The structure of the Mat
α
2 homeodomain. The C-terminal tail
(dotted) is flexible in the monomer and
has no defined structure. (c) The
structure of the Mat
α
1-Mat
α
2-DNA
complex. The C-terminal domain of
Mat
α
2 (yellow) folds into an
α
helix
(4) in the complex and interacts with
the first two helices of Mat
α
2, to
form a heterodimer that binds to DNA.
Diagram illustrating the sequence-specific interactions between DNA and
p53
. The C-terminal
α
helix and loop L1 of p53 bind in the major groove of the DNA. Arg 280 from the
α
helix and Lys
120 from L1 form important specific interactions with bases of the DNA. In addition, Arg 248
from loop L3 binds to the DNA in the minor groove.
(a)
The
classic zinc finger motif
comprises about 30 amino acid residues, with two cysteine and two
histidine residues which bind to a zinc atom. The linker region between the last cysteine and the first
histidine is 12 residues long and is called the finger region. (b) Schematic diagram of the three-dimensional
structure of a chemically synthesized 25-residue peptide with an amino acid sequence corresponding to one
of the zinc fingers in an embryonic protein, Xfin, from Xenopus laevis. The structure is built up from an
antiparallel
β
hairpin motif (residues 1 to 10) followed by an
α
helix (residues 12 to 24). The four zinc
ligands Cys 3, Cys 6, His 19, and His 23 anchor one end of the helix to one end of the b sheet. Models, quite
similar to the observed structure, were predicted from amino acid sequences of members of this zinc finger
family.
Detailed view of the binding of the second zinc finger of
Zif 268
to DNA. Two side chains,
Arg
46 and His 49
, form sequence-specific interactions with DNA. There are also three nonspecific
interactions between phosphate groups of the DNA and the side chains of Arg 42, Ser 45, and His
53.
Schematic diagrams of the binding of one subunit of
GAL4
to DNA. (a) Shows the structure of the DNA-
binding domain in complex with the DNA; and (b) shows the interactions between amino acid residues and
the DNA. The zinc cluster region binds in the major groove of DNA and is anchored to the sugar-phosphate
backbone by nonsequence-specific interactions (blue). The C-terminus of the first a helix points into the
major groove, and two main-chain C=O groups from residues 17 and 18 (yellow) form hydrogen bonds to the
edge of the bases. There is only one sequence-specific interaction with an amino acid side chain, which is
provided by Lys 18 (red). The linker region is an extended chain that follows one strand of the DNA and
provides several nonspecific contacts (blue) to the DNA. The numbering of the base pairs starts from the
center of the DNA fragment.
The structure of a complex between the DNA-binding domain of
GCN4
and a fragment of DNA.
(a) Each monomer of the GCN4 domain forms a smoothly curved continuous a helix comprising
both the basic and the leucine zipper regions. (b) The monomers are held together in a dimer in
the zipper region. They diverge from each other in the basic regions, which are bound to DNA in
the major groove on opposite sides of the B-DNA fragment (c), like helical forceps gripping the
DNA.
11
Sequence-specific interactions between one of the a-helical basic regions of GCN4 (blue)
and bases in the DNA fragment (orange). The methyl groups of the thymine bases are
shown as spheres.
Schematic diagram of the binding of
MyoD
to DNA. MyoD binds as a dimer (red and green)
with the N-terminal basic regions interacting with the major groove of DNA (orange). The
monomers diverge from each other after the H1 region and bind on opposite sides of DNA, as for
GCN4 (see Figure 10.21). The four-helix bundle, together with contacts with phosphates of the
DNA backbone, rigidify the fork and allow MyoD only to bind to enhancer elements with a
specific spacing between the half-sites. The DNA structure is essentially B-DNA.
Schematic diagram of the binding of the
transcription factor Max
to DNA. The two monomers
of Max (blue and green) form a dimer through both the helix-loop-helix regions which form a
four-helix bundle like MyoD, and the zipper regions, which are arranged in a coiled coil. The N-
terminal basic regions bind to DNA in a way similar to GCN4 and MyoD.
Each polypeptide chain in the
collagen
molecule folds into an extended polyproline type II helix
with a rise per turn along the helix of 9.6 Å comprising 3.3 residues. In the collagen molecule
three such chains are supercoiled about a common axis to form a 3000- Å -long rod-like
molecule. The amino acid sequence contains repeats of
-Gly-X-Y-
where X is often
proline
and
Y is often
hydroxyproline
. (a) Ball and stick model of two turns of one polypeptide chain. (b) A
model of one collagen chain in which each amino acid is represented by a sphere. (c) A small part
of the collagen superhelix in which the three chains have different color.
Bia
ł
ka
fibrylarne
Schematic diagrams of interchain hydrogen bonding (stripes) in the collagen triple helix showing
a cylindrical projection with chain 1 repeated at the right side to provide a clear picture of the
chain 3 to chain 1 hydrogen bonds. The three chains are staggered by one residue and go
clockwise from 1 to 3. (a) Interchain hydrogen bonds in regular collagen triple helix between
proline C=O groups and glycine NH groups.
Budowa filamentu pośredniego.
Monomer bia
ł
ka filamentu pośredniego ukazany w (A) sk
ł
ada się z centralnej pa
ł
eczkowej
domeny z globularnymi regionami na każdym końcu. Pary monomerów
ł
ą
czą się tworząc
dimer (B), a dwa dimery zestawiają się następnie tworząc dachówkowato u
ł
ożony tetramer
(C).
12
Budowa filamentu pośredniego.
Tetramery mogą upakowywać się razem koniec do końca, jak pokazano to w (D),
i tworzyć uk
ł
ad helikalny (ukazany dla u
ł
atwienia w formie sp
ł
aszczonej), który tworzy ostateczny
linopodobny filament pośredni (E).
Budowa filamentu pośredniego
.
Ribbon diagram of one subunit of the globular form of
transthyretin
. The
β
strands are labeled
A to H from the amino end. Strands C and D are thought to be unfolded to produce the
conformation that forms amyloid fibrils. (Val->Met mutation)
Proposed model of
β
sheet helix of the fibrous form of
transthyretin. The repeating unit of the
β
helix
comprises 24
β
strands with an average twist of 15
°
between each strand giving a complete turn of 360
°
.
Four transthyretin polypeptide chains contribute to the
repeat unit and are shown here in different colors.
(Val->Met mutation)
Spider fibers are composite materials formed by large silk fibroin polypeptide chains with
repetitive sequences that form
β
sheets. Some regions of the chains participate in forming 100-nm
crystals, while other regions are part of a less-ordered mesh-work in which the crystals are
embedded. The diagram shows a model of the current concepts of how these fibers are built up,
which probably will be modified and extended as new knowledge is gained.
Molekularne silniki: kinezyna, dyneina, miozyna
kinezyna
dyneina
miozyna
lekkie
ł
ańcuchy
aktyna
13
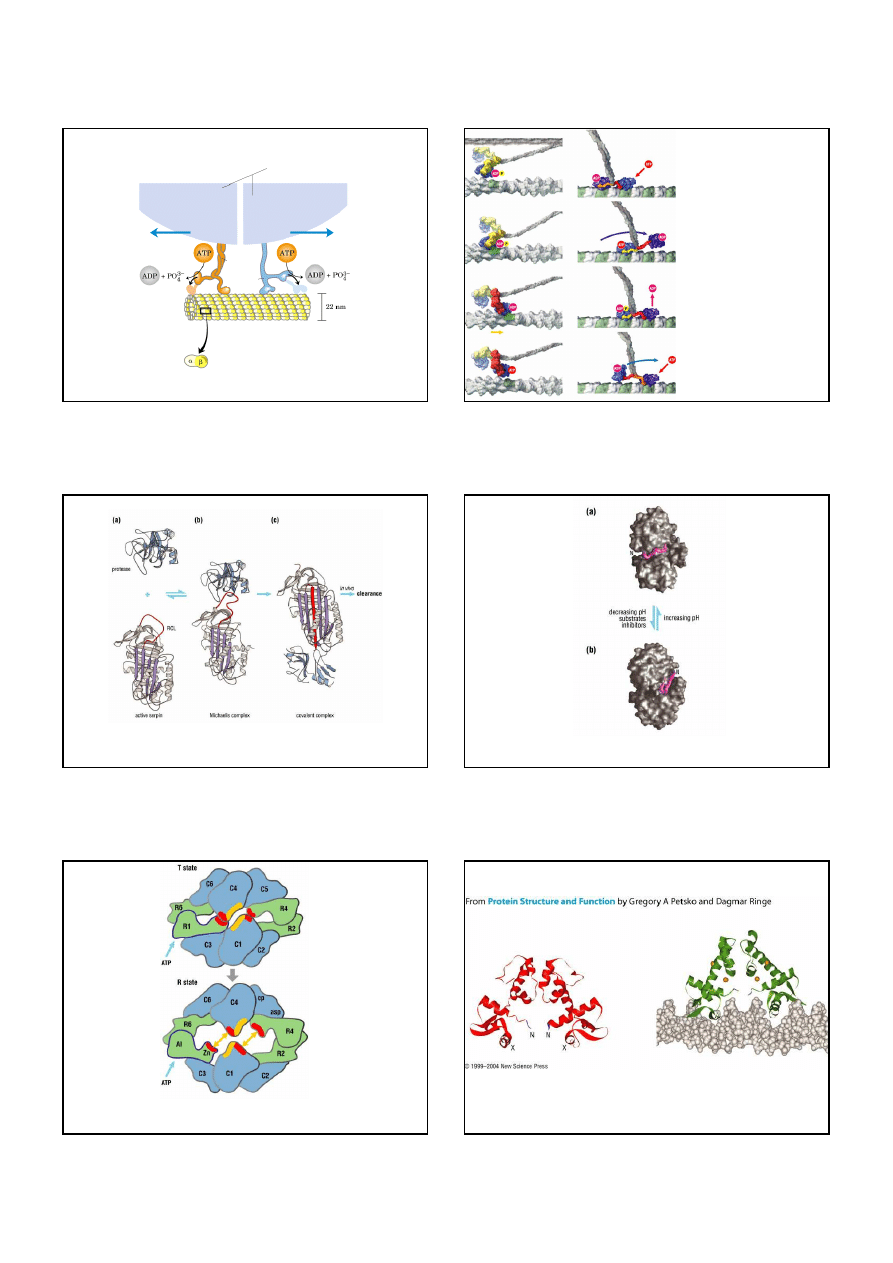
Kinezyna i dyneina: silniki napędzane ATP, które przyczepiają się do organelli
i ciagną je wzd
ł
uż mikrotubularnych „szyn”
organellum albo pęcherzyk
kinezyna
dyneina
mikrotubule
dimer tubuliny
Models for the motor
actions of muscle myosin
and kinesin
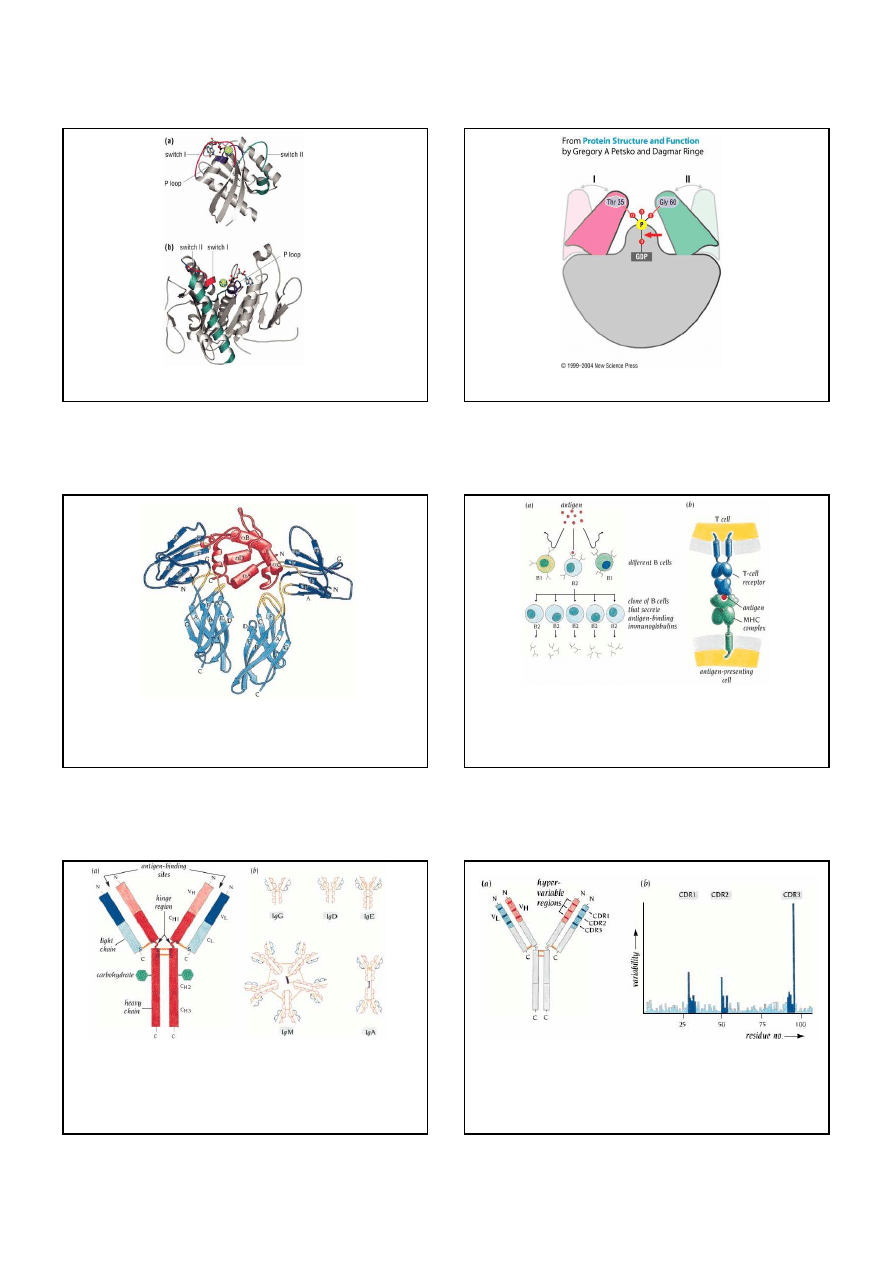
Structural transformation in a serine protease inhibitor on binding protease
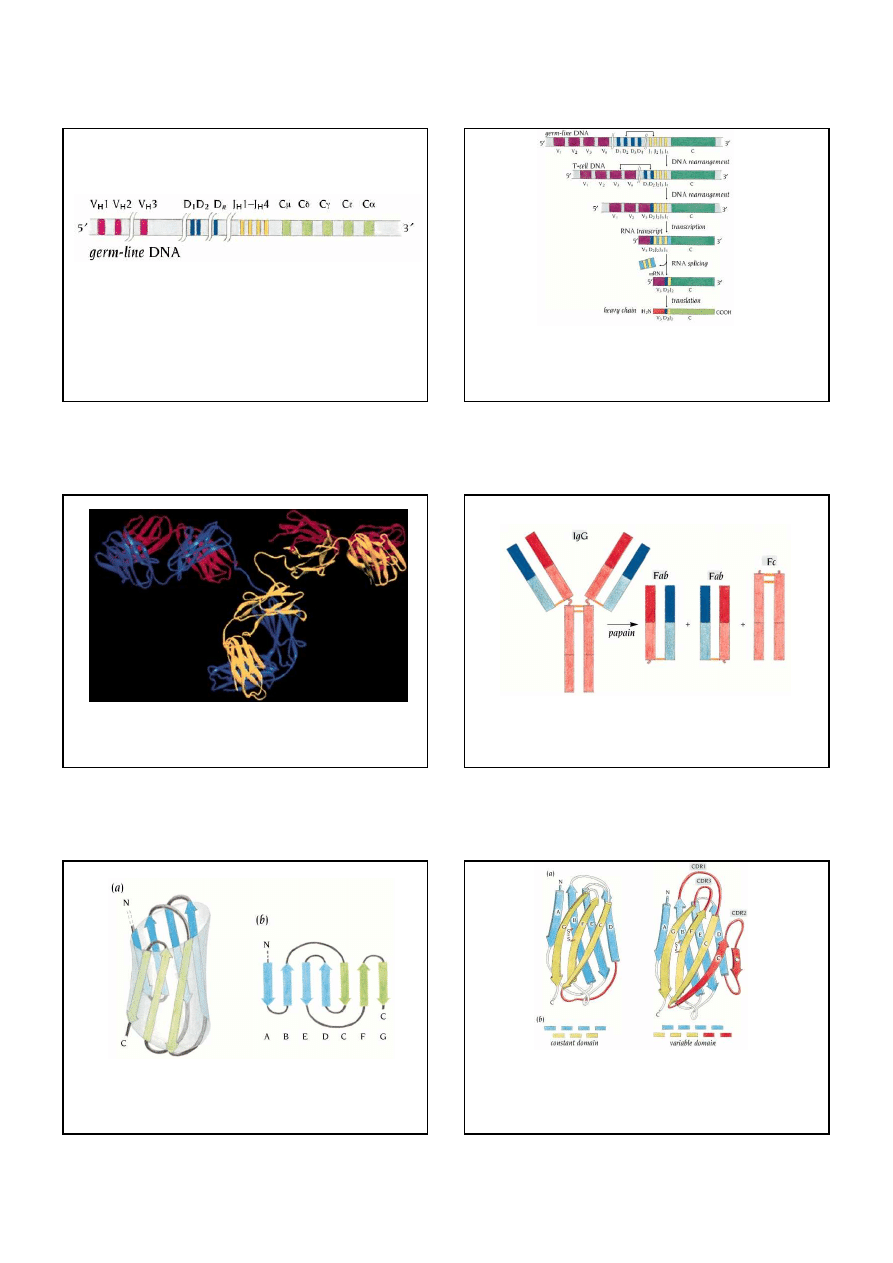
Cathepsin D conformational switching
Ligand-induced conformational change
activates aspartate transcarbamoylase
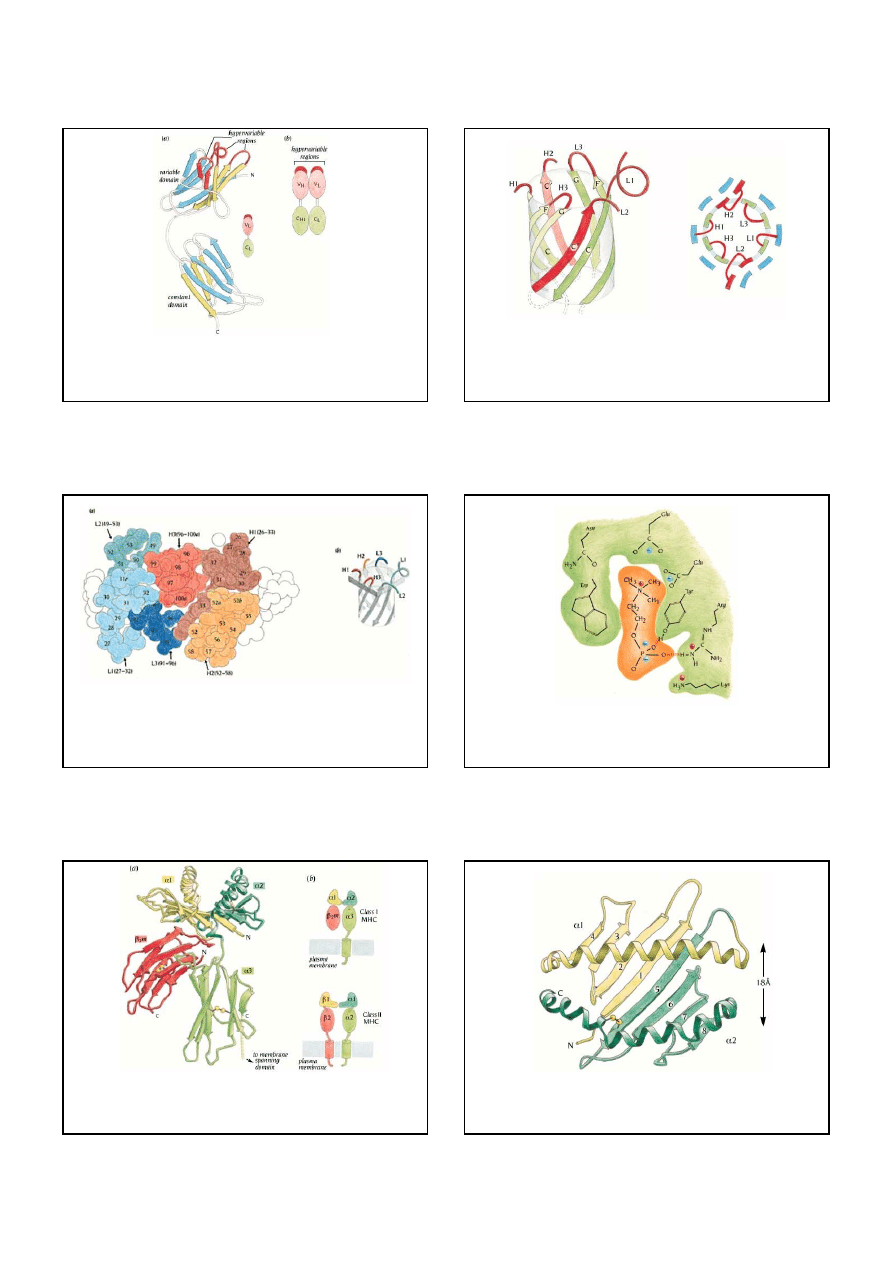
Iron binding regulates the repressor of the diphtheria toxin gene
14
Structure of the core domains of a typical GTPase and an ATPase
Schematic diagram of the universal switch mechanism of GTPases
Ribbon diagram of the structure of a 1:2 complex between the human growth hormone and the
extracellular domains of two receptor molecules. The two receptor molecules (blue) bind the
hormone (red) with essentially the same loop regions (yellow). In contrast, the hormone molecule
uses totally different surface regions to bind the two receptor molecules.
(a) The clonal selection theory. An antigen (red) activates those B cells that have
immunoglobulin molecules on their surfaces that can recognize and bind the antigen. This
binding triggers production of a clone of identical B cells that secrete soluble antigen-binding
immunoglobulins into the bloodstream. (b) T cells recognize foreign viral antigens (red), through
a T-cell receptor (blue) that can bind degraded fragments of the antigen when they are associated
with an MHC molecule (green). The polypeptide chains of both T-cell receptors and MHC
molecules are folded into immunoglobulin-like domains, represented as ellipsoids in the diagram.
(a) The immunoglobulin molecule, IgG, is built up from two copies each of two different polypeptide chains,
heavy (H) and light (L). The L chain folds into two domains: VL with variable sequence between different
IgG molecules and CL with constant sequence. The H chain folds into four domains: one variable VH and
three constant domains, CH1, CH2, and CH3. Disulfide bridges connect the four chains. The antigen-binding
sites are at the ends of the variable domains. (b) Schematic polypeptide chain structure of different
immunoglobulin molecules. IgM is a pentamer where the heavy chains have one variable domain and four
constant domains. An additional polypeptide chain, the J chain, (black bar) is associated with the pentameric
molecule. The J chain also links two units to form the dimeric IgA. IgG, IgD, and IgE are monomeric
immunoglobulin molecules.
Certain regions within the 110 amino acid variable domains show a high degree of sequence
variation. These regions determine the antigen specificity and are called hypervariable regions or
complementarity determining regions, CDR (a). There are three such regions, CDR1-CDR3, in
each variable domain. The sequences of a large number of variable domains in L chains have
been compared, and the sequence variability is plotted as a function of residue number along the
polypeptide chain in (b). The three large peaks in this diagram correspond to the three
hypervariable regions in (a): CDR1-CDR3.
15
Variable domains in immunoglobulins (and T-cell receptors) are made by combinatorial joining
of gene segments. Three such segments, V, D, and J, are joined to make the variable domain of a
heavy chain. In the mouse the gene-segment pool for an H chain contains about
1000 V
segments,
12 D
segments,
4 J
segments, and a cluster of C segments, each encoding a different
class of H chain.
The V-D-J joining process involved in making a heavy chain in the mouse. In the germ-line DNA the cluster
of about 4 J gene segments and about 10 D segments are separated from the C gene segment by a short intron
and from the about 1000 V gene segments by long regions of DNA. During B cell development the chosen V
gene segment (V3) is moved to lie precisely next to the chosen D and J segments (D2 and J2). The "extra" J
genes (J3 and J4) and the intron sequence are transcribed along with the V3, D2, J2, and C segments and then
removed by RNA splicing to generate mRNA molecules.
90.000 heavy chains
×
300 light chains = 270.000.000 different antibody molecules
The three-dimensional structure of an intact IgG. Hinge regions connecting the Fab arms with the
Fc stem are relatively flexible, despite the presence of disulfide bonds in this region linking the
heavy and light chains. Carbohydrate residues that bridge the two CH2 domains are not shown.
Enzymatic cleavage of immunoglobulin IgG. The enzyme papain splits the
molecule in the hinge region, yielding two Fab fragments and one Fc fragment.
The constant domains of immunoglobulins are folded into a compressed antiparallel
β
barrel built up from one three-stranded
β
sheet packed against a four-stranded sheet (a).
A topological diagram (b) shows the connected Greek key motifs of this fold.
(a) Comparison of the structures of the constant and variable domains of immunoglobulins. Beta
strands labeled A-G have the same topology and similar structures. There are two extra
β
strands,
C' and C'' (red) in the variable domain. The loop between these strands contains the hypervariable
region CDR2. The remaining CDR regions are at the same end of the barrel in the loops
connecting
β
strands B and C and strands F and G. A disulfide bond bridges strand B in one sheet
with strand F in the other sheet in both the constant and the variable domains. (b) The
β
strands
viewed end on, illustrating that one
β
sheet has the same four
β
strands in the two domains.
16
(a) The variable and constant domains in the light chain of immunoglobulins are folded into two
separate globular units. In both domains the four-stranded b sheet is blue and the other sheet is
yellow. The hypervariable CDR regions are at one end of this elongated molecule. (b) In the Fab
fragment, as well as in the intact immunoglobulin molecule, the domains associate pairwise so
that VH interacts with VL and CH1 with CL. By this interaction the CDR regions of both variable
domains are brought close to each other and together form the antigen-binding site.
Schematic diagram of the barrel arrangement of four
β
strands from each of the variable domains
in Fab. The six hypervariable regions, CDR1-CDR3 from the light chain (L1-L3) and from the
heavy chain (H1-H3), are at one end of this barrel.
(a) Drawing of a space-filling model of the hypervariable regions of an Fab fragment. The
superpositions of five sections are shown, cut through a model as shown in (b). It is clearly seen
that all six hypervariable regions (L1-L3, H1-H3) contribute to the surface shown here.
Schematic representation of the specific interactions between phosphorylcholine (orange) and
the protein side groups (green) in Fab. The binding cavity is in a cleft between the light and the
heavy chains. Choline binds in the interior while the phosphate group is toward the surface.
(a) Schematic representation of the path of the polypeptide chain in the structure of the class I MHC
protein HLA-A2. Disulfide bonds are indicated as two connected spheres. The molecule is shown with
the membrane proximal immunoglobulin-like domains (
α
3 and
β
2m) at the bottom and the
polymorphic
α
1 and
α
2 domains at the top. (b) The domain arrangement in class I and class II MHC
proteins. The domain structures of the MHC class II molecule are similar to those of the class I
molecule shown in (a).
Schematic representation of the peptide-binding domain of a class I MHC protein. The
α
1
(yellow) and
α
2 (green) domains are viewed from the top of the molecule, showing the empty
antigen-binding site as well as the surface that is contacted by a T-cell receptor.
17
Peptide binding by MHC class I and class II molecules. (a) A cross-section of a peptide antigen
(green) bound to pockets in the class I molecule (orange). (b) Hydrogen bonds (red) form
between the ends of the bound peptide and conserved residues of the class I molecule (orange).
(c) Class II molecules bind longer peptides than class I molecules, with the ends of the peptide
extending beyond the peptide-binding site. (d) Hydrogen bonds between bound peptide and the
class II molecule occur along the length of the binding site, also in contrast to the case with class
I complexes.
Interactions between the class I MHC-peptide complex with the T-
cell receptor. (a) The T-cell receptor (top) binds to the MHC-
peptide complex with its hypervariable CDR loops effectively
burying the eight-residue foreign peptide (yellow, with the N- and
C-terminal residues labeled P1 and P8, respectively). The TCR a
subunit loops 1-3 are colored light purple (CDR1a), dark purple
(CDR2a), and yellow (CDR3a); the b chain loops 1-3 are colored
light blue (CDR2b), dark blue (CDR3b), and green (CDR3b). The b
subunit hypervariable loop that has no counterpart in
immunoglobulins, HV4, is shown in red. (b) A finger-print of how
the TCR hypervariable loops contact the MHC-peptide complex, as
seen looking down onto the MHC surface as oriented in (a). The
TCR sits diagonally across the peptide-binding site, contacting both
the MHC molecule (brown and green space-filling model) and its
bound peptide (pale green space-filling model).
The molten globule state is an important intermediate in the folding pathway when a polypeptide
chain converts from an unfolded to a folded state. The molten globule has most of the secondary
structure of the native state but it is less compact and the proper packing interactions in the
interior of the protein have not been formed.
18
Folding intermediates
Highly simplified schematic representation of
the folding of a polypeptide chain in water
The unfolded state is an ensemble of a large number of conformationally different molecules,
U1...Un, which undergo rapid interconversions. The molten globule is an ensemble of structurally
related molecules, M1...Mm, which are rapidly interconverting and which slowly change to a
single unique conformation, the folded state F. During the folding process the protein proceeds
from a high energy unfolded state to a low energy native state. The conversion from the molten
globule state to the folded state is slow and passes through a high energy transition state, T.
The energy surface of a folding funnel from
experimental data for the folding of lysozyme.
The axes are defined as follows: E represents the
energy of the system, Q is defined as the
proportion of native contacts formed, and P is a
measure of the available conformational space.
Three pathways are shown corresponding to
(yellow) fast folding, (green) slow folding
pathway that crosses the high energy barrier, and
(red) slow folding pathway which returns to a
less folded state before following the pathway for
fast folding
(a) Schematic diagram of the structure of the small protein bovine pancreatic trypsin inhibitor,
BPTI. The three disulfide bonds are green,
β
strands are blue and
α
helices are red.
(b) The folding pathway of BPTI according to Creighton. The unfolded protein has six cysteine
residues in their reduced state. The major single disulfide bond intermediate has a disulfide bond
between residues 30 and 51. This intermediate forms double disulfide bond intermediates which
contain non-native disulfide bonds. According to Creighton these intermediates are essential for
the formation of the native double disulfide bond intermediate 30-51, 5-55 which rapidly forms
the third native disulfide bond 14-38.
19
Bia
ł
ka
200-300 mg/ml
P
ł
ytki krwi
350 mg/ml
RNA
75-150 mg/ml
hemoglobiny
=
300-400 mg/ml
krew 80 mg/ml
20-30% objętości komórki stanowią makrocząsteczki
Agregacja nienatywnych
ł
ańcuchów bia
ł
kowych towarzyszy
zwijaniu in vivo
Stężenie bia
ł
ek w komórce =
300-400mg/ml
Modele fa
ł
dowania z udzia
ł
em bia
ł
ek opiekuńczych
TF - trigger factor, PFD - prefoldin, NAC - nascent chain-associated complex
Prefoldyna
•
prefoldyna (kompleks Gim, ok.90kD) wiąże i uwalnia substrat niezależnie od ATP
•
rozpoznanie zachodzi dzięki hydrofobowym resztom na końcach helis
•
rola PFD to stabilizowanie nienatywnych bia
ł
ek do czasu przekazania ich na
GroEL/GroES
•
PFD odgrywa ważną rolę w fa
ł
dowaniu aktyny i tubuliny
Chaperoniny
• duże kompleksy (ok.800kD) w formie podwójnego pierścienia z
wg
ł
ę
bieniem pośrodku – GroEL/GroES oraz TRiC
• nienatywne bia
ł
ko jest wychwytywane przez hydrofobowe reszty
domen apikalnych i umieszczane wewnątrz zag
ł
ę
bienia, tam zwija
się, a następnie jest wyrzucane na zewnątrz
• proces jest ATP-zależny i może powtarzać się aż do uzyskania
struktury natywnej
20
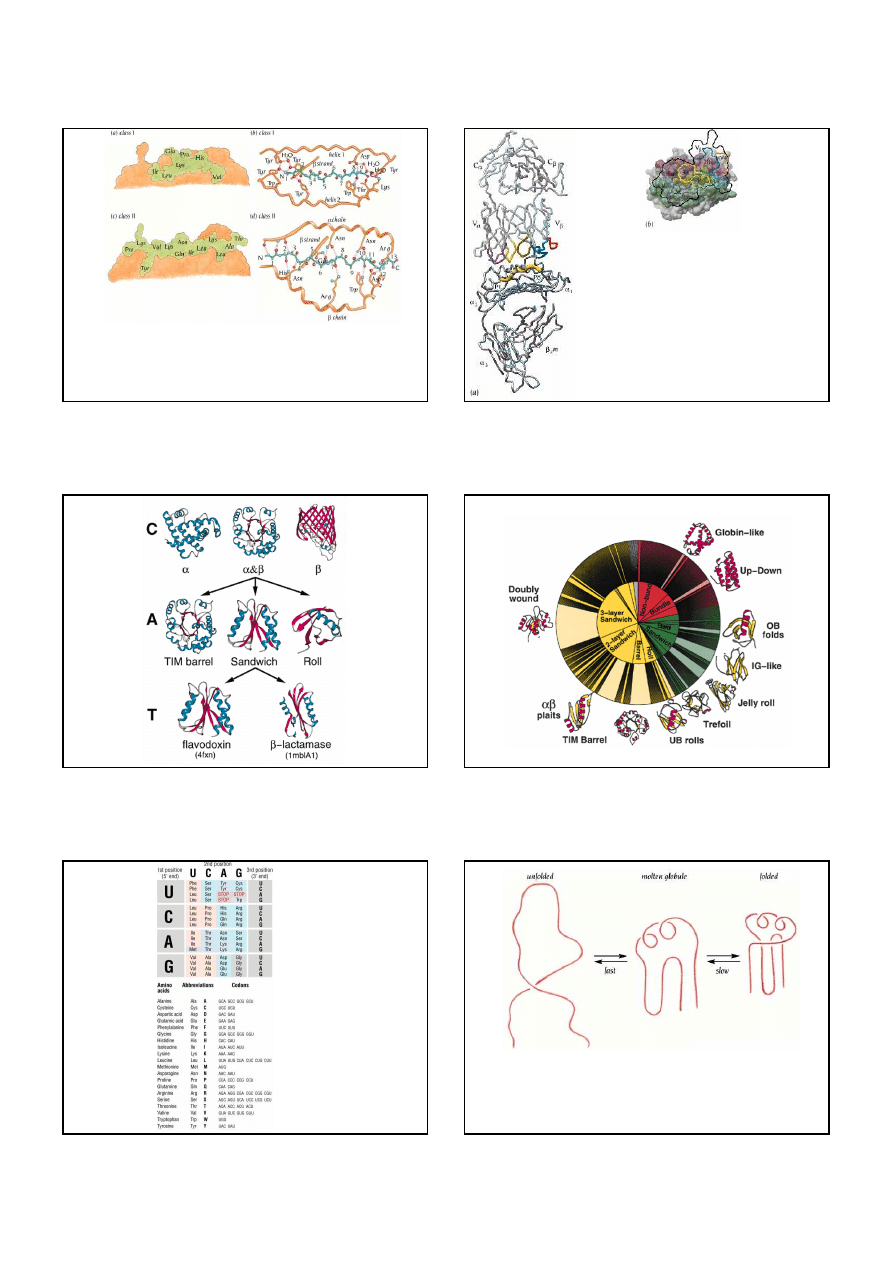
Possible functional cycle of the
GroEL-GroES molecule. (a) An
unfolded protein molecule (yellow)
binds to one end of the GroEL-ADP
complex (red) with bound GroES
(green) at the other end. (b and c)
GroES is released from the trans-
position and rebound together with
ATP at the cis-position (light red) of
GroEL. (d) ATP hydrolysis occurs
as the protein is folding or unfolding
inside the central cavity. (e) ATP
binding and hydrolysis in the trans-
position is required for release of
GroES and the protein molecule. (f)
A new unfolded protein molecule
can now bind to GroEL.
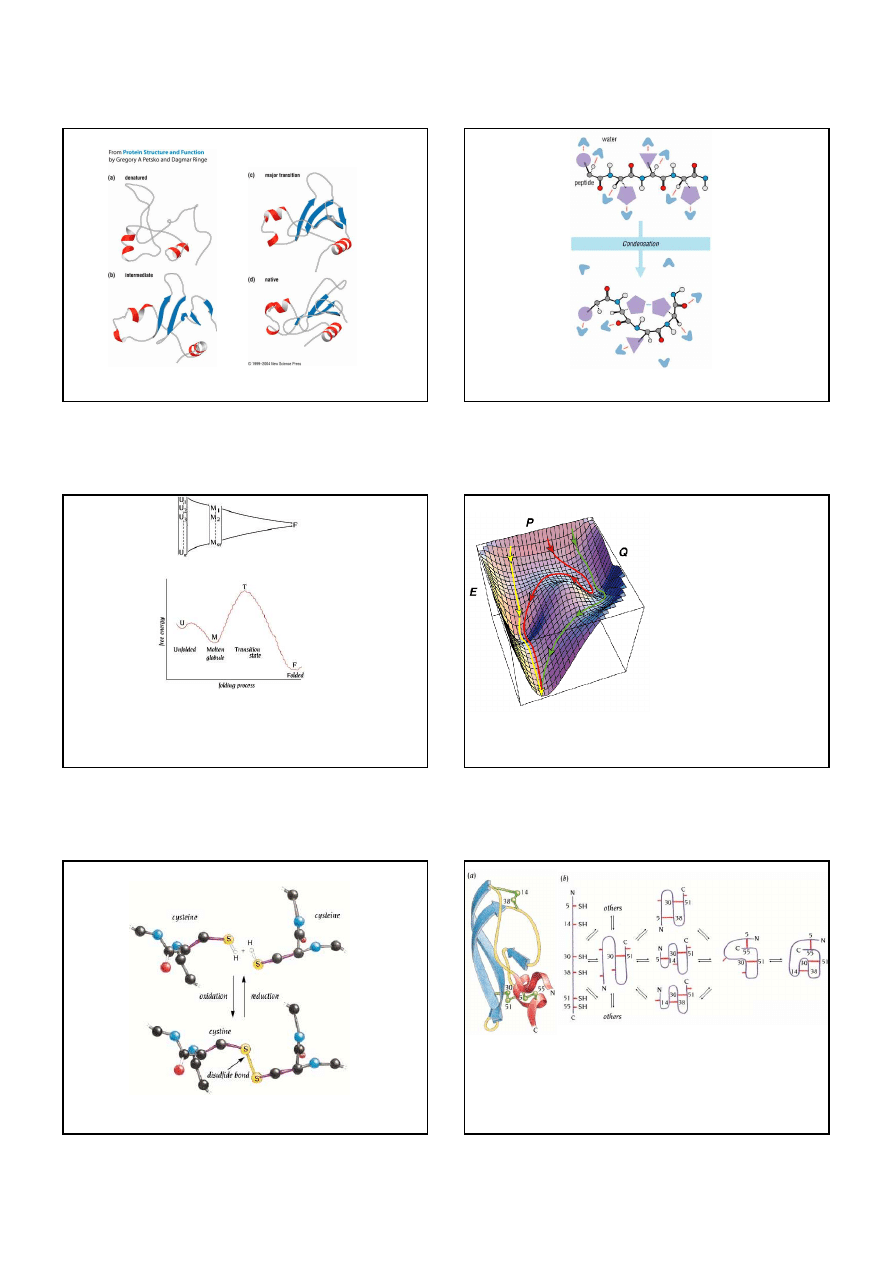
Schematic diagram of the chaperonin GroEL molecule as a cylinder with 14 subunits
arranged in two rings of 7 subunits each. The space occupied by one subunit is red
and the hole inside the cylinder is blue.
Models of the GroEL molecule in two different functional states based on three-dimensional
reconstruction from electron microscopy pictures. A large conformational change of GroEL
occurs when GroES and ATP are bound. The GroES molecule binds to one of the GroEL rings
and closes off the central cavity. The GroEL ring becomes larger and the cavity inside that part of
the cylinder becomes wider
.
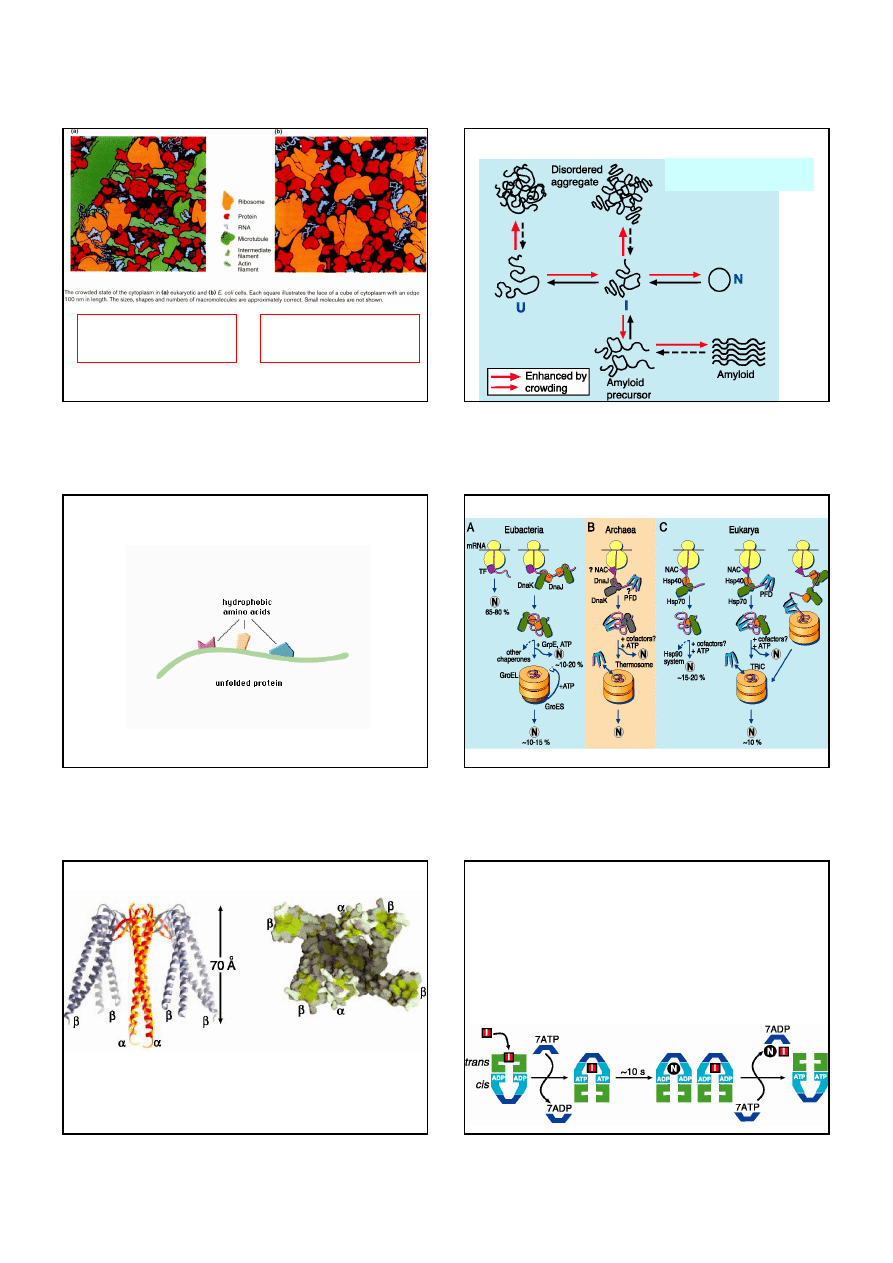
(a)
Schematic diagram of one subunit of
GroEL
. The polypeptide chain is folded into three
domains. The equatorial domain (green) is the largest domain, comprising 10
α
helices, and is built up from
both the N-terminal and the C-terminal regions. The apical domain (blue), which is a
β
sandwich flanked by
α
helices, is formed by the middle region of the polypeptide chain. The two linker regions between the
equatorial and the apical domains form a small intermediate domain (purple) comprising three a helices. (b)
Schematic diagram illustrating the domain arrangement of four subunits in the GroEL molecule, two in each
of the seven membered rings. The equatorial domains form the middle part of the molecule and interact with
each other both within each ring and between the rings. The apical domains are at the top and the bottom of
the cylinder and form an opening to the interior of the molecule. The small intermediate domains form the
thinnest part of the cylinder wall in the middle of each ring.
(a) Schematic diagram of the
GroES
molecule. Seven subunits are linked together in a ring with
the same symmetry arrangement as in one of the rings of the GroEL molecule. Two loop regions
extend from the core of the subunits (green), one of which (yellow) is flexible and located on the
outside of the ring. This loop is hydrophobic and interacts with the GroEL molecule in the
GroEL-GroES complex. The other loop (red) covers the central cavity of GroEL when GroES is
bound. (b) Schematic diagram of the structure of one subunit of GroES. The core of the subunit
structure is a
β
barrel (green) comprising two antiparallel
β
sheets packed against each other. The
mobile loop (yellow) is flexible and the roof b hairpin loop covers the central part of the
sevenmembered ring of the GroES molecule.
21
Molecular model of an amyloid fibril
derived from cryo-EM analysis of fibrils
grown from an SH3 domain.
The fibril consists of four “protofilaments” that twist around
one another to form a hollow tube with a diameter of
approximately 60 Å . The model shown here represents
one way in which regions of the polypeptide chain
involved in
β
-sheet structure could be assembled within
the fibrils.
Ubytki w tkance mózgowej (bia
ł
e plamki) pacjenta chorego na CJD
Nazwa choroby ( skrót od nazwy angielskiej )
Naturalny gospodarz
Kuru
Choroba Creutzfeldta Jakoba ( CJD )
Syndrom Gerstmanna-Sträusslera-Scheinkera ( GSS )
Ś
miertelna rodzinna bezsenność ( FFI )
Człowiek
Scrapie
Owce, kozy
Encefalopatia gąbczasta bydła ( BSE )
Bydło
Encefalopatia gąbczasta kotów ( FSE )
Koty
Pasażowalna encefalopatia norek ( TME )
Norki
Przewlekła choroba wyniszczająca ( CWD )
Jelenie, łosie, muły
22
Sickle-cell hemoglobin
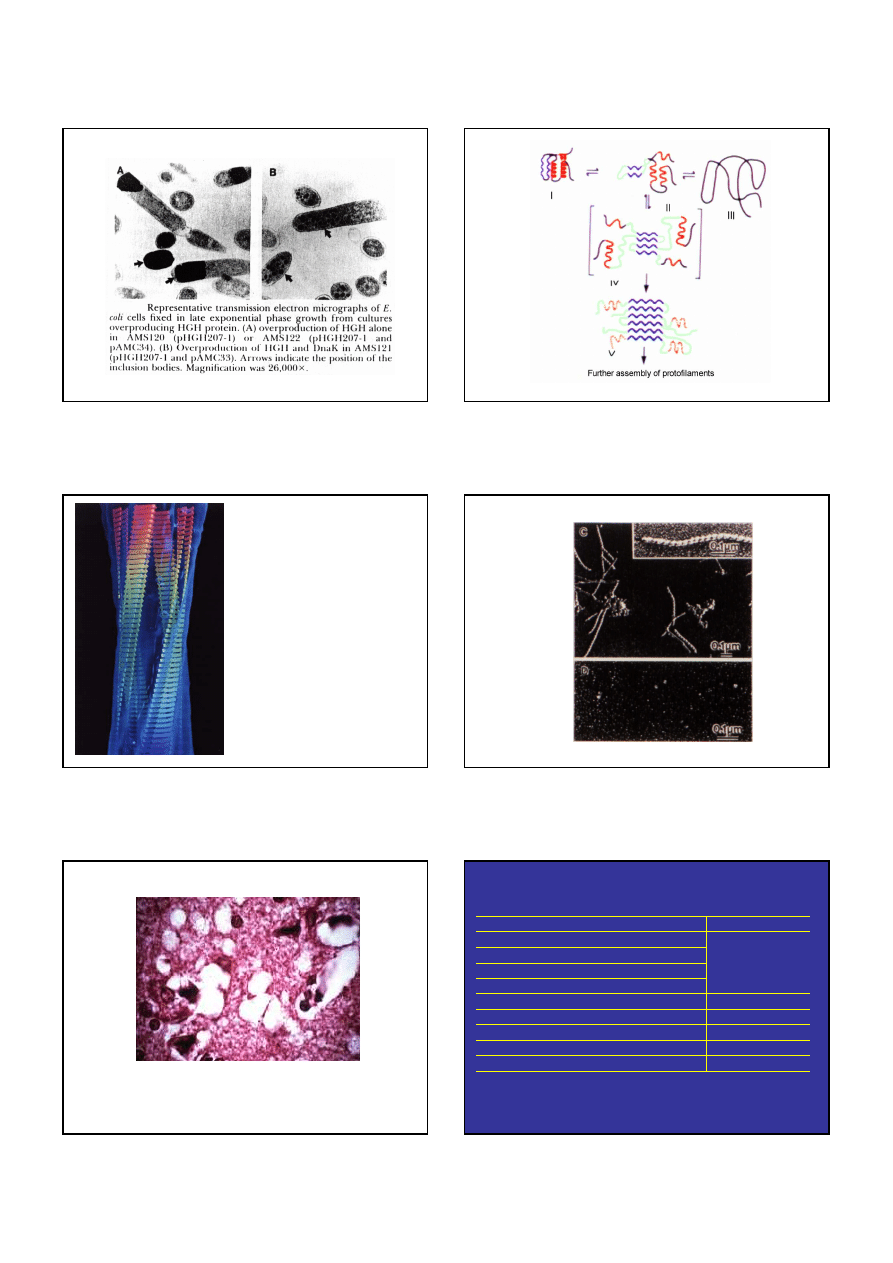
Widma CD "czystych" drugorzędowych struktur.
DICHROIZM KO
Ł
OWY
23
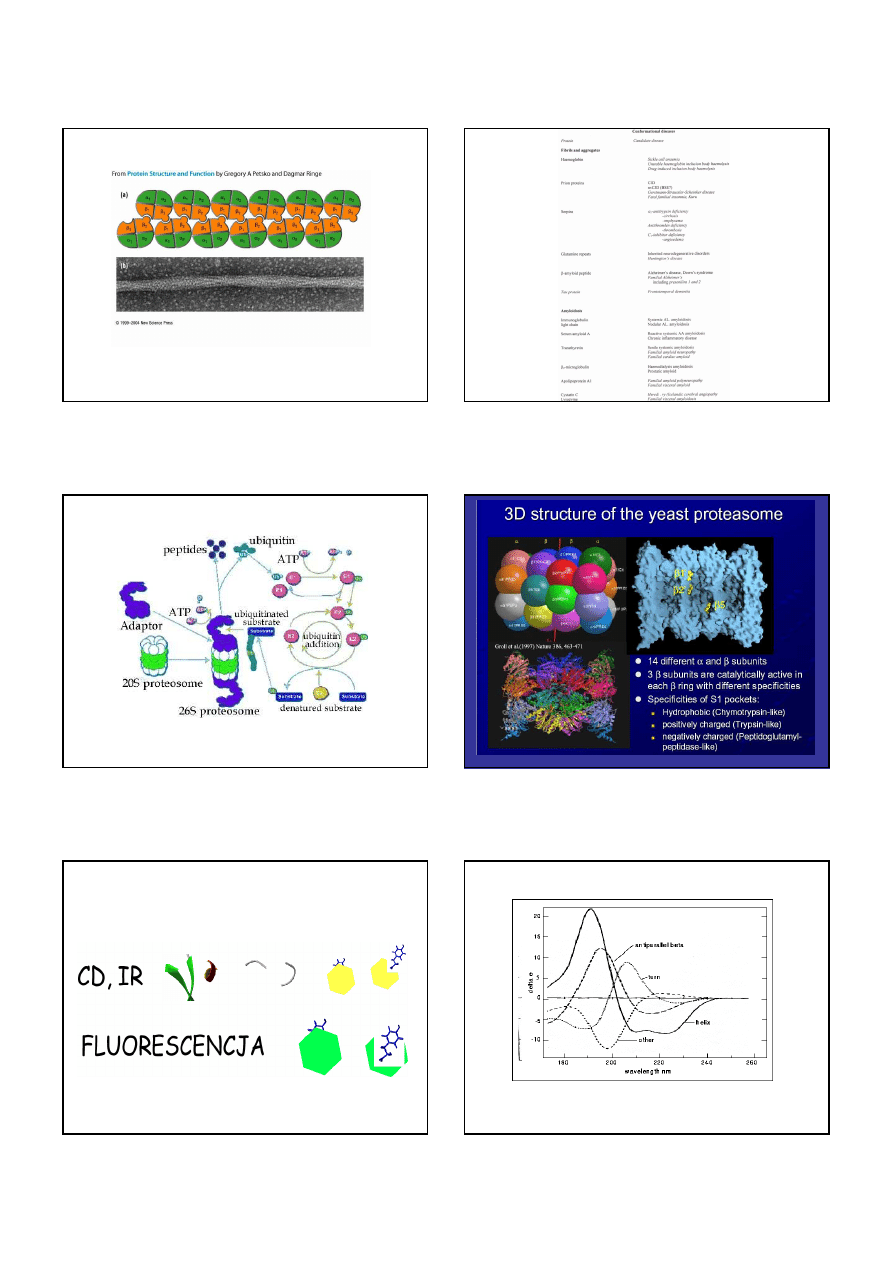
Przyk
ł
adowe widma dichroizmu ko
ł
owego bia
ł
ek
DICHROIZM KO
Ł
OWY
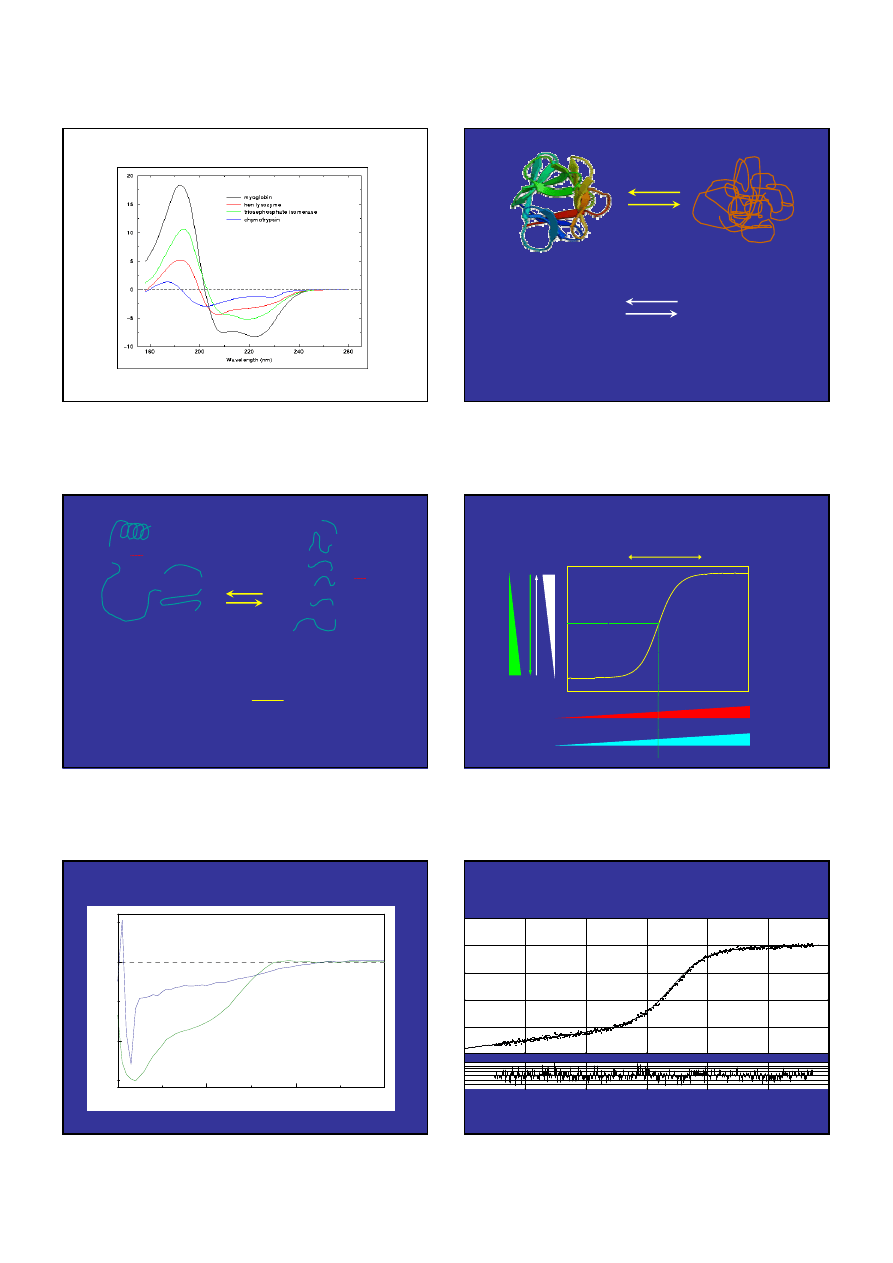
D
N
∆
G
den
= G
D
- G
N
C=O
H
2
O
CH
3
C=O
-
H-N
CH
3
H
3
C
CH
3
CH
3
H
2
O
H
3
C
C=O
H
2
O
H
3
C
CH
3
N
D
∆
G
den
= - R
⋅
T
⋅
lnK
den
K
den
=
[D]
[N]
H
2
O
H
2
O
H
2
O
H
2
O
H
2
O
H
2
O
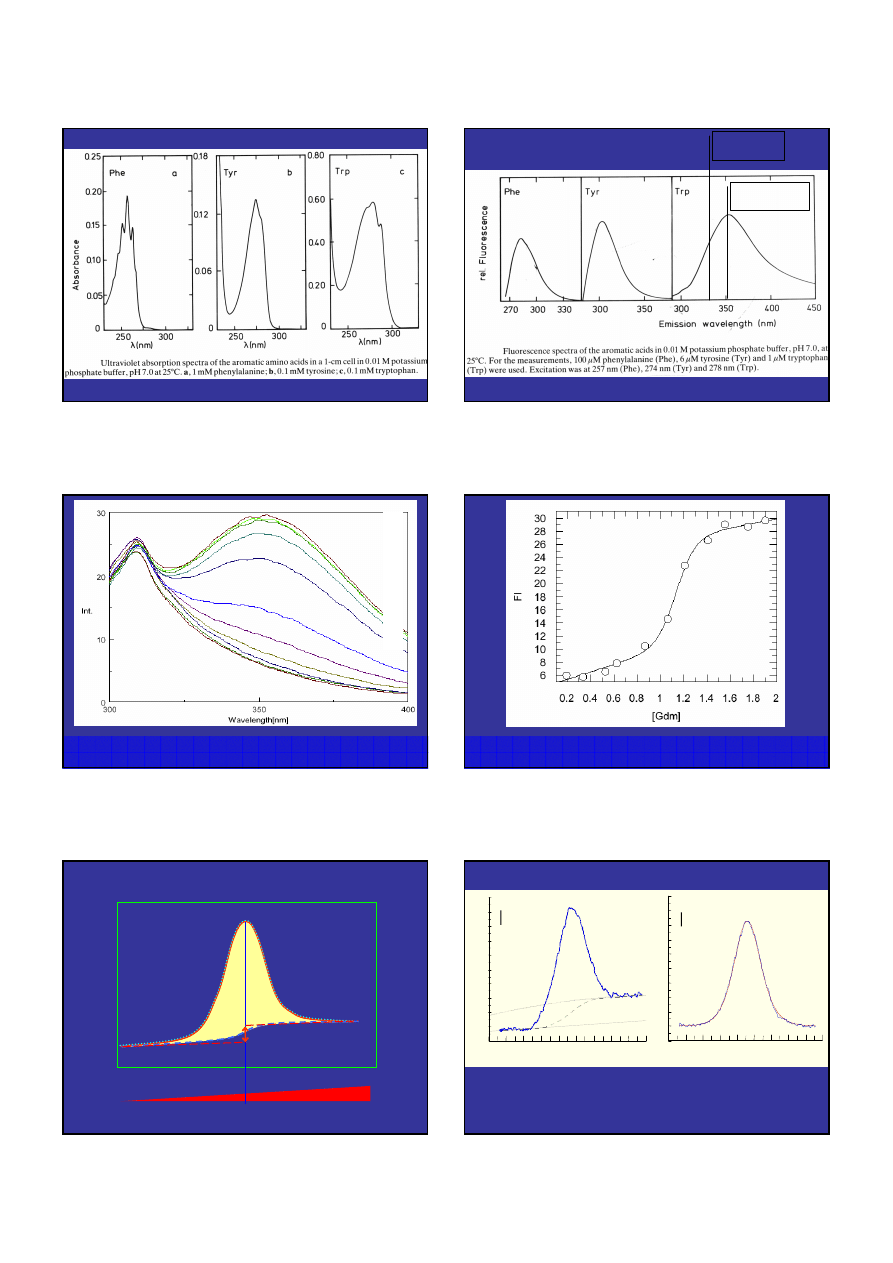
0.1<K
den
<10
100 N
0
0
D 100
T
den
(T
m
) temperature
denaturant ½
[denaturant]
Sketch of protein unfoldig transition
-80
30
-50
0
200
260
220
240
CD
Wavelength[nm]
Zmiana sygnału CD bia
ł
ka DCX 45-150
95
o
C
21
o
C
60
80
-30
-25
-20
-15
-30
-25
-20
-15
60
80
-0.5
-0.25
0
0.25
0.5
-0.5
-0.25
0
0.25
0.5
Krzywa denaturacji DCX24-150, 25mM fosforan pH 6.0
∆
H = 83.9 kcal/mol, Tm = 74.57
o
C.
24
330-332 -
rdzeń bia
ł
ka
350- 353
eksponowany
Fluoresecencja aFGF w funkcji stężenia GdmHCl, wzbudzenie 280nm.
25mM fosforan pH 7.3.
1.9
1.7
1.5
1.4
1.2
1
0.8
0.6
0.5
0.3
0.2
Fluoresecencja aFGF w funkcji stężenia GdmHCl, wzbudzenie 280nm,
emisja 352nm. 25mM fosforan pH 7.3.
∆∆∆∆
H
cal
temperature (
o
C)
H
ea
t
ca
p
a
ci
ty
(
C
p
ca
l/
m
o
l
K
)
Schematic representation of typical calorimetric scan
T
den
∆∆∆∆
H
vH
∆∆∆∆
C
p
Differential scanning calorimetry endotherm of aFGF
Experimental condition: 20mM ADA pH 7.3, 0.7M GdmHCl, heating rate = 0.25
o
C/min, protein concentration =
0.6mg/ml. The best approximation using a two-state model is depicted by a red line
Results: T
m
= 42.5(
o
C),
∆
C
p
= 1.7 kcal/molK,
∆
H
cal
= 72.7 (kcal/mol),
∆
H
vH
= 76.6 (kcal/mol)
1 kcal/K mol
∆
C
p
(k
c
a
l
/K
m
o
l)
Temperature (
o
C)
∆
C
p
(k
c
a
l
/K
m
o
l)
Temperature (
o
C)
1 kcal/K mol
20 30 40 50 60 65
20 30 40 50 60 65
9
8
7
6
5
4
3
2
1
0
9
8
7
6
5
4
3
2
1
0
25
H21Y aFGF variant
Amino-acid composition - homology search
Position amino-acid (% occurrences)
His Phe
Tyr
Try
21
10
52 29 9
Stability of H21Y aFGF variant
GdmHCl and thermal induced unfolding were performed in 25mM phosphate pH 7.3 (0.7M GdmHCl), protein conc.: WT = 25
µ
g/ml
(80
µ
g/ml), H21Y = 20
µ
g/ml (75
µ
g/ml), scan rate 0.25
o
C/min. The transitions were monitored by the increase of fluorescence at
353nm on excitation at 280nm
F
ra
ct
io
n
u
n
fo
ld
ed
GdmHCl (M)
Temperature (
o
C)
Mutant
DG Gdm½
m
T
m
DH
(kcal/mol) (M) (kcal/molM) (
o
C) (kcal/mol)
WT
5.53
1.13
4.87
40.5
68.9
H21Y
6.54
1.36
4.81 44.5
68.4
2
1.5
1
0.5
0
1
0.8
0.6
0.4
0.2
0
60
40
20
1
0.8
0.6
0.4
0.2
0
Od kryształu do struktury
26
Sir
Lawrence
Bragg,
around
1965.
Left: Max Perutz with his model of
haemoglobin and John Kendrew with
his model of myoglobin in 1962.
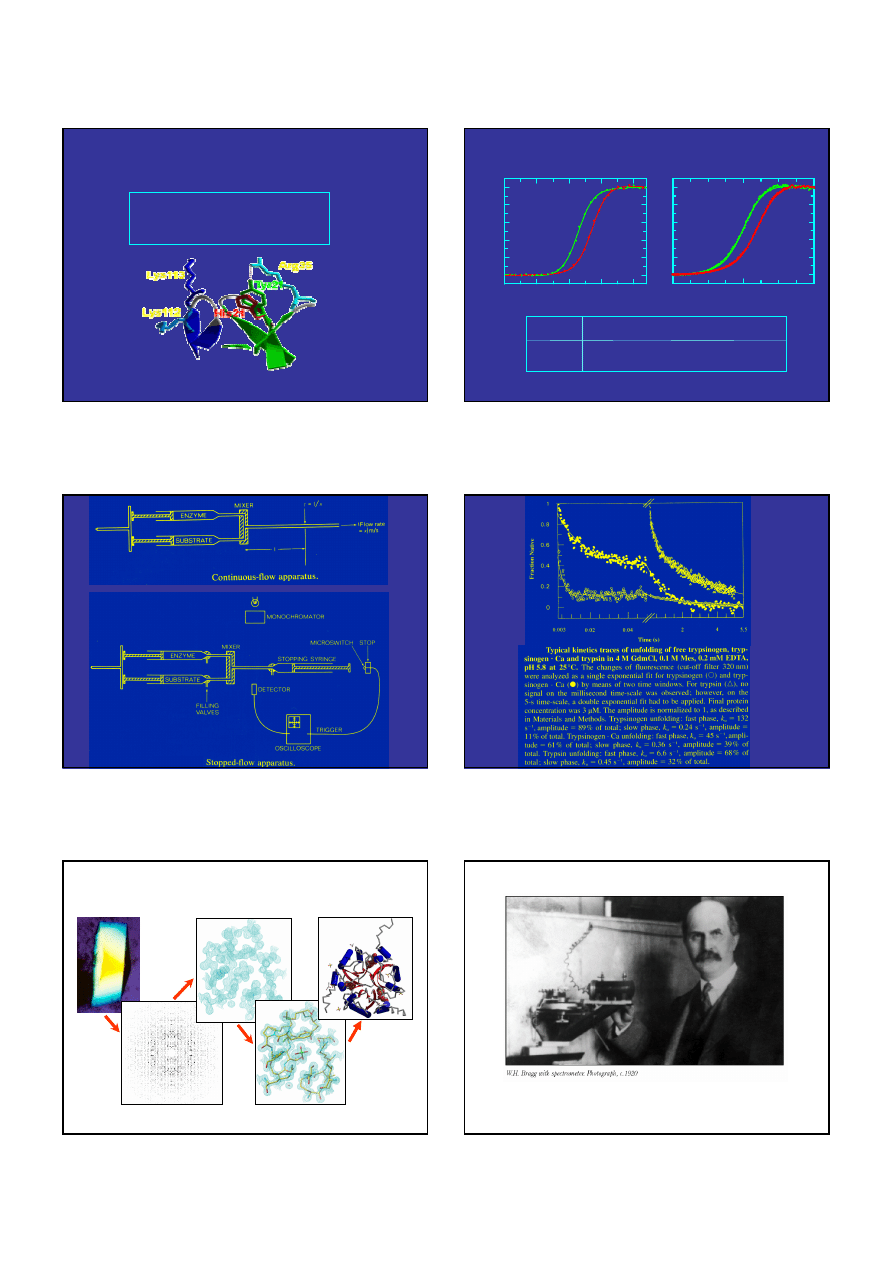
Kurt Wüthrich,
Ph.D., Dr. h.c. mult.
Professor of Biophysics
The Nobel Prize in
Chemistry 2002
A
B
D
E
F
H
I
J
C
G
A
B
D
E
F
G
I
J
C
H
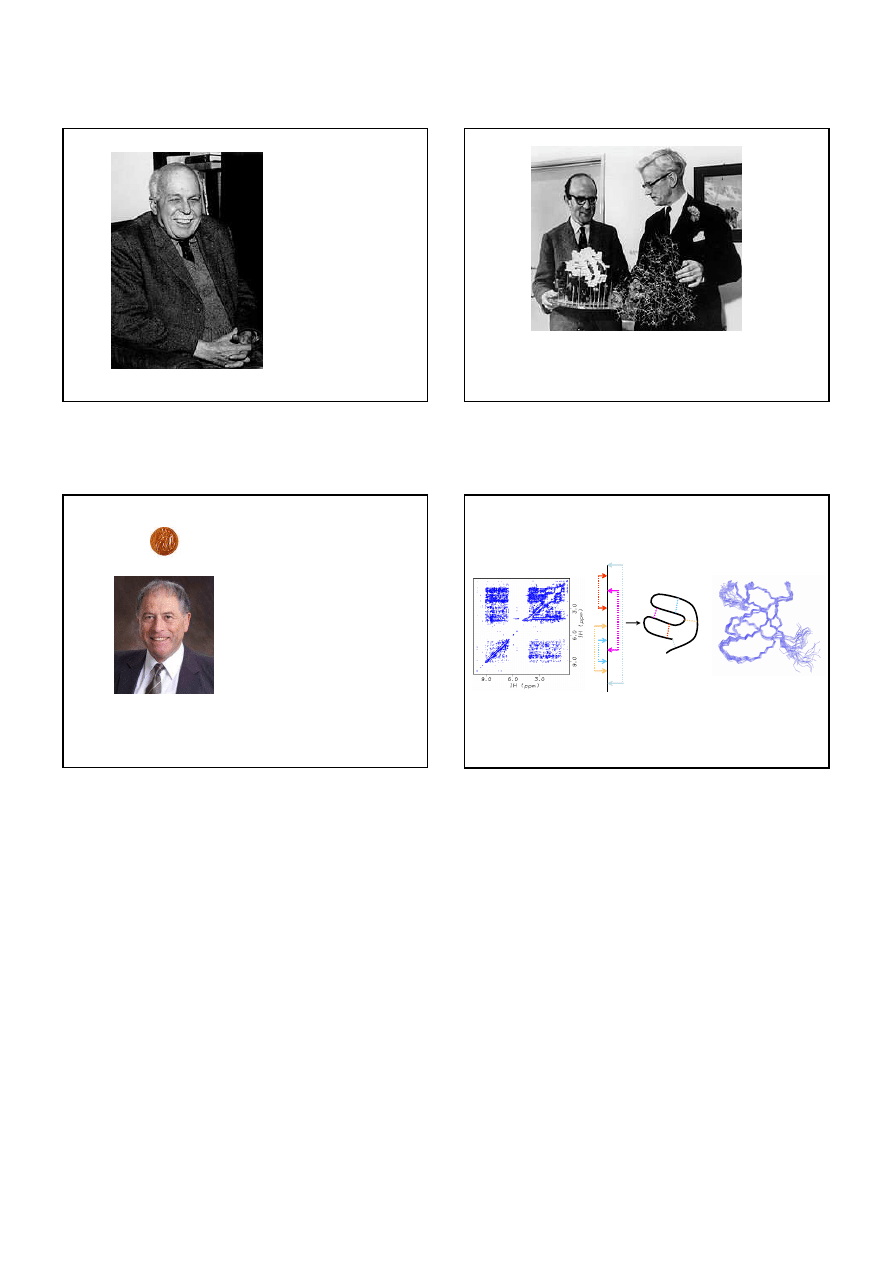
NMR: Od widma do struktury
2D Homonuclear Spectrum of NusB
5hck
Human Hematopoetic Cell Kinase
Wyszukiwarka
Podobne podstrony:
04 Biochemia bialka funkcja
biochemia bialka
Białka NOTATKI Z WYKŁADÓW, Biochemia, Biochemia, Białka aminokwasy DNA
Biochemia białka
biochemia BIALKA SPRAWKO1, POLITECHNIKA ŁÓDZKA, BIOCHEMIA
Biochemia białka
03 Biochemia bialka
biochemia białka
biochemia białka do sprawozdania (1)
biochemia bialka(1)
biochemia białka
biochemia białka 2
Bialka sprawko, Biochemia
Repetytorium Białka, Prywatne, biochemia, biochemia 1, biochemia, biochemia
więcej podobnych podstron