RY
ANAIR HOLDINGS plc
Annu
al R
epor
t and F
inanci
al S
ta
t
emen
t
s 200
7
COVER-SPINE-BACK 2007 23/08/2007 08:30 Page 1
COVER-SPINE-BACK 2007 23/08/2007 08:30 Page 2

1
CONTENTS
2
Financial Highlights
4
Chairman’s Report
6
Chief Executive’s Report
13
Operating and Financial Review
22
Directors’ Report
31
Directors
33
Social, Environmental and Ethical Report
36
Report of the Remuneration Committee to the Board
37
Statement of Directors’ Responsibilities
38
Independent Auditors’ Report to the Members of Ryanair Holdings plc
41
Consolidated Balance Sheet
42
Consolidated Income Statement
43
Consolidated Cash Flow Statement
44
Consolidated Statement of Recognised Income and Expense
45
Notes Forming Part of the Consolidated Financial Statements
81
Company Balance Sheet
82
Company Cash Flow Statement
83
Notes Forming Part of Company Financial Statements
87
Directors and Other Information
Certain information included in these statements are forward looking and are subject to certain risks and uncertainties
that could cause actual results to differ materially. It is not reasonably possible to itemise all of the many factors and specific
events that could affect the outlook and results on an airline operating in the European economy. Among the factors that are
subject to change and could significantly impact the Group’s expected results are the airline pricing environment, the availability
and cost of fuel, competition from new and existing carriers, market places for replacement aircraft, costs of compliance with
environmental issues and emission standards, safety and security measures, actions of the Irish, UK, European Union (“EU”) and
other Governments and their respective regulatory agencies, fluctuations in currency exchange rates and interest rates, airport
access and charges, labour relations, terrorist acts, the economic environment of the airline industry, the general economic
environment in Ireland, the UK and Continental Europe, the general willingness of passengers to travel and other economic,
social and political factors.

2
Financial Highlights
(i) The 2007 adjusted net profit excludes a release of 34.2m due to a prior year tax overprovision. The 2006 adjusted net profit
excludes a receipt of 5.2m (net of tax) from the settlement on an insurance claim for the scribing of 6 Boeing 737-200 aircraft.
Details of these adjustments are more fully set out in the table on page 14.
(ii) Adjusted for 2 for 1 stock split on February 26, 2007.
Summarised consolidated income
statement in accordance with IFRS
Operating revenue
2,236.9
1,692.5
+32%
Net profit
435.6
306.7
+42%
Adjusted net profit (i)
401.4
301.5
+33%
Adjusted Basic EPS (in euro cent) (ii)
25.99
19.66
+32%
2007
m
2006
m
Change
3
Key Statistics
Scheduled passengers
42.5m
34.8m
+22%
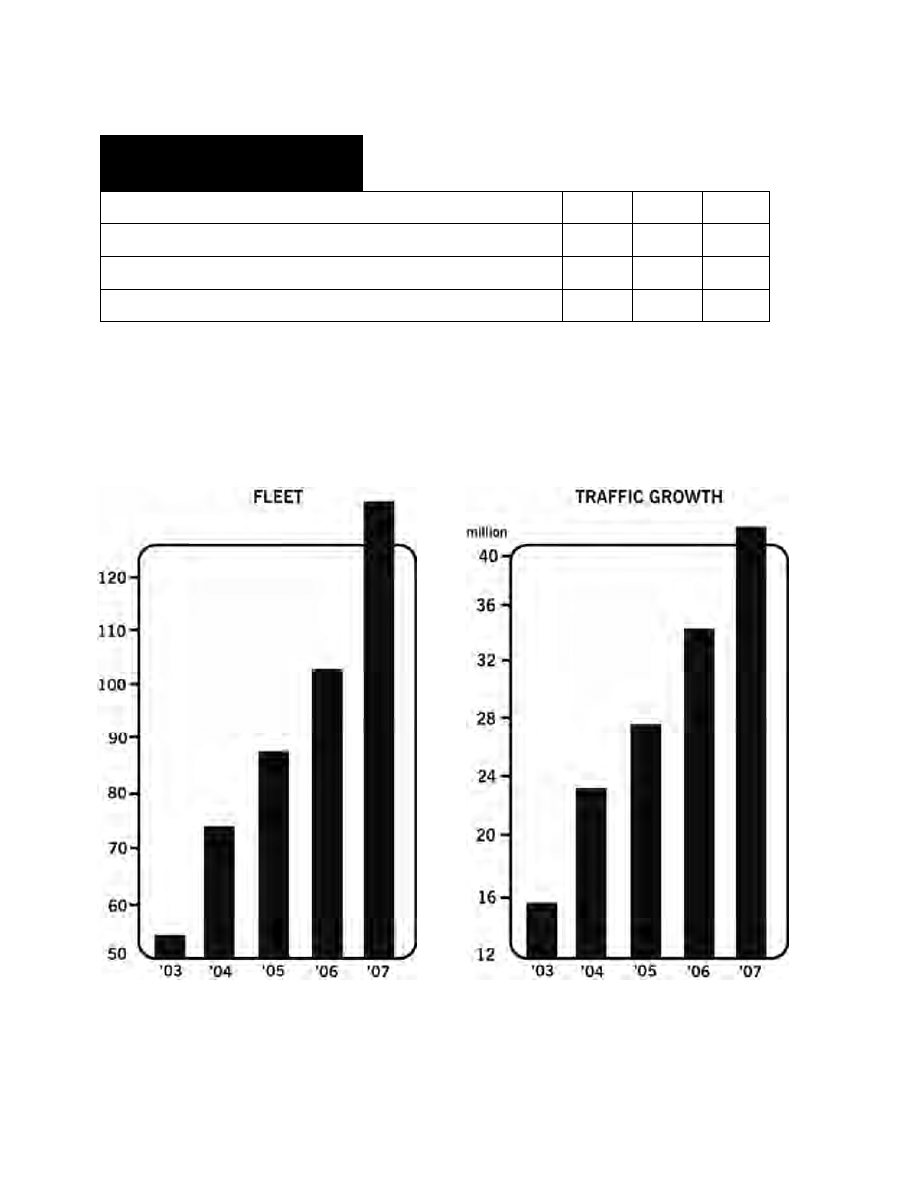
Fleet at period end
133
103
+29%
Average number of employees
3,991
3,063
+30%
Passengers per average no. of employees
10,648
11,361
-6%
2007
2006 Change

4
Chairman’s Report
Dear Shareholders,
I am very pleased to report a 33% increase in adjusted net profit after tax to 401.4m. This is a
tremendous performance during a year when we suffered a 50% increase in fuel costs which was largely
offset by a 7% rise in average fares primarily driven by higher competitor fuel surcharges.
During this year we achieved a number of significant milestones:
•
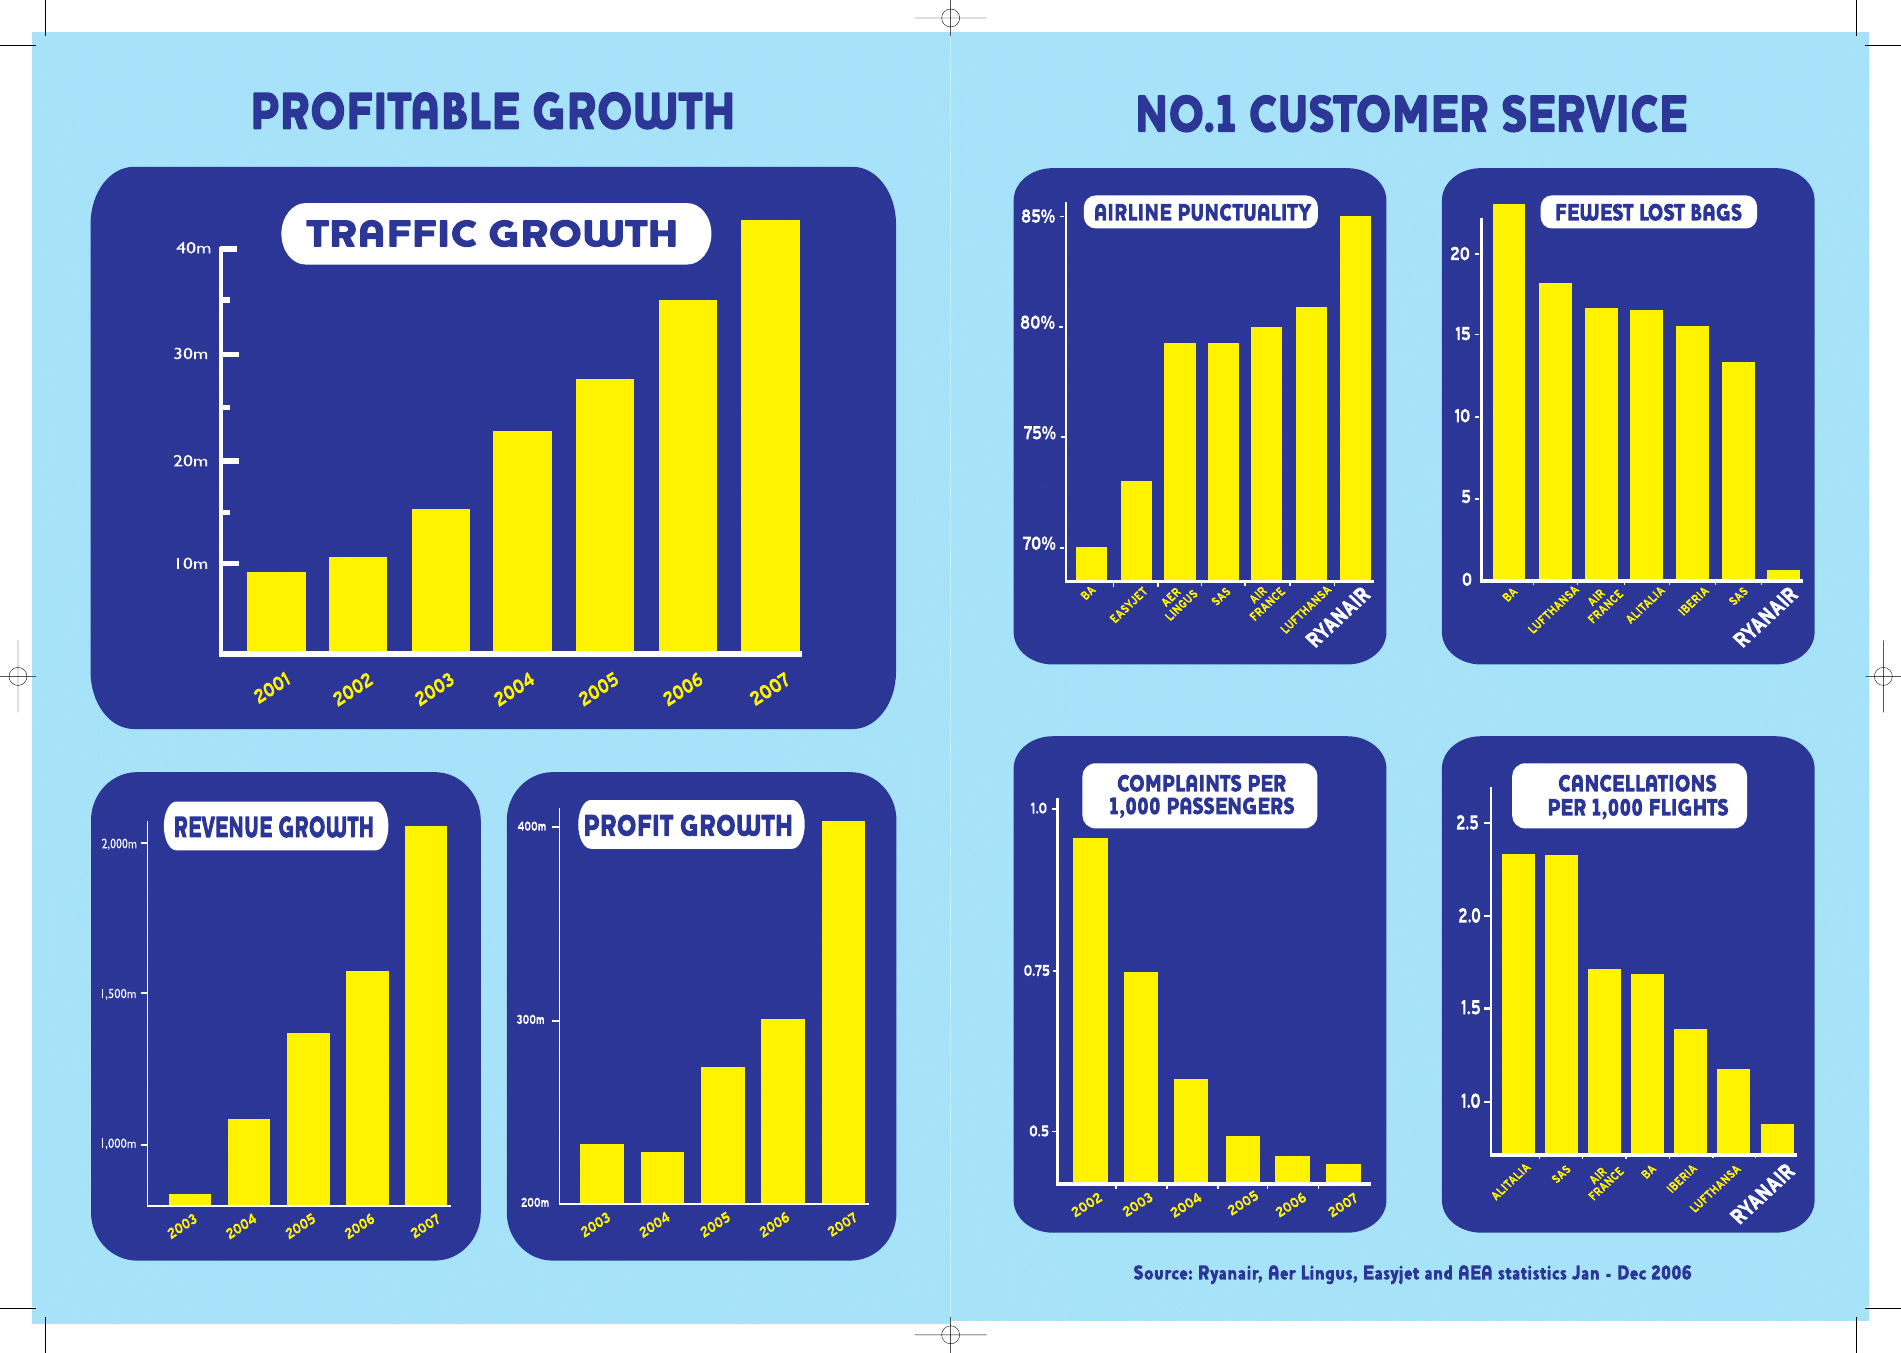
Our traffic grew by 22% to 42m passengers.
•
Our year end cash balance increased by 226m to 2.2bn.
•
We took delivery of 30 new aircraft during the year bringing the fleet to 133 aircraft.
•
We opened 153 new routes and 3 new bases at Marseille, Madrid and Bremen.
•
Average fares rose 7% despite our 22% traffic growth.
•
We acquired a 29.44% stake in Aer Lingus.
•
We exercised options over 42 Boeing 737-800 aircraft.
Fuel now accounts for almost 40% of our total operating costs and has significantly altered our cost
structure. We were adversely impacted by a one off step up in our pilot crewing ratio, primarily due to
longer sector lengths. As a result unit costs rose by 9% and we will continue to work even harder to
reduce our cost base.
Our industry leading customer service delivery continues, and we remained the number one major
airline in Europe with the best on time performance, fewest cancellations and the lowest level of lost
baggage. This has been achieved by the outstanding efforts of all of Ryanair’s people whose dedication
to maintaining this record is part of what makes Ryanair such a special airline.
During the year the shareholders approved the decision to purchase 29.44% of Aer Lingus at a cost
of 392m and to make an offer for the entire share capital of Aer Lingus. Consolidation among airlines
in Europe continues. The strategy to acquire Aer Lingus was part of this trend which would in turn lead
to the formation of one strong Irish airline Group able to compete with the mega carriers such as
Lufthansa/Swiss and Air France/KLM. We also made a commitment to eliminate Aer Lingus fuel
surcharges and reduce their fares, thus saving Aer Lingus passengers over 100m p.a. We were
disappointed by the European Commission’s decision to block this merger in order to appease the
narrow vested interest of the Irish government. This prohibition, the first of any EU airline merger, and
the first ever between 2 companies with less than 5% of the EU market, was we believe a politically
motivated decision. We will appeal this decision to the European courts and we will make every effort
to overturn this unfair decision.

5
Our commitment to offer passengers the lowest fares remains. We have recently introduced our
unique “lowest price” guarantee whereby if passengers can find a lower fare from a competitor on any
Ryanair city pair we will pay them double the difference. Unsurprisingly, we have had few claims. We
are confident that our fare guarantee will ensure that we won’t be beaten on price anywhere in Europe.
Market conditions have changed somewhat over recent months and as a result our forward
bookings and yields have softened. Nevertheless we will continue to work even harder to reduce our
costs while at the same time delivering the guaranteed lowest fares in Europe to our passengers. The
successful roll out of Ryanair’s low fares model across Europe continues with more countries and new
destinations being added and this will deliver increased returns for our shareholders.
Yours sincerely,
David Bonderman
Chairman

6
Chief Executive’s Report
Dear Shareholders,
These financial statements reflect another year of successful growth by Ryanair despite
significantly higher oil prices, intense competition and increasing regulatory interventions which are
designed to protect high fare flag carrier airlines by limiting consumer choice and competition.
What continues to make Ryanair unique is that we provide lowest fares are also the only airline to
guarantee our passengers no fuel surcharges, not today, not tomorrow, not ever. At a time when most
European flag carriers are increasing unjustified fuel surcharges, passengers continue to choose Ryanair,
confident that even if oil hits $100 a barrel, they won’t suffer a fuel surcharge.
Customer Service
Apart from the guaranteed lowest fares and a guarantee of no fuel surcharges, Ryanair’s passengers
continue to enjoy the No.1 customer service provided by any European airline.
Over the past year, Ryanair has continued to be Europe’s No.1 customer service airline. We offer
the best punctuality, the fewest lost bags and the fewest flight cancellations. Passengers who first
choose Ryanair for our low fares, continue to return for our punctuality, our reliability, our frequency of
services and our unmatched range of destinations.
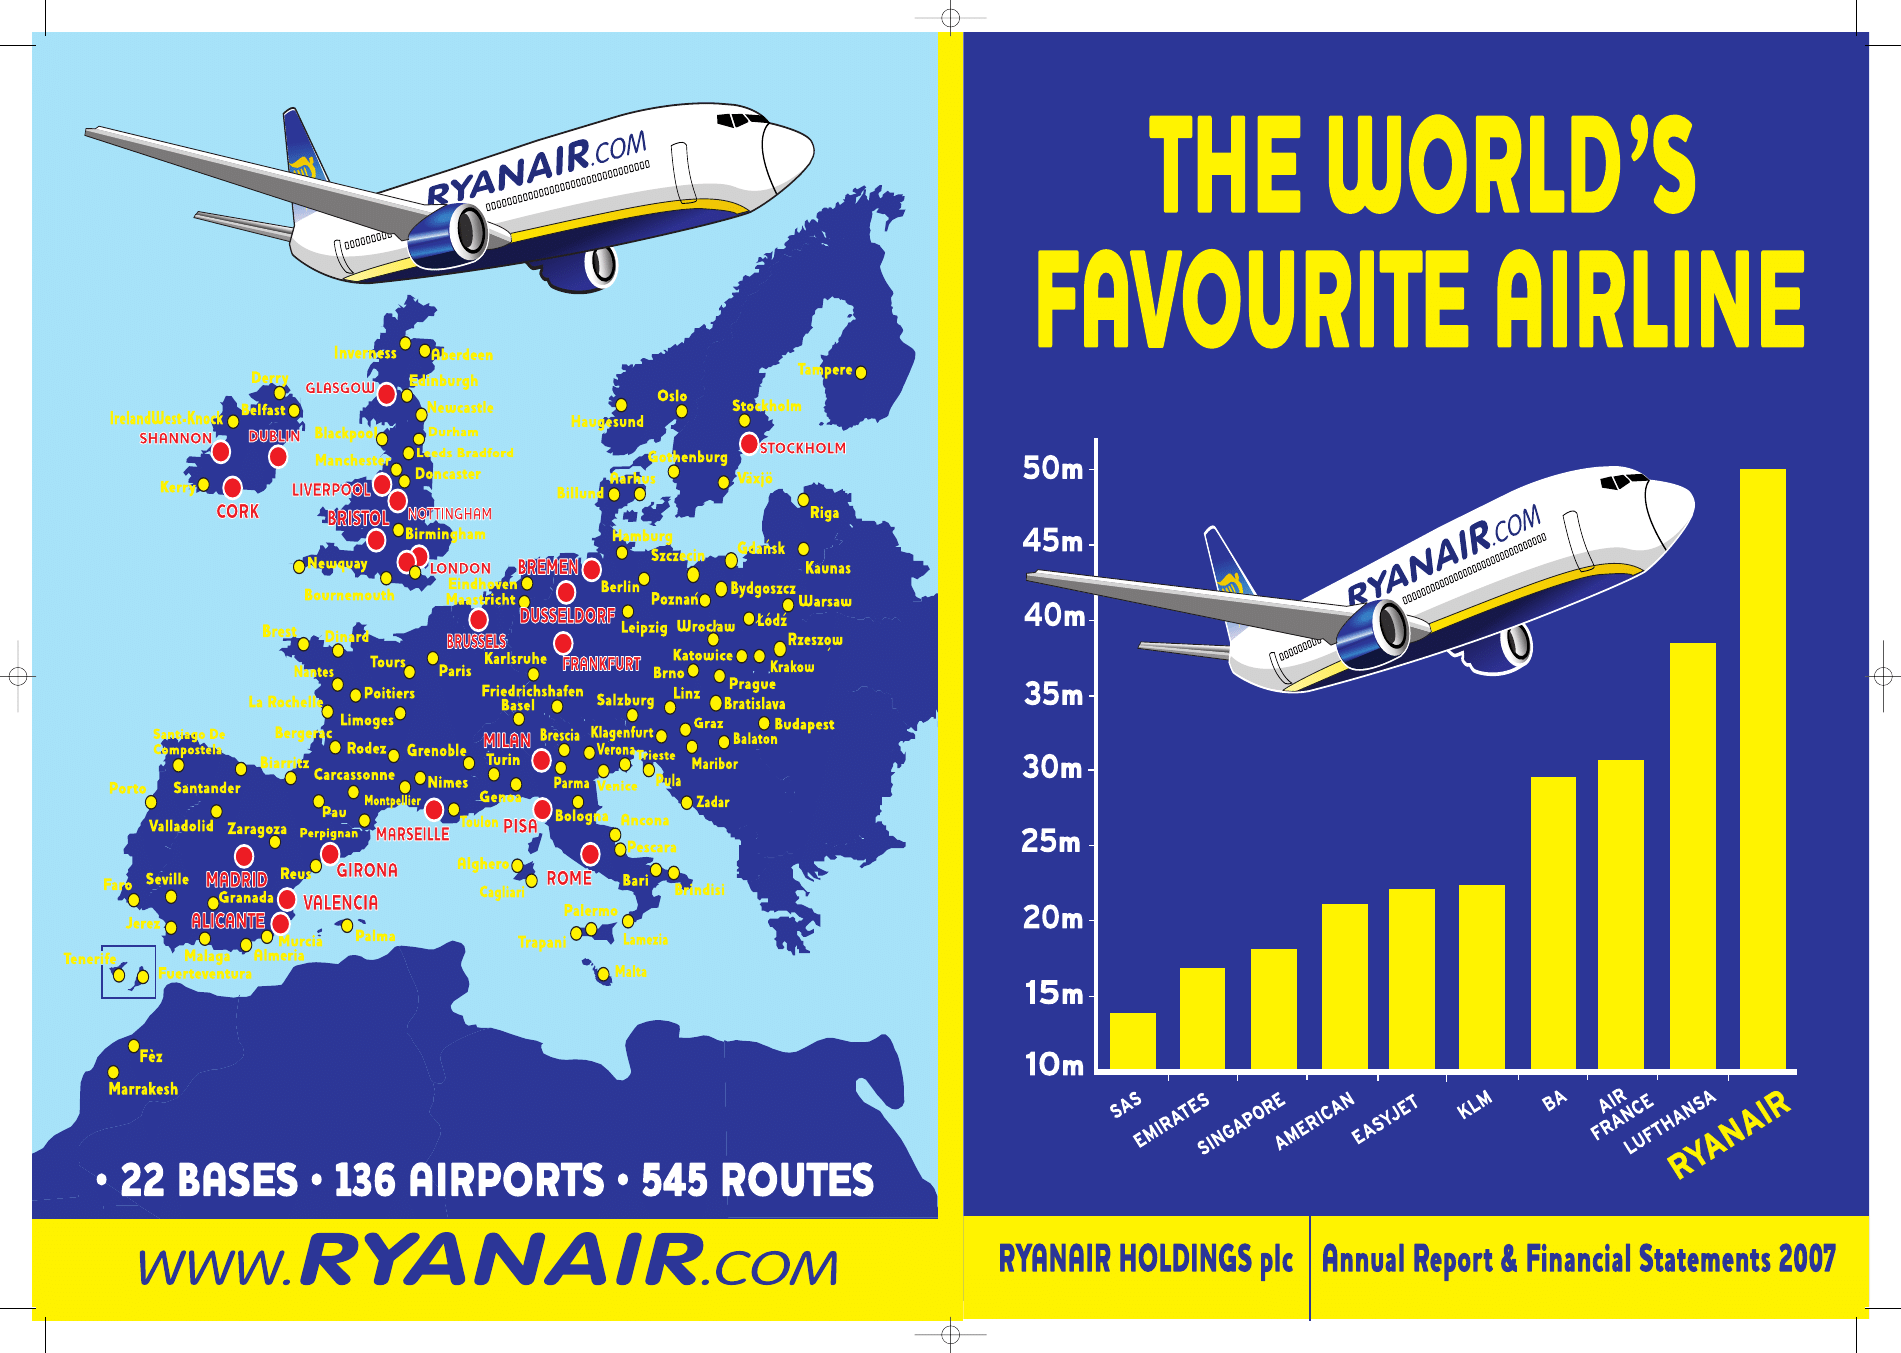
RYANAIR NO.1 for punctuality
% flights on time *
Ryanair 85%
Lufthansa 81%
Air France 80%
SAS 79%
Aer Lingus 79%
Easyjet 73%
BA 70%
*Source: Ryanair, Aer Lingus, Easyjet and AEA published statistics 2006

7
Europe’s No 1 for Customer Service*
Bags miss. per
Airline 1,000 pax % completions
Ryanair 0.4 99.5
Air France 16.3 98.4
Lufthansa 16.0 99.1
Aer Lingus RTP** RTP**
Alitalia 17.7 97.9
Easyjet RTP** RTP**
British Airways 28.0 99.1
Our People
The past year has seen Ryanair’s growth deliver more and even better paid jobs for our people, as
well as a significant number of promotions. Last year Ryanair created more than 1,000 new jobs and we
are proud that over 745 of our people have been promoted as our expansion creates new opportunities
for career development. Ryanair’s average pay (including cabin crew commissions) rose to 52,499 and
remains higher than many other major European airlines. Whilst our pay is amongst the highest in
Europe, we continue to manage our rosters to maximise our productivity while at work, but also
maximising our people’s time off. We will continue to provide thousands of new jobs and hundreds of
promotional opportunities for our people as we double in size over the coming 5 years.
Average Pay*
Ryanair 52,499
Air France KLM 47,540
British Airways 46,562
Iberia 44,057
Lufthansa 42,837
*Source: Based on latest published annual reports
*Source: Ryanair and AEA published statistics 2006
**Refused to publish (“RTP”)
8
Growth
With an average fare of just 44 (£30) - which is 50% cheaper than that of any other major
European airlines - it is no surprise that Ryanair continues to grow strongly. Last year we opened 3 new
bases in Bremen, Madrid and Marseille. All 3 are performing strongly. For the coming fiscal year we
have already announced 4 new bases in Alicante, Bristol, Düsseldorf Niederhein and Valencia. We plan
to take delivery of a net 30 new aircraft from Boeing this year, to enable us to carry over 50 million
passengers in the current year.
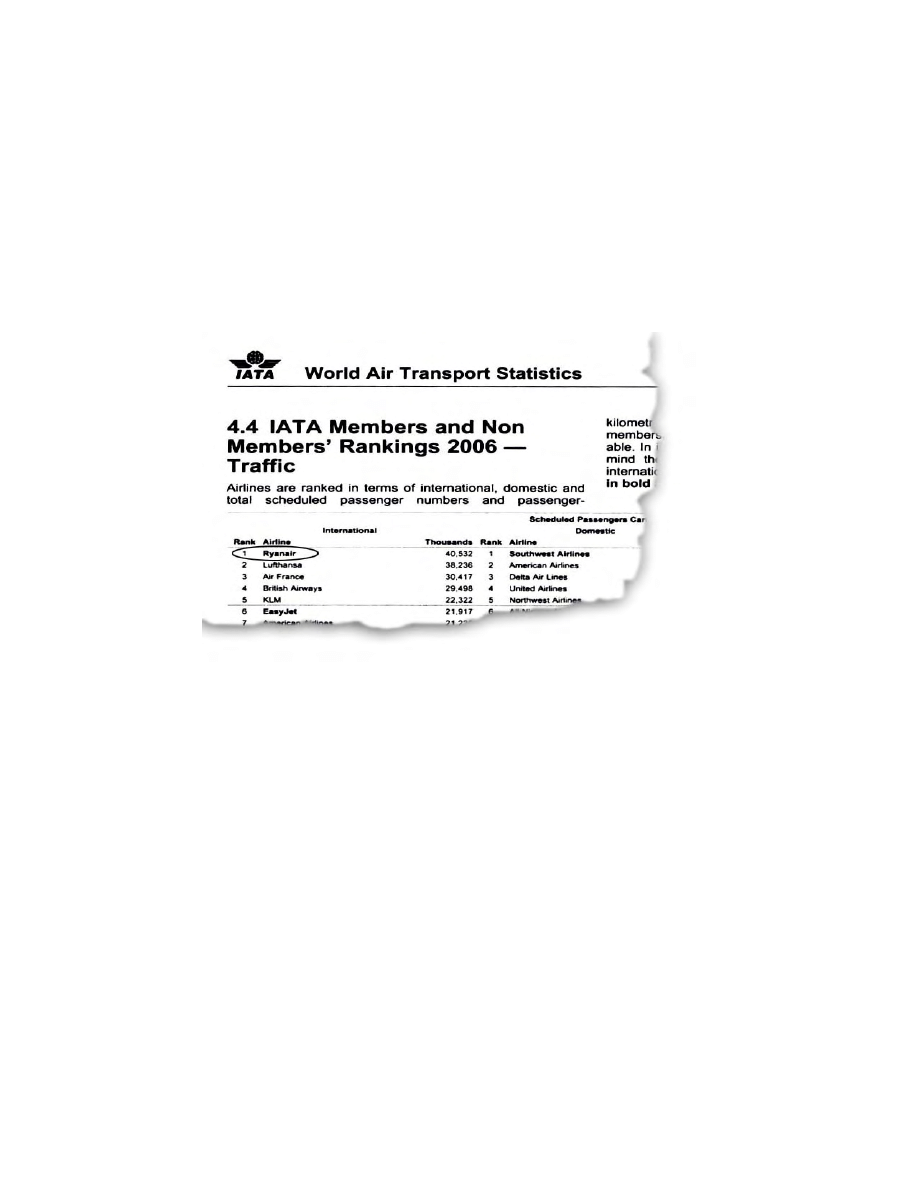
The recent IATA airline rankings confirmed that Ryanair has now become the world’s largest
carrier of international passengers, making Ryanair the world’s favourite airline. This is a fantastic
achievement by Ryanair’s people. It is remarkable that Ryanair, an airline which floated just 10 years
ago (when carrying 3 million passengers annually), has in a decade overtaken all of the world’s largest
international airlines.
We have no intention of resting on our laurels. We have announced a 5 year plan to double our
traffic to over 80m passengers by 2012 and we expect that our combination of lower fares and lower
costs will over that 5 year period enable us to double profitability as well. Europe is full of so called
low fares airlines who grow rapidly, but generally lose money. At Ryanair, like Southwest Airlines, we
have grown rapidly over the past decade, but have been continuously profitable throughout this period.
As always this growth will be neither smooth nor challenge free. There are a number of clouds on
our horizon, many of them centred around governmental and regulatory interference where there are
renewed attempts across Europe to protect the vested interests of high fare flag carriers at the expense of
more choice, more competition and more low fares for consumers.
The Environment
Air travel in general and low fare airlines in particular continue to be the target of inaccurate and
misguided attacks from a small section of environmentalists, uninformed politicians and media. When
study after study has factually proven that air travel accounts for less than 2% of world greenhouse gas
emissions, and less than 2% of Europe’s CO
2
emissions, it is blatantly clear that air travel is neither the
cause of nor the solution to climate change or global warming.
A number of recent studies into the environmental performance of European airlines have ranked
Ryanair as the greenest cleanest airline in Europe.
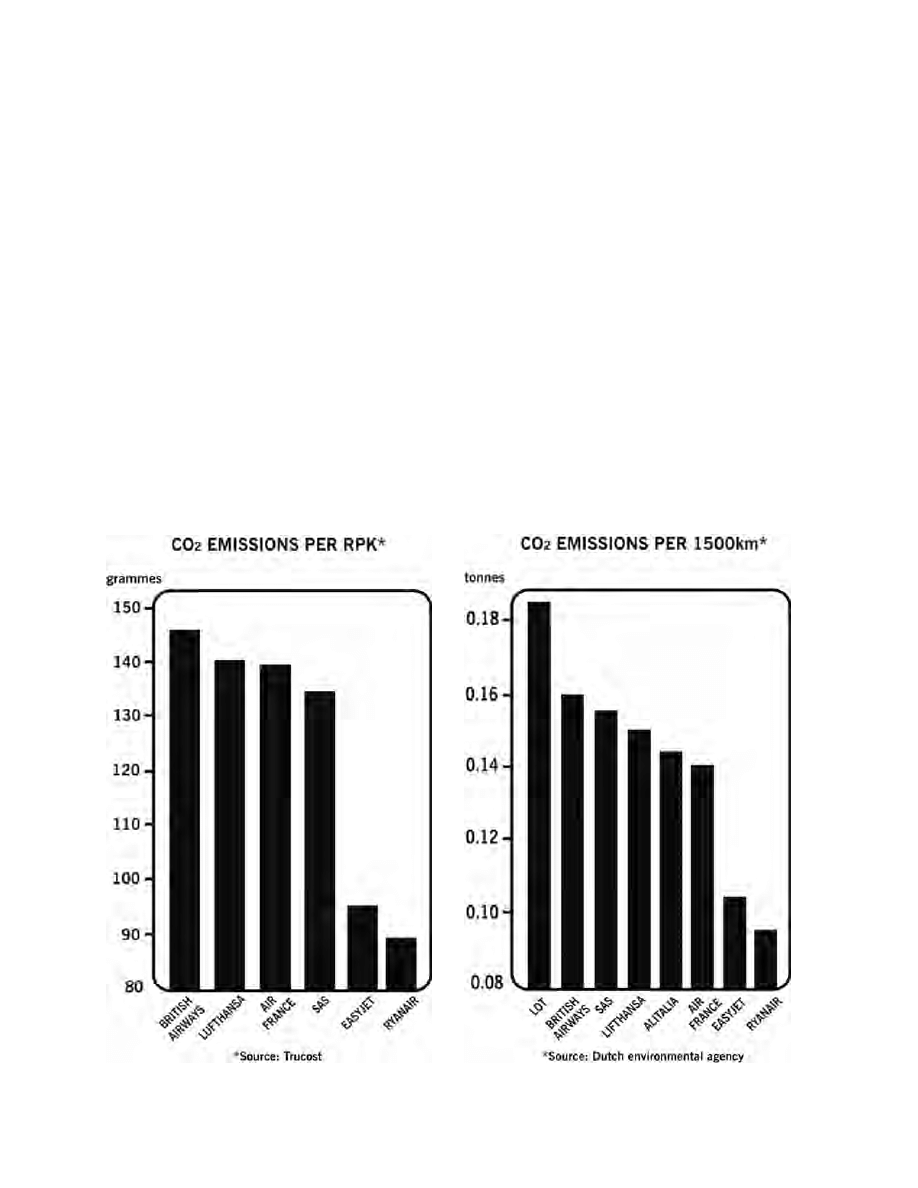
9
At Ryanair we have taken every possible step to reduce the impact of our passengers flights on the
environment. No other European airline can match Ryanair’s record of reducing our CO
2
emissions per
passenger by almost 50% over the past 5 years.
This reduction has been achieved by:
•
Flying brand new more efficient aircraft.
•
Fitting these with winglets to reduce fuel consumption.
•
Increasing the number of passengers per flight.
•
Discouraging all connecting passenger flights.
•
Ensuring that all our aircraft systems follow all fuel and noise minimisation procedures.
•
Reducing our inflight packaging by 40%
•
Switching from plastic to biodegradable products in our inflight services.
Independent recent surveys by both Trucost and the Dutch environmental agency have both
confirmed that Ryanair is Europe’s greenest cleanest airline.

10
Despite the enormous progress being made in this area by Europe’s airlines this unfounded
environmental hysteria has provided a convenient excuse for politicians such as Gordon Brown in the
UK to raise unfair and regressive taxes upon air travel. The £10 UK airport departure tax is more than
33% of Ryanair’s average fare of 44 (£30). It is unfair that price sensitive passengers flying with
Ryanair should pay a tax of over 33%, when business class carriers pay the same flat tax which equates
to less than 5% of their air fare. Despite claiming that this additional £1bn in tax revenue will be spent
on environmental measures, the British Government refuses to provide any indication as to what
“environmental measures” this unfair tax has been spent on.
The airline industry is already the most heavily taxed, and unsubsidised, form of mass transport in
Europe. We must continue to oppose these unfair and regressive taxes being levied on our passengers
under the false pretence of being an environmental measure. They are not. They are simply another
Government tax.
Regulated Monopoly Airports
At two of our largest bases, Dublin and Stansted, we continue to be the victim of powerful
monopoly airports, who abuse their market power under weak and ineffective regulatory regimes. In
Sept. 2005 Ryanair supported Dublin airport’s planned second terminal which was then announced at a
cost of 170m- 200m.
Within 12 months of announcing this 170m terminal, the DAA monopoly “redesigned” it and are
now trying to force through a second terminal and associated works which will cost four times more -
over 800m. They also plan to scrap the eight year old Pier C which was built at a cost of some 150m.
This is waste on a monumental scale, which is a direct consequence of the Irish Government’s failure to
honour its promise to deliver a competing second terminal at Dublin.
The Irish Commission for Aviation Regulation has confirmed that this new terminal is up to 50%
larger than is necessary and that the construction costs of the DAA’s proposed facilities are significantly
above market rates. The Dublin Airport monopoly have also announced plans to spend “about 450m”
extending and renovating the existing Terminal 1, but then bizarrely plans to reduce its capacity by 40%
from 25 MPPA to just 15 MPPA in order to comply with planning restrictions. However since Dublin
Airport will be rewarded – by the ineffectual regulator – with an annual rate of return on their capital
expenditure, then clearly the more money they can waste, the higher their future income will be.
In Dublin we continue to campaign for a competing second terminal, which was promised by the
Irish Government as far back as 2002. Sadly 5 years later there is still no sign of it. There is no
justification for granting the Dublin Airport Authority (a Government owned monopoly which has so
spectacularly mismanaged Dublin Airport for many years) the right to develop a second terminal. When
they can’t even manage one terminal properly, there is little chance of them building or running a
second one efficiently.
The same problems recur at Stansted Airport, where the BAA airport monopoly are even less
responsive to their airline users or passenger needs. The mismanagement of Stansted Airport this
Summer has been shameful. Despite written promises that 20 security machines would be fully staffed
during the morning peaks, Ryanair’s flights are regularly delayed and disrupted because insufficient
security staff are rostered to meet these minimum requirements. Passengers are frequently spending
longer in security and passport queues at Stansted than they are on board Ryanair’s flights! The BAA
monopoly suffers no penalty for this appalling mismanagement and its abysmal customer service.
They continue to be guaranteed a 7.5% return on their excessive capital expenditure at Stansted
and this inefficiency and mismanagement is now being used by the BAA monopoly as an excuse for
even more waste on over specified facilities which users neither want nor wish to pay for.

11
Ryanair continues to oppose the wasteful G2 project at Stansted where a second terminal and
runway are presently costed at almost £4bn. These facilities can and should be built for less than £1bn.
The BAA Stansted have dismissed Ryanair’s offers to develop and build this second terminal at
Ryanair’s own cost and risk, again because the CAA’s failed regulatory regime will reward them for
wasting £4bn instead of £1bn by quadrupling their projected income over the coming years.
In both cases, Ryanair is forced to shoulder an unfair and excessive regulatory burden. Our
requirements – despite being the largest airline user at both Dublin and Stansted airports – are routinely
ignored, not just by the airport monopoly, but also by the inept and ineffectual regulators. The Civil
Aviation Authority in the UK (an organisation that has proven itself totally unwilling and unfit to
regulate the BAA monopoly) has stood idly while the BAA Stansted doubled airport charges in April
this year. The CAA promised Ryanair that any overcharging by BAA Stansted would be recovered
during the next quinquennial review and yet now agrees with the BAA’s suggestion that Stansted should
be de-designated and released from all regulatory control. There is no justification for a private
monopoly owning the three major London airports. The solution to the high costs and low service
provided by the BAA is to break up the 3 London airports into separate ownership and force them to
compete against each other for the custom of airlines and passengers.
Aer Lingus Offer
The European Commission published a decision on 27
th
June prohibiting Ryanair’s offer for Aer
Lingus. This prohibition was, we believe, a politically motivated decision. It totally overturns some 20
years of EU airline mergers and is the first time in any industry that the European Commission has
blocked the merger of two companies, which between them control less than 5% of the European
market. This prohibition demonstrates yet again that the European Commission panders to the needs of
national governments. The Irish Government vigorously objected to Ryanair’s acquisition of Aer
Lingus and we believe this is the sole reason why the offer was blocked.
We will shortly file an appeal against this decision and will make every effort to overturn this
unfair decision. It is illogical, for the European Commission to block the merger of Ryanair with Aer
Lingus, at a time when it is encouraging and promoting intra European airline consolidation to form
stronger European airline groups capable of competing with the American mega carriers in an Open
Skies environment.
We also believe there was no sound legal basis for the Commission’s decision. Their claims that
Ryanair’s offer would lead to less competition and higher fares are simply unsustainable, when Ryanair
had already committed to maintaining Aer Lingus as a separate operation, lowering its fares and
eliminating fuel surcharges.
It is interesting that in the weeks after this prohibition, Aer Lingus has now announced its
withdrawal from the Shannon-Heathrow route in favour of a base in Belfast Aldergrove Airport. This
continues Aer Lingus’s strategy in recent years of withdrawing from routes where it faces competition
from Ryanair and allocating capacity to routes where it does not compete with Ryanair.
We remain convinced that Aer Lingus has a bright future as part of a strong Irish airline group with
Ryanair. We would significantly lower their costs enabling them to lower their air fares which would in
turn guarantee a future of strong growth and improved profitability at Aer Lingus.

12
Conclusion
Over the past decade as a public company Ryanair has continued to revolutionise air travel across
Europe. We have grown from 3m passengers to over 50m passengers per annum. From an airline
which operated just 19 routes in 1997, this year Ryanair will operate over 550 routes from 22 base
airports across the length and breadth of Europe. Our employee numbers have quadrupled to over 4,500
today. Most importantly our average passenger fare has fallen from 57 in 1997 to just 44 (£30) today.
Ryanair will continue to pursue lower costs and to pass on these savings in the form of lower fares
to passengers all over Europe. Ryanair is the only European airline which is committed to guaranteeing
the lowest fares in every market and guaranteeing that there will be no fuel surcharges today, tomorrow
or ever. We intend to continue to grow, safely and profitably, for the benefit of our passengers, our
people and our shareholders.
We take considerable pride from the knowledge that any shareholder who invested 100 in
Ryanair’s share during the flotation in 1997 has seen his investment multiply more than five fold to
617 today. This is a compound annual rate of return of 20%, making Ryanair one of the best
performing stocks over the past decade. We are determined to continue this performance over the next
5 years as we expect to double our traffic, profits and hopefully our share price as well.
Your sincerely,
Michael O’Leary
Chief Executive

13
Operating and Financial Review
Consolidated Income Statement
Year ended
March 31, 2007
Year ended
March 31, 2006
000
000
Operating revenues
Scheduled revenues
1,874,791 1,433,377
Ancillary revenues
362,104
259,153
Total operating revenues—continuing operations ........................................
2,236,895
1,692,530
Operating expenses
Staff costs ................................................................................................
(226,580)
(171,412)
Depreciation................................................................................................
(143,503)
(124,405)
Fuel & oil................................................................................................
(693,331)
(462,466)
Maintenance, materials & repairs ................................................................
(42,046)
(37,417)
Marketing & distribution costs ................................................................
(23,795)
(13,912)
Aircraft rentals ...............................................................................................
(58,183)
(47,376)
Route charges................................................................................................
(199,240)
(164,577)
Airport & handling charges ...........................................................................
(273,613)
(216,301)
Other ..............................................................................................................
(104,859)
(79,618)
Total operating expenses .................................................................................
(1,765,150)
(1,317,484)
Operating profit – continuing operations ......................................................
471,745
375,046
Other income/(expenses)
Finance income ..............................................................................................
62,983
38,219
Finance expense.............................................................................................
(82,876)
(73,958)
Foreign exchange (losses)..............................................................................
(906)
(1,234)
Gain on disposal of property, plant and equipment........................................
91
815
Total other income/(expenses).........................................................................
(20,708)
(36,158)
Profit before tax ...............................................................................................
451,037
338,888
Tax on profit on ordinary activities................................................................
(15,437)
(32,176)
Profit for the year –all attributable to equity holders of parent ..................
435,600
306,712
Earnings per ordinary share (in cent)
-Basic.............................................................................................................
28.20
20.00
-Diluted..........................................................................................................
27.97
19.87
Adjusted earnings per ordinary share (in cent)*
-Basic .............................................................................................................
25.99
19.66
-Diluted..........................................................................................................
25.77
19.53
Weighted average number of ordinary share (in 000’s)**
-Basic .............................................................................................................
1,544,457
1,533,666
-Diluted..........................................................................................................
1,557,503
1,543,562
*Calculated on profit for the year before items set out in table overleaf and based on weighted average number of shares as stated above.
**Adjusted for share split of 2 for 1 which occurred on February 26, 2007.

14
Reconciliation of profit for the year to adjusted profit for the year
Year ended
March 31, 2007
Year ended
March 31, 2006
000
000
Profit for the financial year................................................................
435,600 306,712
Adjustments
Aircraft insurance claim.................................................................................
- (5,939)
Tax adjustment for above...............................................................................
- 742
Release of income tax overprovision .............................................................
(34,199) -
Adjusted profit for the year
401,401 301,515
The item described above for the year ended March 31, 2007 consists of the one time release of an overprovision, principally from
deferred tax. In the year ended March 31, 2006 adjusted items consist of a receipt of 5.2m (net of tax) arising from the settlement of
an insurance claim for the scribing of 6 Boeing 737-200 aircraft. The tax provision adjustments are classified within tax expenses, and
the aircraft insurance claim is classified within other expenses for the purposes of the Group’s statutory financial statements.
Profit after tax increased by 42% to 435.6m compared to 306.7m in the previous year ended
March 31, 2006, whilst adjusted profit after tax increased by 33% to 401.4m. For the purpose of the
operating and financial review all figures and comments are by reference to the adjusted income
statement which excludes certain items as detailed above. We believe that these adjusted operating
measures represent our business more clearly as they exclude one off items that are not likely to recur.
Adjusted profit for the year
Profit after tax, increased by 33% to 401.4m due to a 7% increase in average fares (including
checked in baggage revenues), strong growth in ancillary revenues, offset by increased fuel costs which
rose by 50% to 693.3m, primarily reflecting the higher US dollar cost per gallon, and a one off step up
in staff costs, due to higher pilot crewing ratios, which rose by 32% to 226.6m. Operating margins,
as a result decreased by 1 point to 21%, which in turn resulted in operating profit increasing by 28% to
471.7m compared to year ended March 31, 2006.
Operating revenues
Total operating revenues increased by 32% to 2,236.9m whilst passenger volumes increased by
22% to 42.5m. Total revenue per passenger increased by 8% in the year due to higher average fares
and strong ancillary revenue growth.
Scheduled passenger revenues increased by 31% to 1,874.8m due to a 7% increase in average
fares (including checked baggage revenues) reflecting the benign yield environment during the year
supported by competitor fuel surcharges. Passenger volumes increased by 22% to 42.5m reflecting
increased passenger numbers on existing routes, and the successful launch of our new routes and bases.
Load factor decreased by 1 point to 82% during the year due to the 23% increase in seat capacity.

15
Ancillary revenues continue to grow faster than passenger volumes with revenues increasing by
40% to 362.1m in the year. This performance reflects the strong growth in on board sales and non-
flight scheduled revenues including excess baggage revenue. In March, 2007 we also announced a new
5 year hotel partnership with Expedia.
Adjusted operating expenses
Total operating expenses rose by 33% to 1,765.2m due to the increased level of activity, and the
increased costs associated with the growth of the airline particularly higher fuel and staff costs. Total
operating expenses were also adversely impacted by a 6% increase in the average sector length, whilst
higher US dollar fuel prices were partially offset by the strength of the euro exchange rate against the
US dollar.
Staff costs have increased by 32% to 226.6m. This primarily reflects a 30% increase in total
employee numbers to 4,462 and the impact of pay increases granted during the year. Employee numbers
rose due to an increase in pilot crewing ratios as a result of continued increases in sector length. Pilots,
who earn higher than the average salary, accounted for 43% of the increase in employees during the
year.
Depreciation and amortisation increased by 15% to 143.5m. There are an additional 19 ‘owned’
Boeing 737-800 aircraft in the fleet this year compared to last year. The resultant higher depreciation
charge was offset by a combination of lower amortisation due to the retirement of Boeing 737-200
aircraft and the positive impact of a new engine maintenance deal on the cost of amortisation of Boeing
737-800 aircraft. The strengthening of the euro versus the US dollar also had a positive impact on the
depreciation and amortisation charge for new aircraft acquired.
Fuel costs rose by 50% to 693.3m due to a 25% increase in the number of hours flown and a 28%
increase in the average US dollar cost per gallon of fuel partially offset by the positive impact of the
strengthening of the euro versus the US dollar and a 3% reduction in fuel consumption due to the
installation of winglets on our Boeing 737-800 fleet.
Maintenance costs increased by 12% to 42.0m, reflecting improved reliability of the Boeing 737-
800’s operated, due to a combination of the rise in the number of leased Boeing 737-800 aircraft from
17 to 32, a lower level of maintenance costs incurred due to the retirement of the Boeing 737-200’s, and
the positive impact of the strengthening of the euro versus the US dollar exchange rate.
Marketing and distribution costs increased by 71% to 23.8m due to a higher level of marketing
activity and related expenditure compared to the previous year as the number of routes operated rose by
67% to 428 at the year end and the number of bases increased by 3 to 18.
Aircraft rental costs increased by 23% to 58.2m reflecting an additional 15 leased aircraft during
the year.

16
Route charges rose by 21% to 199.2m due to an increase in the number of sectors flown and an
increase of 6% in the average sector length, offset by a reduction in enroute charges in certain EU
countries.
Airport and handling charges increased by 27% to 273.6m. This is higher than the growth in
passenger volumes and reflects the impact of increased costs at certain existing airports, particularly at
our Dublin base, which has grown significantly this year and has a much higher average cost per
passenger, offset by lower costs at new airports and bases.
Other expenses increased by 23% to 104.9m, which is lower than the growth in ancillary
revenues due to improved margins on some existing products and cost reductions on some indirect
costs.
Adjusted operating profits
Operating margins have declined by 1 point to 21% due to the reasons outlined above whilst
operating profits have increased by 28% to 471.7m during the year.
Finance income
Interest receivable has increased by 65% to 63.0m for the year due to the combined impact of
higher levels of cash and cash equivalents and increases in average deposit rates earned in the year.
Finance expense
Interest payable increased by 12% to 82.9m due to the drawdown of further debt to part fund the
purchase of new aircraft and the adverse impact of higher interest rates.
Foreign exchange (losses)
Foreign exchange losses have decreased during the year to 0.9m due to the positive impact of
changes in the US dollar exchange rates against the euro compared to last year.
Adjusted earnings per share (EPS
)
Adjusted earnings per share has increased by 32% to 25.99 euro cent for the year and is based on
1,544,457,436* shares which represents the weighted average number of ordinary shares in issue during
the year. (* Adjusted for a share split of 2 for 1 which occurred on February 26, 2007)

17
Balance sheet
The consolidated balance sheet continues to strengthen due to the strong growth in profits during
the year. The Group generated cash from operating activities of 869.9m which part funded the
investment in financial assets (Aer Lingus) of 344.9m
and capital expenditure incurred during the year
with the balance reflected in total cash of 2,198.0m. Capital expenditure amounted to 495.0m which
largely consisted of advance payments for future aircraft deliveries and the delivery of 15 owned aircraft
during the year. Long term debt, net of repayments, increased by 184.3m during the year.
Shareholders’ equity
Shareholders’ equity at March 31, 2007 has increased by 547.8m to 2,539.8m, compared to
March 31, 2006 reflecting the 401.4m increase in adjusted profitability during the year, the exercise of
share options which increased shareholder funds by 11.2m and the impact of the IFRS accounting
treatment for derivative financial instruments, financial assets, pensions and stock options which are
accounted for within equity and which also increased shareholders’ funds by 99.0m.
Capital expenditure
During the year the Group’s capital expenditure amounted to 495.0m. The majority of this
related to the purchase of 15 Boeing 737-800 “next generation” aircraft and deposits relating to the
future acquisition of additional new Boeing 737-800’s. An additional 15 new Boeing 737-800 “next
generation” aircraft were financed by way of operating lease during the year bringing the increase in
total new aircraft operated to 30. Further details are given in note 2.
Review of cash flow
Net cash provided by operating activities was 869.9m reflecting the overall profitability of the
Group and working capital movements including advance revenues. This has enabled the Group to
increase its total cash by 226.0m to 2,198.0m despite part funding capital expenditure of 155.6m
from internal cash resources. At March 31, 2007 the Group had advance purchase deposits of 392.6m
for future aircraft deliveries.
Outlook for fiscal 2008
We anticipate that the recent softness in yields and bookings will continue for the remainder of this
fiscal year. Fuel prices are high although we have hedged 90% of our requirements for the remainder of
the fiscal year at a cost of approximately $65 per barrel which is 10% lower than we achieved last year.
We also anticipate that ancillary revenues will continue to outpace the growth in passenger
volumes. In terms of costs we face a doubling of airport charges at Stansted, significantly higher charges
at Dublin, a one off step up in cabin crew ratios which, combined with a longer sector length, will result
in unit costs increasing by approximately 5% in the coming year.
Ryanair’s aircraft delivery programme net of planned disposals will result in our fleet increasing to
163 aircraft at the end of next year. This will in turn mean that capacity will grow by 18% to 50m
passengers. We have already announced the launch of our new bases at Bristol, Alicante and Valencia
which will commence this winter.

18
We will continue to grow over the winter period, however, due to the softness in yields, and the
doubling of both UK APD and costs at Stansted, we plan to reduce the number of aircraft operated ex
Stansted this winter by almost 20% from 40 to 33. This will mean reduced frequency or temporary
cessation of services on routes which would be loss making due to Stansted’s higher airport charges.
Consequently passenger volumes this winter will now grow at a slower rate (by 18% to 50m) than the
24% to 52m previously guided. These capacity reductions should bring more stability to yields, whilst,
at the same time, reducing operating costs and eliminating losses on these non profitable winter routes at
Stansted.
Our outlook remains cautious for the fiscal year due to the softness of traffic and yields. Although
we have little visibility beyond the next 2 months we expect this weaker demand to continue. We
anticipate that yields in Q2 will be slightly down, and winter (H2) yields will be down by as much as
-5% to -10% compared to last year. However, the reduction in capacity on non profitable winter routes,
and the significant airport cost savings this cutback will generate, will enable us to slightly increase our
previous guidance. We now expect that Net Profit will increase by (+10%) for the fiscal year compared
to (+5%) previously guided, although, we caution that this guidance will be heavily dependent upon the
accuracy of our forecast decline in yields for the second half of the year.
Legal proceedings
In February 2004 the European Commission ruled that Ryanair had received illegal state aid from
the Walloon Regional government in connection with its establishment of a low cost base at Brussels
(Charleroi). Ryanair immediately appealed the decision to the European courts on the basis that the
Commission had ignored similar agreements that Ryanair has with private airports, thereby placing
Charleroi at a competitive disadvantage. Subsequently Ryanair was requested by the Walloon regional
government to repay what the Commission had deemed illegal state aid. However, Ryanair agreed with
the Region to place the disputed funds in a joint escrow account pending the outcome of the appeal.
Ryanair is still awaiting a hearing of its appeal in the European Court of First Instance.
In the meantime, Brussels Charleroi Airport has published a new tariff scheme, which complies
with the new EU guidelines, whilst also maintaining the same cost base originally agreed with Ryanair.
As a result Ryanair has based additional aircraft and launched new routes from Charleroi.
Following the Commission’s decision in Charleroi other airlines have brought similar complaints
against Ryanair in an attempt to block competition. However, Ryanair is confident that its agreements
with publicly owned airports fully comply with the market economy investor principle (MEIP), i.e., they
are the same as its agreements with privately owned airports, and therefore do not constitute state aid.
Ryanair has also filed complaints with the European Commission against Alitalia, Air France and
Lufthansa on the basis of continued state aid to these national airlines. We also believe that Air France
and Alitalia are the beneficiaries of substantial subsidies via routes that are subject to the so-called
public service obligations (PSO’s). In 2006 Ryanair was prevented from offering commercial services
on the Rome to Alghero (Sardinia) route as a result of what Ryanair believes to be the Italian
government’s abusive application of the PSO system to favour Italian airlines. The European
Commission has recently confirmed that the introduction of PSOs on routes between Sardinia and
mainland Italy was in breach of the PSO regime.

19
As a result of the retirement of the Boeing 737-200 aircraft, Ryanair required its pilots to undergo a
conversion training process to enable them to fly the new Boeing 737-800 aircraft. Starting in the
Autumn of 2004, Ryanair made a number of written offers to its Dublin based pilots to enable them to
participate in a re-training process in order to obtain the correct type rating for flying the Boeing 737-
800 aircraft. After rejecting a series of offers, all of these pilots have now been trained on the Boeing
737-800 either by signing a 5 year bond, in which case the training was provided free of charge unless
the pilots do not maintain their employment with Ryanair for a period of at least 5 years, in which case
they are obligated to reimburse Ryanair for the training costs. However, these pilots are at the same time
challenging the terms of these bonds before the Irish Labour Relations Commission and the Irish Labour
Court.
The Supreme Court overturned the decision of the Labour Court in this case and found that the
Labour Court had no jurisdiction. The Supreme Court has ordered that the case be reheard in the Labour
Court and it has set down guidelines under which this hearing should be conducted. In separate
proceedings, 64 of these pilots (only 26 of whom remain in the Company’s employment) have also
initiated proceedings before the Irish High Court, claiming that the terms of the bond infringed their
freedom of association rights and their right to allow trade unions to negotiate on their behalf.
While Ryanair believes these court proceedings to be without merit and is contesting the pilots’
claims, Ryanair could face potential sanctions in an amount up to a maximum of twice the annual salary
of the pilots involved if the Labour Relations Commission rules in favour of the pilots. With respect to
the Irish High Court proceedings, Ryanair estimates that damages up to a total of 100,000 could be
awarded to each pilot.
Recruitment and promotion
During the year 745 of our people were promoted internally within the Group, and Ryanair
employed over 1,000 more staff at the year end compared to the preceding year.
Safety
Safety in the airline remains an absolute priority. This is Ryanair’s 22nd year of safe operations.
Ryanair has extensive safety training programmes to ensure the recruitment of suitably qualified pilots,
cabin crew, ground crews and maintenance personnel. In addition, the Group operates and maintains all
of its aircraft in accordance with the highest European Aviation Industry Standards. Ryanair is regulated
by the Irish Aviation Authority.
At each Board Meeting a report prepared by the Ryanair Safety Committee is circulated in
advance and is reviewed by the Board. The Safety Committee, comprises Michael Horgan
(Chairperson), a Director of the Board, the Director of Flight and Ground Operations, the Chief Pilot,
the Flight Safety Officer, Director of Engineering, Director of Personnel and Inflight, Quality Assurance
Manager-Maintenance, Deputy Director of Ground Operations, Deputy Director – Safety, Health and
Safety Officer and the Chief Engineer. The Safety Committee meets on a quarterly basis and reports
directly to the Board of Directors. The Flight Safety Officer is responsible for monitoring flight safety.
The Group also has a Health and Safety Manager who is responsible for overseeing health and safety in
all areas. The Group continues to operate extensive training and safety programmes to ensure the health
and safety of all its passengers and employees.

20
Critical accounting policies
The Group believes that its critical accounting policies, which are those that require management'
s
most difficult, subjective and complex judgments, are those described in this section. These critical
accounting policies, the judgments and other uncertainties affecting application of those policies and the
sensitivity of reported results to changes in conditions and assumptions are factors to be considered in
reviewing the consolidated financial statements.
In accounting for long lived assets (principally aircraft and related parts), Ryanair must make
estimates about the expected useful lives of the assets, the expected residual values of the assets and the
potential for impairment based on the fair value of the assets and the cash flows they generate. In
estimating the lives and expected residual values of its aircraft, Ryanair has primarily relied on it’s own
and industry experience and recommendations from Boeing, the manufacturer of all of the Company'
s
owned aircraft. Subsequent revisions to these estimates, which can be significant, could be caused by
changes to Ryanair'
s maintenance program, changes in utilisation of the aircraft, governmental
regulations on ageing of aircraft and changing market prices for new and used aircraft of the same or
similar types.
Ryanair evaluates its estimates and assumptions in each reporting period, and when warranted
adjusts these assumptions. Generally, these adjustments are accounted for on a prospective basis,
through depreciation expense.
Ryanair periodically evaluates its long lived assets for impairment. Factors that would indicate
potential impairment would include, but are not limited to, significant decreases in the market value of
aircraft, a significant change in an aircraft’s physical condition and operating or cash-flow losses
associated with the use of the aircraft. While the airline industry as a whole has experienced many of
these factors from time to time, Ryanair has not yet been seriously impacted and continues to record
positive cash flows from these long lived assets. Consequently, Ryanair has not yet identified any
impairments related to its existing aircraft fleet. The company will continue to monitor its aircraft and
the general airline operating environment.
An element of the cost of an acquired aircraft is attributed on acquisition to its service potential,
reflecting the maintenance condition of the engines and airframe. Additionally, where Ryanair has a
lease commitment to perform aircraft maintenance, a provision is made during the lease term for this
obligation. Both of these accounting policies involve the use of estimates in determining the quantum of
both the initial maintenance asset and/or the amount of provision to be set aside and the respective
periods over which such amounts are charged to income. In making such estimates, Ryanair has
primarily relied on industry experience, industry regulations and recommendations from Boeing;
however, these estimates can be subject to revision, depending on a number of factors, such as the
timing of the planned maintenance, the ultimate utilisation of the aircraft, changes to government
regulations and increases and decreases in the estimated costs. Ryanair evaluates its estimates and
assumptions in each reporting period and, when warranted, adjusts these assumptions, which generally
impact on maintenance and depreciation expense in the income statement, on a prospective basis.
Treasury policy, fuel, currency and interest rate risk management
Details of our principal treasury policies are set out in notes 5 and 11.

21
Additional performance measures
The Group has referred to a number of additional performance measures throughout this operating
and financial review, which are defined as follows:
•
Adjusted profit for the year is as set out on page 14. Items adjusted for include the financial
impact of once off events that are not normally expected to occur within the usual operating cycle of the
Group.
•
Adjusted operating expenses are total operating expenses as adjusted for the items defined on
page 14.
•
Adjusted operating margin is the adjusted operating profit expressed as a percentage of total
revenues.
•
Adjusted operating profit is the operating profit as adjusted for the items listed on page 14
excluding the effect of taxation.
•
Adjusted earnings per share relates to basic earnings per share adjusted to take account of items
listed on page 14 and as more fully described in note 23.

22
Directors’ Report
N
UAL REPORT & F INANCIAL STATE MENTS 2006
Review of business activities and future developments in the business
The Group operates a low fares airline business and plans to continue to develop this activity by
expanding its successful low fares formula on new and existing routes. A review of the Group’s
operations for the year is set out on pages 13 to 21.
Results for the year
Profit for the financial year amounted to 435.6m. Details of the results are set out in the
consolidated income statement on page 42 and in the related notes.
Share capital
The number of ordinary shares in issue at March 31, 2007 was 1,547,028,730 (2006:
1,542,033,246). (Adjusted for a 2 for 1 stock split on February 26, 2007)
Accounting records
The directors believe that they have complied with the requirements of Section 202 of the
Companies Act, 1990 with regard to books of account by employing financial personnel with
appropriate expertise and by providing adequate resources to the financial function. The books of
account of the Company are maintained at its registered office, Corporate Headquarters, Dublin Airport,
Co. Dublin.
Staff
At March 31, 2007, the Group employed 4,462 people. This compares to 3,453 staff at March 31,
2006. The increase in staff levels consisted mainly of pilots and cabin crew and arose due to the
expansion of the aircraft fleet and continued growth of the Group.
Air safety
Commitment to air safety is a priority of the Group. The Group has fully documented and
implemented a Safety Management System. The Group operates continuous staff training programmes.
In addition to the designation of a senior pilot as full time Flight Safety Officer, Ryanair has appointed a
Flight Safety and Administration Manager and a Flight Safety Administrator. In addition, Ryanair has a
Safety Committee as more fully discussed on page 19.
Company information
The Company was incorporated on August 23, 1996 with a registered number of 249885. It is
domiciled in the Republic of Ireland and has its registered offices at Corporate Headquarters, Dublin
Airport, Co. Dublin, Ireland. It is a public limited company and operates under the laws of Ireland.

23
Substantial Interests in Share Capital
As at July 31, 2007 the directors are aware of the following substantial interests in the share capital
of the Company which represent more than 3% of the issued share capital. At March 31, 2007 the free
float in shares was 94%.
NAME SHARES HELD % OF ISSUED
JULY 31, 2007 SHARE CAPITAL
SHARES HELD
MARCH 31, 2007
Capital Group
Companies Inc. 180,029,994 11.85%
150,112,196
Gilder Gagnon
Howe and Co LCC 93,749,190 6.17%
104,380,925
Wellington Investment
Management 91,442,743 6.02%
83,659,650
Fidelity Investments 90,452,075 5.95%
154,261,320
Michael O’Leary 65,000,016 4.28%
65,000,016
Bank of Ireland Asset
Management Ltd. 61,970,409 4.08%
27,736,521
Chieftain Capital
Management Inc. 54,743,575 3.60%
49,473,500
ARES HELD % OF ISSUED
Corporate governance
Corporate governance is concerned with how companies are directed and controlled and in
particular, with the role of the Board of Directors and the need to ensure a framework of effective
accountability.
Combined code
The directors endorse the 2006 Combined Code on Corporate Governance which sets out
Principles of Good Governance and a code of best practice and which was appended to the Listing
Rules of the Irish and London Stock Exchanges. The directors have reviewed the Group’s governance
arrangements in light of the 2006 Code and believe that they are fully in compliance.
Code principles
Ryanair’s Board is committed to governing the Group in accordance with best practice, and
supports the principles of good governance contained in the Combined Code in relation to:
•
Directors and the Board,
•
Directors’ remuneration,
•
Relations with shareholders, and
•
Accountability and audit.

24
Directors and the Board
At the financial year end the Board of Ryanair comprised 8 non-executive directors and 1 executive
director. Biographies of these directors are set out on pages 31 to 32. Each director has extensive
business experience, which they bring to bear in governing the Group. The Group has a Chairman with
an extensive background in this industry, and significant public company experience. Historically, the
Group has always separated the roles of Chairman and Chief Executive. The Chairman is primarily
responsible for the management of the Board, and the Chief Executive for the running of the business
and implementation of the Board’s strategy and policy.
The Board meets at least on a quarterly basis and in the year to March 31, 2007 the Board met on 4
occasions. Detailed Board papers are circulated in advance so that Board members have adequate time
and information to be able to participate fully at the meeting. The Board’s primary focus is on strategy
formulation, policy and control. The Board also has a schedule of matters reserved for its attention,
including matters such as appointment of senior management, approval of the annual budget, large
capital expenditure, and key strategic decisions. The holding of detailed regular Board meetings and the
fact that many matters require Board approval, indicate that the running of the Group is firmly in the
hands of the Board.
The Board has established a process to annually evaluate the performance of the Board and its
principal Committees. The Board anticipates that the formal evaluation will be completed in the
calendar year. Based on the evaluation process completed, the Board considers that the principal
Committees have performed effectively throughout the year.
Directors’ independence
The Board regards all of the directors as independent and that no one individual or one grouping
exerts an undue influence on others. All directors have access to the advice and services of the Company
Secretary and the Board has established a procedure whereby directors wishing to obtain advice in the
furtherance of their duties may take independent professional advice at the Group’s expense.
The Board has considered Mr. Kyran McLaughlin'
s independence given his role as Deputy
Chairman and Head of Capital Markets at Davy Stockbrokers. Davy Stockbrokers are one of Ryanair'
s
corporate brokers and provide corporate advisory services to Ryanair from time to time. The Board has
considered the fees paid to Davy Stockbrokers for these services and believe that they are immaterial to
both Ryanair and Davy Stockbrokers given the size of each organisation'
s business operations and
financial results. Having considered this relationship, the Board has concluded that Mr. McLaughlin
continues to be an independent non executive director within the spirit and meaning of the Combined
Code Rules.
The Board has also considered the independence of Mr. David Bonderman and Dr. Tony Ryan
given their respective shareholdings in Ryanair Holdings plc. Mr. David Bonderman and Dr. Tony Ryan
have a shareholding in the Company of 14,117,360 ordinary shares and 6,517,070 ordinary shares,
equivalent to 0.91% and 0.42% of the issued share capital, respectively. Having considered their
individual shareholdings in light of the number of issued shares in Ryanair Holdings plc and the
respective financial interests of each of the directors, the Board has concluded that their respective
interests are not so material as to breach the spirit of the independence rule contained in the Combined
Code.

25
The Board has further considered the independence of Mr. David Bonderman, Mr. James Osborne
and Dr. Tony Ryan as they have each served more than 9 years on the Board. The Board considers that
each of these 3 directors is independent as each has other significant commercial and professional
commitments and each brings his own level of senior experience gained in their fields of international
business and professional practice. For these reasons, and also because each director’s independence is
considered annually by the Board, the Board considers it appropriate that these directors have not been
offered for annual re-election as is recommended by the Combined Code.
New Non-executive directors are encouraged to meet the Executive director and senior
management for briefing on the Group’s developments and plans. Directors can only be appointed
following selection by the Nomination Committee and approval by the Board and by the shareholders at
the Annual General Meeting.
Ryanair’s Articles of Association require that all of the directors retire and offer themselves for re-
election within a three-year period. Accordingly Dr. Tony Ryan, Mr. Emmanuel Faber and Mr. Klaus
Kirchberger will be retiring, and being eligible will offer themselves for re-election at the AGM on
September 20, 2007.
In accordance with the recommendations of the Combined Code, Mr. Kyran McLaughlin is
Chairman of the Audit Committee and Mr. James Osborne, the senior non-executive director, is
Chairman of the Remuneration Committee.
Board Committees
The following Committees have been established as subcommittees of the Board:
The Audit Committee
The Audit Committee meets regularly and has clear terms of reference in relation to its authority
and duties. The Committee’s terms of reference are available from the Company Secretary and are
displayed on the Company’s website at www.Ryanair.com. Further information is detailed below under
“Accountability and Audit.”
Its members are Mr. Kyran McLaughlin, Mr. James Osborne and Mr. Emmanuel Faber. The Board
consider that all of the Audit Committee members have relevant financial expertise and that Mr.
Emmanuel Faber is a recognised financial expert.
The Executive Committee
The Executive Committee can exercise the powers exercisable by the full Board of Directors in
specific circumstances delegated by the Board when action by the Board of Directors is required and it
is impracticable to convene a meeting of the full Board of Directors. Its members are Mr. David
Bonderman, Mr. Michael O’Leary and Dr. Tony Ryan.
The Remuneration Committee
The members of the Remuneration Committee are Mr. James Osborne, Mr. Paolo Pietrogrande and
Mr. Klaus Kirchberger. The Remuneration Committee determines the remuneration of senior
executives and administers the Group’s share option plans. The Committee makes recommendations to
the Board on the Group’s policy framework for executive director remuneration in accordance with the
provisions contained in Schedule A to the Combined Code.

26
The Nomination Committee
The members of the Nomination Committee are Mr. David Bonderman, Mr. Michael O’Leary and
Dr. Tony Ryan. The Committee carries out the process of selecting executive and non-executive
directors to the Board and makes proposals to the Board. However, the appointment of directors is a
matter for the Board as a whole.
The Air Safety Committee
The Air Safety Committee comprises of a Board Director, Mr. Michael Horgan, the Chief Pilot, the
Director of Flight and Ground Operations, the Flight Safety Officer, the Director of Engineering,
Director of Personnel and In-flight, Quality Assurance Manager-Maintenance, Deputy Director –
Safety, the Health and Safety Officer and the Chief Engineer. The Air Safety Committee meets
regularly to discuss relevant issues and reports to the Board on a quarterly basis.
The number of Board and Committee meetings held and attended during the year are given below.
Directors’ remuneration
The Chief Executive of the Group is the only executive director on the Board. In addition to his
base salary he is eligible for a performance bonus of up to 50% of salary and other bonuses dependant
upon the achievement of certain financial targets. It is considered that the shareholding of the Chief
Executive acts to align his interests with those of shareholders and gives him a keen incentive to
perform to the highest levels. The report of the Remuneration Committee is contained on page 36.
Relations with shareholders
Ryanair communicates with all of its shareholders following the release of quarterly and annual
results directly via road shows, investor days and/or by conference calls. The Chief Executive, senior
financial, operational, and commercial management participate in these events. During the year ended
March 31, 2007 the Group held discussions with a substantial number of institutional investors.
All shareholders are given adequate notice of the AGM at which the Chairman reviews the results
and comments on current business activity. Financial, operational and other information on the Group is
provided on our website at www.ryanair.com.
Ryanair will continue to propose a separate resolution at the AGM on each substantially separate
issue, including a separate resolution relating to the Directors’ Report and Accounts. In order to comply
with the Combined Code, proxy votes will be announced at the AGM, following each vote on a show of
hands, except in the event of a poll being called. The Board Chairman and the Chairmen of the Audit
and Remuneration Committees are available to answer questions from all shareholders.

27
The number of Board Committee meetings held and attended during the year was as follows:
Board
Audit
Committee
Remuneration
Committee
Air Safety
Committee
David Bonderman
3/4
-
-
-
Michael O’Leary
4/4
-
-
-
Michael Horgan
4/4
-
-
4/4
Kyran McLaughlin
4/4
6/6
-
-
James R. Osborne
4/4
3/6*
2/2
-
Paolo Pietrogrande
3/4
-
1/2
-
T. Anthony Ryan
3/4
-
-
-
Emmanuel Faber
1/4
2/6
-
-
Klaus Kirchberger
3/4
-
1/2
-
There were no Executive or Nomination Committee meetings held during the year.
*James Osborne replaced Ray MacSharry, who retired during the year, on the Audit Committee.
Accountability and audit
The directors have set out their responsibility for the preparation of the financial statements on
page 37. They have also considered the going concern position of the Group and their conclusion is set
out on page 29. The Board has established an Audit Committee whose principal tasks are to consider
financial reporting and internal control issues. The Audit Committee, which consists exclusively of
independent non-executive directors, meets at least quarterly to review the financial statements of the
Group, to consider internal control procedures and to liaise with internal and external auditors. In the
year ended March 31, 2007 the Audit Committee met on 6 occasions. On a semi annual basis the audit
Committee receives an extensive report from the internal auditor detailing the reviews performed in the
year, and a risk assessment of the Group. This report is used by the Committee and the Board, as a basis
for determining the effectiveness of internal control. The Audit Committee regularly considers the
performance of internal audit and how best financial reporting and internal control principles should be
applied.
In addition, the Audit Committee has responsibility for appointing, setting compensation and
overseeing the work of the independent auditor. The Audit Committee pre-approves all audit and
permissible non-audit services provided by the independent auditor.

28
Internal control
The directors acknowledge their responsibility for the system of internal control which is designed
to manage rather than eliminate the risk of failure to achieve business objectives, and can provide only
reasonable and not absolute assurance against material mis-statement or loss. In accordance with the
provisions of the Combined Code the Directors review the effectiveness of the Group’s system of
internal control including:
•
Financial
•
Operational
•
Compliance
•
Risk
•
Management
The Board is ultimately responsible for the Group’s system of internal controls and for monitoring
its effectiveness. The key procedures that have been established to provide effective internal control
include:
• a strong and independent Board which meets at least 4 times a year and has separate Chief
Executive and Chairman roles;
• a clearly defined organisational structure along functional lines and a clear division of
responsibility and authority in the Group;
•
a comprehensive system of internal financial reporting which includes preparation of detailed
monthly management accounts, providing key performance indicators and financial results for each
major function within the Group;
•
quarterly reporting of the financial performance with a management discussion and analysis of
results;
•
weekly Management Committee meetings, comprising of heads of departments, to review the
performance and activities of each department in the Group;
•
detailed budgetary process which includes identifying risks and opportunities and which is
ultimately approved at Board level;
•
Board approved capital expenditure and treasury policies which clearly define authorisation limits
and procedures;
•
an internal audit function which reviews key financial/business processes and controls, and which
has full and unrestricted access to the Audit Committee;
•
an Audit Committee which approves audit plans, considers significant control matters raised by
management and the internal and external auditors and which is actively monitoring the Group’s
compliance with section 404 of the Sarbanes Oxley Act of 2002;
•
established systems and procedures to identify, control and report on key risks. Exposure to these
risks is monitored by the Audit Committee and the Management Committee; and
•
a risk management programme in place throughout the Group whereby executive management
reviews and monitors the controls in place, both financial and non financial, to manage the risks facing
the business.
On behalf of the Board, the Audit Committee has reviewed the effectiveness of the Group’s system
of internal control for the year ended March 31, 2007 and has reported thereon to the Board.

29
The Board has delegated to executive management the planning and implementation of the systems
of internal control within an established framework which applies throughout the Group.
Code of business conduct
Ryanair’s standards of integrity and ethical values have been established and are documented in
Ryanair’s Code of Business Conduct. This code is applicable to all Ryanair employees. There are
established channels for reporting code violations or other concerns in a confidential manner. The
internal auditor investigates any instances and reports findings directly to the Audit Committee.
Going concern
After making enquiries the directors consider that the Group has adequate resources to continue
operating for the foreseeable future. For this reason, they have continued to adopt the going concern
basis in preparing the financial statements.
Statement of compliance
The Irish Stock exchange and UK Listing Authority require listed companies to disclose, in relation
to section 1 of the 2006 Combined code, how they have applied its provisions throughout the year. The
Company had fully complied with the provisions set out in Section 1 of the 2006 Combined code
throughout the year.
Subsidiary companies
Details of the principal subsidiary undertakings are disclosed in note 27 of the financial statements.
Directors and their interests
A list of the directors who held office in the period is set out on page 87. One third (rounded up to
the next whole number if it is a fractional number) of the directors (being the directors who have been
longest in office) will retire by rotation and be eligible for re-election at every Annual General Meeting.
The directors who held office at March 31, 2007 had no interests other than those outlined in note 20 to
the financial statements in the shares of the Company or Group companies.
Dividend policy
Due to the capital intensive nature of the business and the Group’s projected growth, the directors
do not intend to recommend the payment of any dividend.
Political contributions
During the financial years ended March 31, 2007 and 2006 the Group made no political
contributions which require disclosure under the Electoral Act, 1997.

30
Share Split
On February 26, 2007 the Company implemented a sub-division of the Company’s ordinary shares
of 1.27 cent into ordinary shares of 0.635 cent (the “stock split”). Both the share capital and earnings
per share figures have been restated to give effect to the stock split.
Post balance sheet events
A share buy back which was approved at the 2006 AGM was formally announced on June 5, 2007.
With effect from June 7, 2007 the Company planned to repurchase up to 300m worth of shares. The
buy back can take place at anytime up to September 20, 2007 for a total maximum of 77,171,868 shares.
To date the Company had repurchased 37.6 million shares at a total cost of 187m.
Since the year end the Company has entered into sale agreements for the disposal of 20 Boeing
737-800 aircraft in the period September 2006 to April 2010.
Ryanair is in the process of preparing an appeal to the European Court of First Instance against a
decision by the European Commission prohibiting its proposed acquisition of Aer Lingus, following the
initial public offering of the Irish flag carrier airline. Subsequent to the year end, Ryanair increased its
stake in Aer Lingus plc by a further 4.2%, taking its shareholding from 25.2% at March 31, 2007 to over
29.4% at August 21, 2007, at a total cost of 392m which amounted to an average cost of 2.52 per
share. Ryanair offered remedies to the Commission in the first phase of the Commission’s merger
investigation, something that has not been done in other previous airline mergers, including Air
France/KLM. Despite demonstrating that the merger of these two airlines would have significant
consumer benefits and efficiencies, and despite offering substantial remedies – including guaranteed
fare and fuel levy reductions/eliminations, and large numbers of slot surrenders – the Commission
nevertheless prohibited the merger in June 2007. Ryanair has two months from the date of decision to
submit an appeal.
In April 2007 the Group exercised 27 options under the 2005 contract with the Boeing Company
whereby it will increase its “firm” aircraft deliveries by this amount during fiscal 2010.
Auditors
In accordance with Section 160(2) of the Companies Act 1963, the auditors KPMG, Chartered
Accountants, will continue in office.
Annual General Meeting
The Annual General Meeting will be held on September 20, 2007 at 10am in the Radisson Hotel,
Dublin Airport, Co. Dublin, Ireland.
On behalf of the Board
D. Bonderman M. O’ Leary
Chairman Chief Executive
August 21, 2007

31
Directors*
David Bonderman (Chairman-USA)
A director of Ryanair Holdings plc since August 1996 and Chairman of the Board since December
1996. He also serves on the Board of the following public companies: CoStar Group, Inc.; Gemalto
S.A.; and Burger King Holdings Inc. and serves as a principal and general partner of Texas Pacific
Group.
Michael O’Leary (Chief Executive)
A director of Ryanair Ltd. since 1988 and a director of Ryanair Holdings plc since July 1996. Mr.
O’Leary was appointed Chief Executive of Ryanair on January 1, 1994.
Michael Horgan (Director)
Michael Horgan has served as a director of Ryanair Holdings plc since January 12, 2001. A former
Chief Pilot of Aer Lingus, he sometimes acts as a consultant to a number of international airlines, civil
aviation authorities, the European Commission and the European Bank for Reconstruction and
Development. Mr. Horgan is the Chairman of the Air Safety Committee of the Board.
Kyran McLaughlin (Director)
A director of Ryanair Holdings plc since January 2001, and is Deputy Chairman and Head of
Capital Markets at Davy Stockbrokers. Mr. McLaughlin also advised Ryanair during its initial flotation
on the Dublin and NASDAQ stock markets in 1997. He is also a Chairman of Elan Corporation plc, and
he serves as a director of a number of Irish private companies.
James R. Osborne (Director)
A director of Ryanair Holdings plc since August 1996, and has been a director of Ryanair Ltd.
since April 1995. Mr. Osborne is a former managing partner of A & L Goodbody Solicitors. He also
serves as a director of a number of Irish private companies.
Paolo Pietrogrande (Director-Italy)
Paolo Pietrogrande has served as a director of Ryanair since 2001. Mr. Pietrogrande is currently
Chairman of Atmos Holding SpA, President, Netplan Management Consulting, LLC and also director of
the Executive MBA program at Alma Graduate School, University of Bologna. Mr. Pietrogrande'
s past
positions include CEO of Enel Green Power S.p.A. (power generation in Italy, North and Latin
America), CEO of Nuovi Cantieri Apuania (shipbuilding), Business Development Director at General
Electric Power Systems, Europe+, Manager at Bain and Company and Vice President of Marketing at
Kinetics Technology International B.V.

32
T. Anthony Ryan (Director)
Dr. Ryan has been a director of Ryanair Ltd. since April 1995. Dr. Ryan in 1996 served as
Chairman of the Board of Ryanair Ltd. and has been a director of Ryanair Holdings plc since 1996. Dr.
Ryan served as chairman of GPA Group plc from 1983 to 1996.
Emmanuel Faber (Director-France)
A director of Ryanair Holdings plc since September 2002 and is Executive Vice President Asia-
Pacific for Group Danone. He also serves as a director of a number of French public companies.
Klaus Kirchberger (Director-Germany)
A director of Ryanair Holdings plc since September 2002 and is also the Chief Executive Officer
of Bayerische Bau und Immobilien GmbH & Co. KG. He also serves as a director of a number of
German listed corporations.
*Directors are of Irish nationality unless otherwise indicated.

33
Social, Environmental and Ethical Report
Social
The Group’s aim is that employees understand the Group’s strategy and are committed to Ryanair.
The motivation and commitment of our people is key to our performance. The Group’s policy is that
training, career development and promotion opportunities will be available to all people. The Group
remains committed to being an equal opportunities employer regardless of nationality, race, gender,
marital status, disability, age and religious or political belief. The Group selects personnel on the basis
of merit and capability, providing the most effective use of resources. During the year 745 of our people
were promoted internally within the Group.
The Group recognises the importance of effective communication with its people. Our staff
newsletter “The Limited Release” is distributed to all staff ensuring that employees are kept up to-date
on the plans, issues and challenges facing our industry, and daily news bulletins are also issued on our
internal TV network. Our Employee Representative Committee (“ERC’s”) for each department and our
European Works Council provide a forum which ensure all elected department representatives can
consult on current issues. Our IT department has developed an Intranet site which gives added value to
our communication network.
The Group has launched a number of employee share option schemes. The Group also obtained
Revenue approval on July 4, 2003 for the 2003 Group scheme under which the first tranche of shares
will become exercisable in 2008.
All staff benefit from extensive travel concessions in Ryanair and discounted travel with other
carriers.
Environmental
Ryanair’s steady growth is being achieved in the most environmentally sustainable way through
investing in the latest aircraft and engine technologies and adopting the most efficient operational and
commercial measures that help to minimise the airline’s impact on the environment. Ryanair is currently
the industry leader in terms of environmental efficiency and is constantly working towards further
improving its performance.
Technology
Ryanair’s fleet expansion programme continues. As at December 2005 all of Ryanairs older
Boeing 737-200 aircraft were replaced with Boeing 737-800 “Next Generation” aircraft and Ryanair
currently operates a single aircraft type fleet of 137 aircraft with an average age of just under 2.7 years.
Ryanair has a further 171 aircraft of this type on order from Boeing and options on another 110. The
Boeing 737-800 has 59 more seats than the Boeing 737-200 and, hence, has significantly lower fuel
burn and emissions per seat. The design of the new aircraft is aimed at minimising drag, thereby further
reducing fuel burn and noise levels. Ryanair has also installed winglets on all of its existing aircraft and
all future aircraft will also be fitted with winglets. The installation of winglets to Ryanair’s Boeing 737-
800 “Next Generation” aircraft has reduced fuel burn and CO
2
emissions by a further 2-4% and also
further reduced noise emissions.

34
Operational and commercial characteristics
Ryanair has distinctive operational and commercial characteristics which further reduce the impact
of its operations on the environment:
- Efficient seat density (189-seat, all economy configuration on a Ryanair aircraft as opposed to
162 seat, two-class configuration of the Boeing 737-800 “Next Generation” aircraft used by traditional
network airlines- reducing fuel burn and emissions per seat kilometre flown);
- High load factors (reducing fuel burn and emissions per passenger kilometre flown);
- Use of under-utilised secondary and regional airports (limited use of holding patterns and short
taxiing times reducing fuel burn and emissions; better utilisation of existing infrastructure thereby
reducing the need for new airport infrastructure);
- Direct services as opposed to connecting flights (no need for passengers to transfer at main hubs-
reducing the number of take-offs and landings per journey from 2 to 1, i.e. reducing fuel burn and
emissions per journey);
- No late night departures of aircraft (reducing noise level emissions).
Emissions trading
Ryanair proves that air transport can be environmentally friendly whilst continuing to deliver huge
economic benefits in terms of the lowest cost air travel for consumers, increased tourism, regional and
social cohesion, job creation, inward investment, etc. In terms of the environment air transport only
accounts for less than 2% of total EU CO
2
emissions compared to road transport which accounts for 9
times more and household emissions for 6 times more CO
2
emissions than aviation. Nevertheless, the
European Commission is pushing to include air transport in the European Union Emissions Trading
Scheme (ETS), instead of focusing on the real and larger sources of CO
2
emissions. The European
Parliament and the Council are currently considering the Commission’s proposals in this respect.
The effect of the ETS is likely to impose an “emissions levy” on airlines, particularly those that
have already heavily invested in cleaner aircraft technology and already engage in efficient operations
as they will have no further headroom to reduce emissions. We believe that this additional cost burden
on airlines will increase fares and damage the competitiveness of the industry (see below).
Ryanair and the Low Fares Airline Association (ELFAA) have called on the European Commission
to conduct a proper cost/benefit analysis before proceeding with any legislative proposals that could
seriously damage the industry. A report recently issued by Ernst & Young and York Aviation estimated
that the cost to aviation of being included in ETS could amount to over 4 billion per annum and result
in 42,000 job losses. As noted above, Ryanair takes its environmental responsibilities very seriously
and will continue to improve its efficiency and minimise emissions. We believe that the introduction of
ETS would not affect this and will only punish the more efficient producers and lead to increased costs
for ordinary consumers.
Fuel tax/emissions levy
Ryanair is fundamentally opposed to the introduction of any fuel tax or emissions levy. Ryanair
continues to offer the lowest fares in Europe making air travel affordable to ordinary European
consumers. Ryanair believes that the imposition of a tax on fuel or emissions will not only increase
airfares but will most likely discourage new entrants into the market resulting in less choice for
consumers. This will have adverse effects on the European economy generally.

35
As a company we believe in free market competition and believe that the imposition of any of the
above measures would enable the traditional flag carriers (who have smaller and older aircraft, lower
load factors, a much higher fuel burn per passenger, and who operate primarily into inefficient
congested airports) to achieve their objectives of reducing competition. Furthermore the introduction of
a fuel tax or emissions levy only at the European level would distort competition between airlines
operating solely within Europe and those also operating outside long haul flights. We believe that the
introduction of such a tax/levy would also be incompatible with international law.
Aircraft noise regulations
Ryanair is the European leader in minimising noise nuisance through the use of newer, quieter
aircraft (all Ryanair aircraft fully comply with current noise requirements). The use of winglets further
reduces noise nuisance by 6.5%, as do other operational measures adopted by Ryanair (absence of night
operations etc.) Certain airports in the U.K. (including London Stansted and London Gatwick) and
continental Europe have established local noise restrictions, including limits on the number of hourly or
daily operations or the time of such operations and Ryanair fully complies with the restrictions.
Group facilities
Environmental controls are generally imposed under Irish law through property planning
legislation specifically the Local Government (Planning and Development) Acts of 1963 to 1999, the
Planning and Development Act 2000 and regulations made thereunder. At Dublin Airport, Ryanair
operates on land controlled by the Dublin Airport Authority (DAA). Planning permission for Ryanair’s
facilities was granted in accordance with both the zoning, and planning requirements of Dublin Airport.
There is also specific Irish environmental legislation implementing applicable EU Directives and
Regulations, which Ryanair adheres to.
From time to time, noxious or potentially toxic substances are held on a temporary basis within
Ryanair’s engineering facilities at Dublin airport and Glasgow Prestwick. However, at all times
Ryanair’s storage and handling of these substances complies with the relevant regulatory requirements.
In our Glasgow Prestwick maintenance facility all normal waste is removed under the Environmental
Protection Act of 1996 and Duty of Care Waste Regulations. For special waste removal, Ryanair
operates under the special Waste Regulations 1998 (contaminated waste). At all other facilities Ryanair
adheres to all local and EU regulations.
Code of business conduct and ethics
In January 2004 the Board of Ryanair adopted a Code of Business Conduct and Ethics. The code
sets out the business principles to be adopted by the Group and its employees. In addition to the Code of
Business Conduct and Ethics the employees are also bound by the business principles contained in their
terms and conditions of employment.
The management of the Company are responsible to the Board for ensuring adherence to the
code. The code is renewed annually and any amendments to the code must be approved by the Audit
Committee on behalf of the Board.
The code governs all aspects of the way the Company conducts its business including, matters
relating to conduct in the work environment, business activities, conflicts of interest and compliance with
laws and regulations. The code also provides for confidential reporting, procedures for employees and all
employees must comply with the code.

36
Report of the Remuneration Committee to the Board
25
ANNUAL REPORT & F INANCIAL STATE MENTS 2006
In forming the Group’s remuneration policy, the Board has complied with the
Combined Code
ANNUAL REPORT & F INANCIAL STATE MENTS 2006
The Remuneration Committee
The Remuneration Committee comprises Mr. James R. Osborne, Mr. Paolo Pietrogrande and Mr.
Klaus Kirchberger, all of whom are non-executive directors. The Committee determines the
remuneration of senior executives of Ryanair and administers the Group’s stock option plans. The
Board determines the remuneration and bonuses of the Chief Executive who is the only Executive
Director.
Remuneration policy
The Group’s policy on senior executive remuneration is to reward its executives competitively,
having regard to the comparative marketplace in Ireland and the United Kingdom, in order to ensure
that they are properly motivated to perform in the best interests of the shareholders.
Non-executive directors
Non-executive directors are remunerated by way of directors’ fees and share options. While the
Combined Code notes that the remuneration of the non-executive director should not include share
options the Board believes that the quantum of options granted to non-executive directors are not so
significant as to raise any issue concerning their independence. Mr. Michael Horgan is remunerated on a
consultancy basis on safety issues and by share options. Full details are disclosed in note 20(b) and
20(d) on pages 70 and 71 of the financial statements.
Executive director remuneration
The elements of the remuneration package for the executive director are basic salary, performance
bonus and other bonuses dependent upon the achievement of certain financial targets and pension. Full
details of the executive director’s remuneration are set out in note 20(a) on page 70 of the financial
statements.
Executive director’s service contract
Ryanair entered into a new employment agreement with the only executive director of the Board,
Mr. Michael O’Leary on July 1, 2002 for a one year period to June 30, 2003. Thereafter, the agreement
will continue in full but may be terminated with 12 months notice by either party. Mr. O’Leary’s
employment agreement does not contain provisions providing for compensation on its termination.

37
Statement of Directors’ Responsibilities in respect of the Annual
Report and the Financial Statements
Company law requires the directors to prepare Group and Company financial statements for each
financial year. Under Company law, the directors are required to prepare the Group financial statements in
accordance with IFRSs as adopted by the EU and have elected to prepare the Company financial statements
in accordance with IFRSs as adopted by the EU, as applied in accordance with the provisions of the
Companies Acts 1963 to 2006.
The financial statements are required by law and IFRSs as adopted by the EU to present fairly the
financial position of the Company and the Group and the performance of the Group. The Companies Acts
1963 to 2006 provide in relation to financial statements that references in the relevant part of these Acts to
financial statements giving a true and fair view are references to their achieving a fair presentation.
In preparing each of the Group and Company financial statements, the directors are required to:
• Select suitable accounting policies and then apply them consistently;
• Make judgements and estimates that are reasonable and prudent; and
• Prepare the financial statements on the going concern basis unless it is inappropriate to presume that
the Group and the Company will continue business.
The directors are responsible for keeping proper books of account that disclose with reasonable
accuracy at any time the financial position of the Company and enable them to ensure that its financial
statements comply with the Companies Acts 1963 to 2006. They are responsible for taking such steps as are
reasonably open to them to safeguard the assets of the Group and to prevent and detect fraud and other
irregularities.
Under Company law and the requirements of the Listing Rules issued by the Irish Stock Exchange,
the directors are also responsible for preparing a Directors’ Report and reports relating to directors’
remuneration and corporate governance that comply with that law and those Rules.
The directors are responsible for the maintenance of integrity of the corporate and financial
information included on the Group’s website. Legislation in the Republic of Ireland governing the
preparation and dissemination of financial statements may differ from legislation in other jurisdictions.
On behalf of the board
D. Bonderman M. O’Leary
Chairman Chief Executive

38
Independent Auditors’ Report to the Members of Ryanair Holdings
plc
We have audited the Group and company financial statements of Ryanair Holdings plc for the year
ended March 31, 2007 which comprise the Consolidated Income Statement, the Consolidated and Company
Balance Sheets, the Consolidated and Company Cash Flow Statements, the Consolidated and Company
Statements of Recognised Income and Expense and the related notes. These financial statements have been
prepared under the accounting policies set out therein.
This report is made solely to the Company’s members, as a body, in accordance with Section 193 of
the Companies Act, 1990. Our audit work has been undertaken so that we might state to the Company’s
members those matters we are required to state to them in an auditor’s report and for no other purpose. To
the fullest extent permitted by law, we do not accept or assume responsibility to anyone other than the
Company and the Company’s members as a body, for our audit work, for this report, or for the opinions we
have formed.
Respective Responsibilities of Directors and Auditors
The directors’ responsibilities for preparing the Annual Report and the financial statements in
accordance with applicable law and International Financial Reporting Standards (IFRSs) as adopted by the
EU are set out in the Statement of Directors Responsibilities on page 37.
Our responsibility is to audit the financial statements in accordance with relevant legal and regulatory
requirements and International Standards on Auditing (United Kingdom and Ireland).
We report to you our opinion as to: whether the financial statements give a true and fair view in
accordance with IFRSs as adopted by the EU, and in the case of the Company as applied in accordance with
the provisions of the Companies Acts 1963 to 2006, and have been properly prepared in accordance with
the Companies Acts 1963 to 2006 and Article 4 of the IAS Regulation.
We also report to you, in our opinion as to whether; proper books of account have been kept by the
Company; whether at the balance sheet date there exists a financial situation requiring the convening of an
extraordinary general meeting of the Company under section 40(1) of the Companies (Amendment) Act
1983; and whether the information given in the Directors’ Report is consistent with the financial statements.
In addition we state whether we have obtained all the information and explanations necessary for the
purposes of our audit, and whether the Company balance sheet is in agreement with the books of account.
We also report to you if, in our opinion, any information specified by law or the Listing Rules of the
Irish Stock Exchange regarding directors’ remuneration and transactions is not disclosed and where
practicable, include such information in our report.

39
We review whether the corporate governance statement reflects the Company’s compliance with the
nine provisions of the 2006 Combined Code specified for our review by the Listing Rules of the Irish Stock
Exchange, and we report if it does not. We are not required to consider whether the Board’s statements on
internal control cover all risks and controls, or form an opinion on the effectiveness of the Group’s
corporate governance procedures or its risk and control procedures.
We read the other information contained in the Annual Report, and consider whether it is consistent
with the audited financial statements. The other information comprises only the Chairman’s and Chief
Executive’s report, the Operating and Financial review, the Directors’ Report, the Social, Environmental
and Ethical report and the Report of the Remuneration Committee. We consider the implications for our
report if we become aware of any apparent misstatements or material inconsistencies with the financial
statements. Our responsibilities do not extend to any other information.
Basis of Audit Opinion
We conducted our audit in accordance with International Standards on Accounting (United Kingdom
and Ireland) issued by the Auditing Practices Board. An audit includes examination, on a test basis, of
evidence relevant to the amounts and disclosures in the financial statements. It also includes an assessment
of the significant estimates and judgements made by the directors in the preparation of the financial
statements, and of whether the accounting policies are appropriate to the Group’s and company’s
circumstances, consistently applied and adequately disclosed.
We planned and performed our audit so as to obtain all the information and explanations which we
considered necessary in order to provide us with sufficient evidence to give reasonable assurance that the
financial statements are free from material misstatement whether caused by fraud or other irregularity or
error. In forming our opinion we also evaluated the overall adequacy of the presentation of information in
the financial statements.
Opinion
In our opinion:
• The Group financial statements give a true and fair view, in accordance with IFRSs as adopted by the
EU, of the state of affairs of the Group as at March 31, 2007 and of its profit for the year then ended;
• The Company financial statements give a true and fair view, in accordance with IFRSs as adopted by
the EU, as applied in accordance with the provisions of the Companies Acts, 1963 to 2006 of the state
of the Company’s affairs as at March 31, 2007; and
• The financial statements have been properly prepared in accordance with the Companies Acts, 1963
to 2006 and Article 4 of the IAS Regulation.
We have obtained all the information and explanations which we considered necessary for the
purposes of our audit. In our opinion, proper books of account have been kept by the Company. The
company balance sheet is in agreement with the books of account.

40
In our opinion, the information given in the Directors’ report is consistent with the financial
statements.
The net assets of the Company as stated in the Company balance sheet on page 81 are more than half
of the amount of its called up share capital, and, in our opinion, on that basis, there did not exist at March
31, 2007, a financial situation which, under Section 40(1) of the Companies (Amendment) Act 1983, would
require the convening of an extraordinary general meeting of the Company.
Chartered Accountants
Registered Auditor, Dublin, Ireland,
August 21, 2007

41
Consolidated Balance Sheet
At March 31,
2007
At March 31,
2006
Note
000
000
Non-current assets
Property, plant and equipment .......................................................................
2
2,884,053
2,532,988
Intangible assets.............................................................................................
3
46,841
46,841
Available for sale financial assets..................................................................
4
406,075
-
Derivative financial instruments ....................................................................
5
-
763
Total non-current assets..................................................................................
3,336,969
2,580,592
Current assets
Inventories ....................................................................................................
6
2,420
3,422
Other assets ...................................................................................................
7
77,707
29,453
Trade receivables ...........................................................................................
8
23,412
29,909
Derivative financial instruments ....................................................................
5
52,736
18,872
Restricted cash...............................................................................................
9
258,808
204,040
Financial assets: cash > 3 months ..................................................................
592,774
328,927
Cash and cash equivalents .............................................................................
1,346,419
1,439,004
Total current assets .........................................................................................
2,354,276
2,053,627
Total assets .......................................................................................................
5,691,245
4,634,219
Current liabilities
Trade payables...............................................................................................
54,801
79,283
Accrued expenses and other liabilities...........................................................
10
807,136
570,614
Current maturities of debt..............................................................................
11
178,918
153,311
Derivative financial instruments ....................................................................
5
56,053
27,417
Current tax.....................................................................................................
12
20,822
15,247
Total current liabilities....................................................................................
1,117,730
845,872
Non-current liabilities
Provisions ......................................................................................................
13
28,719
16,722
Derivative financial instruments ....................................................................
5
58,666
81,897
Deferred income tax liability .........................................................................
12
151,032
127,260
Other creditors ...............................................................................................
14
112,177
46,066
Non current maturities of debt .......................................................................
11
1,683,148
1,524,417
Total non-current liabilities ............................................................................
2,033,742
1,796,362
Shareholders’ equity
Issued share capital........................................................................................
15
9,822
9,790
Share premium account .................................................................................
15
607,433
596,231
Retained earnings ..........................................................................................
16
1,905,211
1,467,623
Other reserves ................................................................................................
16
17,307
(81,659)
Shareholders’ equity........................................................................................
2,539,773
1,991,985
Total liabilities and shareholders’ equity.......................................................
5,691,245
4,634,219
The accompanying notes are an integral part of the financial information.
On behalf of the Board
M. O’Leary D. Bonderman
Director Director
August 21, 2007

42
Consolidated Income Statement
Year ended
March 31, 2007
Year ended
March 31, 2006
Note
000
000
Operating revenues
Scheduled revenues .......................................................................................
1,874,791
1,433,377
Ancillary revenues.........................................................................................
17
362,104
259,153
Total operating revenues—continuing operations ........................................
17
2,236,895
1,692,530
Operating expenses
Staff costs ......................................................................................................
18
(226,580)
(171,412)
Depreciation ..................................................................................................
2
(143,503)
(124,405)
Fuel & oil.......................................................................................................
(693,331)
(462,466)
Maintenance, materials & repairs ..................................................................
(42,046)
(37,417)
Marketing & distribution costs ......................................................................
(23,795)
(13,912)
Aircraft rentals...............................................................................................
(58,183)
(47,376)
Route charges ................................................................................................
(199,240)
(164,577)
Airport & handling charges ...........................................................................
(273,613)
(216,301)
Other..............................................................................................................
19
(104,859)
(79,618)
Total operating expenses.................................................................................
(1,765,150)
(1,317,484)
Operating profit – continuing operations ......................................................
471,745
375,046
Other income/(expenses)
Finance income..............................................................................................
62,983
38,219
Finance expense.............................................................................................
21
(82,876)
(73,958)
Foreign exchange (losses)..............................................................................
(906)
(1,234)
Gain on disposal of property, plant and equipment .......................................
91
815
Total other income/(expenses) ........................................................................
(20,708)
(36,158)
Profit before tax ...............................................................................................
451,037
338,888
Tax on profit on ordinary activities ...............................................................
12
(15,437)
(32,176)
Profit for the year –all attributable to equity holders of parent ..................
435,600
306,712
Basic earnings per ordinary share euro cent ..................................................
23
28.20
20.00
Diluted earnings per ordinary share euro cent ...............................................
23
27.97
19.87
Number of ordinary shares (in 000’s)............................................................
23
1,544,457
1,533,666
Number of diluted shares (in 000’s) ..............................................................
23
1,557,503
1,543,562
The accompanying notes are an integral part of the financial information.
On behalf of the board
M. O’Leary D. Bonderman
Director Director
August 21, 2007

43
Consolidated Cash Flow Statement
Year ended
March 31,
2007
Year ended
March 31,
2006
000
000
Operating activities
Profit before tax..............................................................................................
451,037
338,888
Adjustments to reconcile profits before tax
to net cash provided by operating activities
Depreciation ...................................................................................................
143,503
124,405
Decrease/(increase) in inventories .................................................................. 1,002
(962)
Decrease/(increase) in trade receivables .........................................................
6,497
(9,265)
(Increase) in other current assets ....................................................................
(30,849)
(882)
(Decrease) in trade payables ...........................................................................
(24,482)
(12,835)
Increase in accrued expenses ..........................................................................
233,839
150,083
Increase in other creditors...............................................................................
75,351
11,403
Increase in maintenance provisions ................................................................
11,997
9,486
(Gain) on disposal of property, plant and equipment......................................
(91)
(815)
Decrease/(increase) in interest receivable.......................................................
48
(3,959)
Decrease in interest payable ...........................................................................
2,671
1,159
Retirement costs .............................................................................................
589
507
Share based payments.....................................................................................
3,935
2,921
Income tax ......................................................................................................
(5,194)
436
Net cash provided by operating activities ...................................................
869,853
610,570
Investing activities
Capital expenditure (purchase of property, plant and equipment) …………..
(494,972)
(546,225)
Proceeds from sale of property, plant and equipment.....................................
495
8,460
Purchase of equities classified as available for sale………………………….
(344,917)
-
Investment in restricted cash ..........................................................................
(54,768)
-
(Investment)/reduction in financial assets: cash > 3 months...........................
(263,847)
200,480
Net cash used in investing activities ............................................................
(1,158,009)
(337,285)
Financing activities
Net proceeds from shares issued.....................................................................
11,233
30,590
Proceeds from long term borrowings..............................................................
339,409
386,809
Repayments of long term borrowings.............................................................
(155,071)
(123,938)
Net cash provided by financing activities ...................................................
195,571
293,461
(Decrease)/increase in cash and cash equivalents ......................................
(92,585)
566,746
Cash and cash equivalents at beginning of year..............................................
1,439,004
872,258
Cash and cash equivalents at end of year ..................................................
1,346,419
1,439,004
The accompanying notes are an integral part of the financial information.

44
Consolidated Statement of Recognised Income and Expense
Company only financial statements have been included on pages 81 to 86.
Year ended
March 31,
2007
Year ended
March 31,
2006
000
000
Net actuarial gains from retirement benefit plans .............................................................
1,988
2,327
Cash flow hedge reserve-effective portion of fair value changes to derivatives
Effective portion of changes in fair value of cash flow hedges ........................................
79,025
65,966
Net change in fair value of cash flow hedges transferred to profit and loss .....................
(32,920)
(22,960)
Net movements into cash flow hedge reserve ................................................................
46,105
43,006
Net increase in fair value of available for sale asset ..........................................................
48,926
-
Income and expenditure recognised directly in equity ......................................................
97,019
45,333
Profit for the year ..............................................................................................................
435,600
306,712
Total recognised income and expense ............................................................................
532,619
352,045

45
Notes forming part of the Financial Information
Notes 1 to 27 deal with our consolidated financial statements only. Notes 28 to 34 deal with the
Company financial statements. Note 35 deals with both the Company and Group financial statements.
1 Basis of preparation and significant accounting policies - consolidated financial statements only
Business activity
Ryanair Limited and subsidiaries (Ryanair Limited) has operated as an international airline since it
commenced operations in 1985. On August 23, 1996, Ryanair Holdings Limited, a newly formed holding
Company, acquired the entire issued share capital of Ryanair Limited. On May 16, 1997, Ryanair Holdings
Limited re-registered as a public limited Company, Ryanair Holdings plc (the Company). Ryanair Holdings
plc and subsidiaries are hereafter referred to as “Ryanair Holdings plc” (“we”, “our”, “us”, “Ryanair” or
“the Company”) and currently operates a low fares airline headquartered in Dublin, Ireland. All trading
activity continues to be undertaken by the group of companies headed by Ryanair Limited. These financial
statements have been prepared in accordance with International Financial Reporting Standards (IFRSs) as
adopted by the European Union (EU) as more particularly detailed below. The following accounting
policies have been applied consistently to all periods presented except as otherwise set out below. For a
discussion of our critical accounting policies please refer to page 20 of the Operating and Financial Review.
Basis of preparation
The consolidated financial statements have been prepared in accordance with International Financial
Reporting Standards (IFRSs) as adopted by the European Union (EU) that are effective for the year ended
and as at March 31, 2007. IFRSs as adopted by the EU differs in certain respects from IFRS as issued by
the International Accounting Standards Board (“IASB”). However, none of these differences are relevant
in the context of Ryanair and the consolidated financial statements for the periods presented would be no
different had IFRS as issued by the IASB been applied. Ryanair’s financial statements are prepared in
accordance with IFRS as issued by the IASB accordingly.
These consolidated financial statements are presented in euro rounded to the nearest thousand, being
the functional currency of the Parent entity and the majority of the group companies. They are prepared on
the historical cost basis, except for derivative financial instruments and available for sale securities which
are stated at fair value, and share based payments which are based on fair value determined as at the grant
date of the relevant share options. Any non-current assets classified as held for sale are stated at the lower
of cost and fair value less costs to sell.
The preparation of financial statements requires management to make judgements, estimates and
assumptions that affect the application of policies and reported amounts of assets and liabilities, income and
expenses. These estimates and associated assumptions are based on historical experience and various other
factors believed to be reasonable under the circumstances, the results of which form the basis of making the
judgements about carrying values of assets and liabilities that are not readily apparent from other sources.
Actual results could differ materially from these estimates. These underlying assumptions are reviewed on
an ongoing basis. Revisions to accounting estimates are recognised in the period in which the estimate is
revised if the revision affects only that period, or in the period of the revision and future periods if these are
also affected. Principal sources of estimation uncertainty have been set out in the critical accounting policy
section on page 20 of the Operating and Financial Review.

46
Statement of compliance
The consolidated financial statements have been prepared in accordance with IFRSs as adopted by the
EU and were effective for the year ended and as at March 31, 2007 further to the IAS Regulation (EC
1606/2002).
The IFRSs as adopted by the EU and applied by us in the preparation of these financial statements are
those that were effective for the year ended and as at March 31, 2007. The following provides a brief
outline of the likely impact on future financial statements of relevant IFRSs adopted by the EU which are
not yet effective and have not been early adopted in these financial statements:
•
Amendment to IAS 1 – Capital Disclosures (effective for annual periods beginning on or after January 1,
2007): this amendment will require additional disclosure about our capital structure;
•
IFRS 7 – Financial Instruments: Disclosures (effective for annual periods beginning on or after January 1,
2007). This will require the Company to make further disclosures relating to our financial instruments
than are currently required under IAS 32.
•
IFRIC 9 – Reassessment of Embedded Derivatives (effective for annual periods beginning on or after
June 1, 2006) deals with the requirement of an entity to re-assess embedded derivatives during the life of
the underlying contract. This interpretation is not expected to have any material effect on the Company’s
future financial statements.
•
IFRIC 10 – Interim Financial Reporting and Impairment (effective for annual periods beginning on or
after November 1, 2006). This provides certain guidance to entities in accounting for impairments within
interim period financial statements. This is not expected to have any material impact on the Company’s
financial statements when adopted.
•
IFRIC 11 – IFRS 2 Group and Treasury Share Transactions (effective for annual periods beginning on or
after March 1, 2007) addresses how share based payment arrangements that affect more than one
company in a Group are accounted for in each company’s financial statements. This is not expected to
result in any material change in the way that share based payment transactions are accounted for by the
Group.
Basis of consolidation
The consolidated financial statements comprise the financial statements of Ryanair Holdings plc and
its subsidiary undertakings as of March 31, 2007. Subsidiaries are entities controlled by us. Control exists
when we have the power either directly or indirectly to govern the financial and operating policies of the
entity so as to obtain benefit from its activities.
All intercompany account balances have been eliminated in preparing the consolidated financial
statements.
The results of subsidiary undertakings acquired or disposed of in the period are included in the
consolidated income statement from the date of acquisition or up to the date of disposal. Upon the
acquisition of a business, fair values are attributed to the separable net assets acquired.

47
Business combinations
The purchase method of accounting is employed in accounting for the acquisition of businesses. In
accordance with IFRS 3, the cost of a business combination is measured as the aggregate of the fair values
at the date of exchange of assets given and liabilities incurred or assumed in exchange for control, together
with any directly attributable expenses. The assets and liabilities and contingent liabilities of the acquired
entity are measured at their fair values at the date of acquisition. When the initial accounting for a business
combination is determined provisionally, any adjustments to the provisional values allocated are made
within 12 months of the acquisition date and are effected prospectively from that date.
Foreign currency translation
Items included in the financial statements of each of the Group’s entities are measured using the
currency of the primary economic environment in which the entity operates (the “functional currency”). The
consolidated financial statements are presented in euro, which is the functional currency of the majority of
the Group’s entities.
Transactions arising in foreign currencies are recorded at the rates of exchange ruling at the date of the
transaction. Monetary assets and liabilities denominated in foreign currencies are retranslated at the rate of
exchange prevailing at the balance sheet date and all related exchange gains or losses are accounted for
through the income statement. Non-monetary assets and liabilities denominated in foreign currencies are
translated to euro at foreign exchange rates ruling at the dates the transactions were effected.
Property, plant & equipment
Property, plant and equipment are stated at historical cost less accumulated depreciation and
provisions for impairments, if any. Depreciation is calculated so as to write off the cost, less estimated
residual value, of assets on a straight line basis over their expected useful lives at the following annual
rates:
Rate of
Depreciation
Plant and equipment................................................................................................................
20-33.3%
Fixtures and fittings ................................................................................................................
20%
Motor vehicles ........................................................................................................................
33.3%
Buildings.................................................................................................................................
5%
Aircraft are depreciated on a straight line basis over their estimated useful lives to estimated residual
values. The estimates of useful lives and residual values at year end are:
Aircraft Type
Number of Aircraft
at March 31, 2007
Useful Life
Residual Value
Boeing 737-800s
101
23 years from date of manufacture
15% of original cost

48
An element of the cost of an acquired aircraft is attributed on acquisition to its service potential
reflecting the maintenance condition of its engines and airframe. This cost, which can equate to a
substantial element of the total aircraft cost, is amortised over the shorter of the period to the next check
(usually between 8 and 12 years for Boeing 737-800 aircraft) or the remaining life of the aircraft. The costs
of subsequent major airframe and engine maintenance checks are capitalised and amortised over the shorter
of the period to the next check or the remaining life of the aircraft.
Advance and option payments made in respect of aircraft purchase commitments and options to
acquire aircraft are recorded at cost and separately disclosed within property, plant and equipment. On
acquisition of the related aircraft, these payments are included as part of the cost of aircraft and are
depreciated from that date.
Rotable spare parts held by the Group are classified as property, plant and equipment if they are
expected to be used over more than one period and are accounted for and depreciated in the same manner as
the related aircraft.
Aircraft maintenance costs
The accounting for the cost of providing major airframe and certain engine maintenance checks for
owned aircraft is described in the accounting policy for property, plant and equipment.
With respect to the Group’s operating lease agreements, where the Group has a commitment to
maintain the aircraft, provision is made during the lease term for the obligation based on estimated future
costs of major airframe and certain engine maintenance checks by making appropriate charges to the
income statement calculated by reference to the number of hours or cycles operated during the year.
All other maintenance costs are expensed as incurred.
Intangible assets - landing rights
Intangible assets acquired are recognised to the extent it is considered probable that expected future
benefits will flow to the Group and the associated costs can be measured reliably. Landing rights acquired as
part of a business combination are capitalised at fair value at that date and are not amortised, where those
rights are considered to be indefinite. The carrying value of those rights are reviewed for impairment at each
reporting date and are subject to impairment testing when events or changes in circumstances indicate that
carrying values may not be recoverable. No impairment to the carrying values of the Group’s intangible
assets has been recorded to date.
Available for sale securities - equities
The Group holds certain equity securities which are classified as available for sale, and are measured
at fair value, less incremental direct costs, on initial recognition. Subsequent to initial recognition they are
measured at fair value and changes therein, other than impairment losses, are recognised directly in equity.
The fair values of available for sale securities is determined by reference to quoted prices at each reporting
date. When an investment is de-recognised the cumulative gain or loss in equity is transferred to the
income statement.
Such securities are considered to be impaired if there is objective evidence which indicates that there
may be a negative influence on future cash flows of that asset. This includes where there is a significant or
prolonged decline in the fair value below its cost. All impairment losses are recognised in the income
statement and any cumulative loss in respect of an available for sale asset recognised previously in equity is
transferred to the income statement.

49
Other financial assets
Other financial assets comprise cash deposits of greater than 3 months maturity. All are classified as
held to maturity as there is a significant financial disincentive from redeeming such amounts at an earlier
stage. All such amounts are carried initially at fair value and then subsequently at amortised cost in the
balance sheet.
Derivative financial instruments
Ryanair is exposed to market risks relating to fluctuations in commodity prices, interest rates and
currency exchange rates. The objective of financial risk management at Ryanair is to minimise the impact
of commodity price, interest rate and foreign exchange rate fluctuations on the Group’s earnings, cash
flows and equity.
To manage these risks, Ryanair uses various derivative financial instruments, including interest rate
swaps, foreign currency forward contracts and commodity contracts. These derivative financial instruments
are generally held to maturity. The Group enters into these arrangements with the goal of hedging its
operational and balance sheet risk. However, Ryanair’s exposure to commodity price, interest rate and
currency exchange rate fluctuations cannot be neutralised completely.
Derivative financial instruments are recognised initially at fair value. Subsequent to initial recognition,
derivative financial instruments continue to be restated to fair value.
The fair value of interest rate swaps is computed by discounting the projected cashflows on the
company’s swap arrangements to present value. The fair value of forward exchange contracts and
commodity contracts is their quoted market price at the balance sheet date, being the present value of the
quoted forward price. Recognition of any resultant gain or loss depends on the nature of the item being
hedged.
Where a derivative financial instrument is designated as a hedge of the variability in cash flows of a
recognised asset or liability or a highly probable forecasted transaction, the effective part of any gain or loss
on the derivative financial instrument is recognised directly in equity (in the cash flow hedging reserve).
When the hedged forecasted transaction results in the recognition of a non financial asset or liability, the
cumulative gain or loss is removed from equity and included in the initial measurement of that asset or
liability. Otherwise the cumulative gain or loss is removed from equity and recognised in the income
statement at the same time as the hedged transaction. The ineffective part of any hedging transaction and
the gain or loss thereon is recognised in the income statement immediately.
When a hedging instrument or hedge relationship is terminated but the underlying hedged transaction
still is expected to occur, the cumulative gain or loss at that point remains in equity and is recognised in
accordance with the above policy when the transaction occurs. If the hedged transaction is no longer
expected to take place, the cumulative unrealised gain or loss recognised in equity is recognised in the
income statement immediately.
Where a derivative financial instrument hedges the changes in fair value of a recognised asset or
liability or an unrecognised firm commitment, any gain or loss on the hedging instrument is recognised in
the income statement. The hedged item also is stated at fair value in respect of the risk being hedged,
with any gain or loss also being recognised in the income statement.
Inventories
Inventories are stated at the lower of cost and net realisable value. Cost is based on invoiced price on
an average basis for all stock categories. Net realisable value is calculated as estimated selling price net of
estimated selling costs.

50
Trade and other receivables and payables
Trade and other receivables and payables are stated at cost less impairment losses, which approximate to
fair value given the short dated nature of these assets and liabilities.
Cash and cash equivalents
Cash represents cash held at banks and available on demand.
Cash equivalents are current asset investments (other than cash) that are readily convertible into
known amounts of cash. Cash equivalents include investments in commercial paper, certificates of deposit
and cash deposits of more than one day, but less than 3 months. Deposits with a maturity of greater than 3
months are recognised as short term investments.
Interest bearing loans & borrowings
All loans and borrowings are initially recorded at fair value, being the fair value of the consideration
received, net of attributable transaction costs. Subsequent to initial recognition, non-current interest bearing
loans are measured at amortised cost, using the effective interest yield methodology.
Leases
Assets held under finance leases are capitalised in the balance sheet and are depreciated over their
estimated useful lives. The present values of the future lease payments are recorded as obligations under
finance leases and the interest element of the lease obligation is charged to the income statement over the
period of the lease in proportion to the balances outstanding.
Expenditure arising under operating leases is charged to the income statement as incurred. The Group
also enters into sale and leaseback transactions whereby it sells the rights to acquire an aircraft to a third
party and subsequently leases the aircraft back, by way of an operating lease. Any profit or loss on the
disposal where the price achieved is not considered to be at fair value is spread over the period the asset is
expected to be used. The profit or loss amount deferred is included within other creditors and analysed into
its components of greater or less than one year.
Provisions and contingencies
A provision is recognised in the balance sheet when we have a present legal or constructive obligation
as a result of a past event, and it is probable that an outflow of economic benefit will be required to settle
the obligation. If the effect is material, provisions are determined by discounting the expected future
outflow at a pre-tax rate that reflects current market assessments of the time value of money and, when
appropriate, the risks specific to the liability.
We assess the likelihood of any adverse outcomes to contingencies, including legal matters, as well as
probable losses. We record provisions for such contingencies when it is probable that a liability will be
incurred and the amount of the loss can be reasonably estimated. A contingent liability is disclosed where
the existence of the obligation will only be confirmed by future events, or where the amount of the obligation
cannot be measured with reasonable reliability. Provisions are remeasured at each balance sheet date based
on the best estimate of the settlement amount.

51
In relation to legal matters, we develop estimates in consultation with outside counsel handling our
defence in these matters using the current facts and circumstances known to us. The factors that we consider
in developing our legal provisions include the merits and jurisdiction of the litigation, the nature and number
of other similar current and past litigation cases, the nature of the subject to the litigation, and the likelihood
of settlement and current state of settlement discussions, if any.
Segment reporting
A segment is a distinguishable component of the Group that is engaged either in providing products or
services (business segment), or in providing products or services within a particular economic environment
(geographical segment), which is subject to risks and returns different to those of other segments.
The Group’s primary reporting segments comprise geographic segments relating to the origin of its
turnover, as the Group only operates in one business segment, the provision of a low fares scheduled airline
service across a European route network.
Revenues
Scheduled revenues comprise the invoiced value of airline and other services, net of government taxes.
Revenue from the sale of flight seats is recognised in the period in which the service is provided. Unearned
revenue represents flight seats sold but not yet flown and is included in accrued expenses and other
liabilities. It is released to the income statement as passengers fly. Unused tickets are recognised as
revenue on a systematic basis. Miscellaneous fees charged for any changes to flight tickets are recognised
in revenue immediately.
Ancillary revenues are recognised in the income statement in the period the ancillary services are
provided.
Share based payments
The Group engages in equity settled share-based payment transactions in respect of services received
from certain of its employees. The fair value of the services received is measured by reference to the fair
value of the share options granted on the date of the grant. The cost of the employee services received in
respect of the share options granted is recognised in the income statement over the period that the services are
received, which is the vesting period, with a corresponding credit to equity. The fair value of the options
granted is determined using a Binomial Lattice option pricing model, which takes into account the exercise
price of the option, the current share price, the risk free interest rate, the expected volatility of the Ryanair
Holdings plc share price over the life of the option and other relevant factors. Non market vesting conditions
are taken into account by adjusting the number of shares or share options included in the measurement of the
cost of employee services so that ultimately, the amount recognised in the income statement reflects the
number of vested shares or share options.
On transitioning to IFRS for the first time in the year ended March 31, 2006 the Group also availed of
the transition provisions in IFRS 1 for share based payments by only applying the fair value calculation to
share option grants that were made after November 7, 2002, but which had not vested by January 1, 2005.

52
Pensions and other post retirement obligations
The Group provides employees with post retirement benefits in the form of pensions. The Group
operates a number of defined contribution and defined benefit pension schemes.
Costs arising in respect of the Group’s defined contribution pension schemes are charged to the
income statement in the period in which they are incurred. Any contributions unpaid at the balance sheet
date are included as a liability.
The liabilities and costs associated with the Group’s defined benefit pension schemes are assessed on
the basis of the projected unit credit method by professionally qualified actuaries and are arrived at using
actuarial assumptions based on market expectations at the balance sheet date. The discount rates employed
in determining the present value of each scheme’s liabilities are determined by reference to market yields at
the balance sheet date of high quality corporate bonds in the same currency and term that is consistent with
those of the associated pension obligations. The net surplus or deficit arising on the Group’s defined
benefit schemes is shown within non-current assets or liabilities on the balance sheet. The deferred tax
impact of any such amount is disclosed separately within deferred tax.
The Group separately recognises the operating and financing costs of defined benefit pensions in the
income statement. The standard permits a number of options for the recognition of actuarial gains and
losses. The Group has opted to recognise all actuarial gains and losses within equity as permitted under
IFRS.
Income taxes including deferred income taxes
Income tax on the profit or loss for the year comprises current and deferred tax. Income tax is
recognised in the income statement except to the extent that it relates to items recognised directly in equity
(such as certain derivative financial instruments, available for sale assets, pensions and other post
retirement obligations), in which case it is recognised in equity. Current tax payable on taxable profits is
recognised as an expense in the period in which the profits arise using tax rates enacted or substantively
enacted at the balance sheet date.
Deferred income tax is provided in full, using the liability method, on temporary differences arising
from the tax bases of assets and liabilities and their carrying accounts in the consolidated financial
statements. Deferred income tax is determined using tax rates and legislation enacted or substantively
enacted by the balance sheet date and expected to apply when the temporary differences reverse.
The following temporary differences are not provided for: the initial recognition of assets and
liabilities that effect neither accounting nor taxable profit and differences relating to investments in
subsidiaries to the extent that it is probable they will not reverse in the future.
A deferred tax asset is recognised to the extent that it is probable that future tax profits will be
available against which temporary differences can be utilised. The carrying amount of deferred tax assets is
reviewed at each balance sheet date and reduced to the extent that it is no longer probable that a sufficient
taxable profit would be available to allow all or part of the deferred tax asset to be realised.

53
2
Property, plant and equipment
Aircraft
Hangar
&
Buildings
Plant
&
Equipment
Fixtures
&
Fittings
Motor
Vehicles
Total
000
000
000
000
000
000
(i) Year ended March 31, 2007
Cost
At March 31, 2006........................................
2,870,085
13,265
6,540
11,773
981
2,902,644
Additions in year ..........................................478,996
9,772
4,101
1,474
628
494,971
Disposals in year........................................... (4,173)
-
(687)
-
-
(4,860)
At March 31, 2007........................................
3,344,908
23,037
9,954
13,247
1,609
3,392,755
Depreciation
At March 31, 2006........................................350,577
3,674
4,876
9,923
606
369,656
Charge for year .............................................140,130
685
1,402
987
299
143,503
Eliminated on disposals ................................ (4,025)
-
(432)
-
-
(4,457)
At March 31, 2007........................................486,682
4,359
5,846
10,910
905
508,702
Net book value
At March 31, 2007........................................
2,858,226
18,678
4,108
2,337
704
2,884,053
Aircraft
Hangar
&
Buildings
Plant
&
Equipment
Fixtures
&
Fittings
Motor
Vehicles
Total
(ii) Year ended March 31, 2006
Cost
At March 31, 2005........................................
2,544,771
13,129
5,357
10,685
640
2,574,582
Additions in year ..........................................542,518
136
1,183
1,136
341
545,314
Disposals in year...........................................
(217,204)
-
-
(48)
-
(217,252)
At March 31, 2006........................................
2,870,085
13,265
6,540
11,773
981
2,902,644
Depreciation
At March 31, 2005........................................440,374
2,934
3,938
8,933
512
456,691
Charge for year .............................................121,611
740
938
1,022
94
124,405
Eliminated on disposals ................................
(211,408)
-
-
(32)
-
(211,440)
At March 31, 2006........................................350,577
3,674
4,876
9,923
606
369,656
Net book value
At March 31, 2006........................................
2,519,508
9,591
1,664
1,850
375
2,532,988
At March 31, 2007, aircraft with a net book value of 2,504.1m (March 31, 2006: 2,124.4m) were
mortgaged to lenders as security for loans. Under the security arrangements for the Group’s new Boeing
737-800 “next generation” aircraft, the Group does not hold legal title to those aircraft while these loan
amounts remain outstanding.
At March 31, 2007, the cost and net book value of aircraft includes 392.6m (March 31, 2006:
301.5m) in respect of advance payments and options on aircraft. This amount is not depreciated. The cost
and net book value also includes capitalised aircraft maintenance, aircraft simulators and the stock of
rotable spare parts.
The net book value of assets held under finance leases at March 31, 2007 and 2006 was 183.1m and
91.6m respectively.

54
3
Intangible assets
Landing Rights
000
At March 31, 2007 ...................................................................................................................................
46,841
At March 31, 2006 ...................................................................................................................................
46,841
Landing slots were acquired with the acquisition of Buzz Stansted Limited in April 2003. As these
landing slots have no expiry date and are expected to be used in perpetuity, they are considered to be of
indefinite life and accordingly are not amortised. The directors also consider that there has been no
impairment of the value of these rights to date. The recoverable amount of these rights has been
determined on a value in use basis, using discounted cash flow projections for a twenty year period for each
route which has an individual landing right. The calculation of value in use is most sensitive to the
operating margin and discount rate assumptions. Operating margins are based on the existing margins
generated from these routes and adjusted for any known trading conditions. The trading environment is
subject to both regulatory and competitive pressures that can have a material affect on the operating
performance of the business. Foreseeable events, however, are unlikely to result in a change of projections
of a significant nature so as to result in the landing rights carrying amounts exceeding their recoverable
amounts. These projections have been discounted using a rate that reflects management’s estimate of the
long term pre tax return on capital employed for its scheduled airline business, estimated to be 5.0% for
2007 and 4.7% for 2006.
4 Available for sale financial assets
During the year the Company acquired a 25.2% stake in Aer Lingus plc., an Irish airline, at a cost of
344.9m. The balance sheet value of 406.1m reflects its market value as at March 31, 2007. In
accordance with the Company’s accounting policy, these assets are held at fair value with a corresponding
adjustment to equity following initial acquisition. This investment is classified as available for sale because
the Group does not have the power to exercise a significant influence over the entity.
5
Derivative financial instruments
The Audit Committee of the Board of Directors has responsibility for setting the treasury policies and
objectives of the Group, which include controls over the procedures used to manage the main financial risks
arising from the Group’s operations. Such risks comprise commodity price, foreign exchange and interest
rate risks. The Group uses financial instruments to manage exposures arising from these risks. These
instruments include borrowings, cash deposits and derivatives (principally jet fuel derivatives, interest rate
swaps and forward foreign exchange contracts). It is the Group’s policy that no speculative trading in
financial instruments takes place.
The Group’s historical fuel risk management policy has been to hedge between 70% and 90% of the
forecasted rolling annual volumes required to ensure that the future cost per gallon of fuel is locked in.
This policy was adopted to prevent the Group being exposed, in the short term, to adverse movements in
world jet fuel prices. However, when deemed to be in the best interests of the Group, it may deviate from
this policy. In more recent times, due to fundamental changes in the world energy markets, the Group has
adopted a more selective approach to fuel hedging. At March 31, 2007, the Group had hedged
approximately 73% of its fuel exposure for the year ended March 31, 2008. (March 31, 2006: Nil).

55
Foreign currency risk in relation to the Group’s trading operations largely arises in relation to non-euro
currencies. These currencies are primarily Sterling pounds and U.S. dollar. The Group manages this risk by
matching Sterling revenues against Sterling costs. Surplus Sterling revenues are used to fund forward foreign
exchange contracts to hedge U.S. dollar currency exposures that arise in relation to fuel, maintenance,
aviation insurance, and capital expenditure costs in addition to euro currency on hand, or converted into
euros.
The Group’s objective for interest rate risk management is to reduce interest risk through a combination
of financial instruments which lock in interest rates on debt and by matching a proportion of floating rate
assets with floating rate liabilities. In addition, the Group aims to achieve the best available return on
investments of surplus cash – subject to credit risk and liquidity constraints. Credit risk is managed by
limiting the aggregate amount and duration of exposure to any one counterparty based on third party market
based ratings. In line with the above interest rate risk management strategy the Group has entered into a
series of interest rate swaps to hedge against fluctuations in interest rates for certain floating rate financial
arrangements and certain other obligations. The Group has also entered into floating rate financing for
certain aircraft which is matched with floating rate deposits. Additionally, certain cash deposits have been
set aside as collateral to mitigate certain counterparty risk of fluctuations on certain derivative and other
financing arrangements (“restricted cash”). At March 31, 2007, such restricted cash amounted to 255m
(2006: 200.0m). Additional numerical information on these swaps and on other derivatives held by the
Group is set out below and in note 11.
The Group utilises a range of derivatives designed to mitigate these risks. All of the above derivatives
have been accounted for at fair value in the Group’s balance sheet and have been utilised to hedge against
these particular risks arising in the normal course of the Group’s business. All have been designated as
hedges for the purposes of IAS 39 and are fully set out below.
Derivative financial instruments, all of which have been recognised at fair value in the Group’s
balance sheet, are analysed as follows:
2007
2006
000
000
Non- current assets
Gains on cash flow hedging instruments – maturing after one year.....................................................
-
763
-
763
Current assets
Gains on fair value hedging instruments-maturing within one year ....................................................
-
7,543
Gains on cash flow hedging instruments – maturing after one year.....................................................
52,736
11,329
52,736
18,872
Total derivative assets..........................................................................................................................
52,736
19,635
Current liabilities
Losses on fair value hedging instruments – maturing within one year ................................................
(17,217)
-
Losses on cash flow hedging instruments – maturing within one year ................................................
(38,836)
(27,417)
(56,053)
(27,417)
Non-current liabilities
Losses on fair value hedging instruments – maturing after one year ...................................................
(236)
-
Losses on cash flow hedging instruments – maturing after one year ...................................................
(58,430)
(81,897)
(58,666)
(81,897)
Total derivative liabilities ....................................................................................................................
(114,719)
(109,314)
Net derivative financial instrument position at year end ...............................................................
(61,983)
(89,679)
All of the above gains and losses were unrealised at the period end.

56
The table above includes the following derivative arrangements:
Fair value
Fair value
2007
2006
000
000
Interest rate swaps
Less than one year ...............................................................................................................................
(16,546)
(27,417)
More than one year ..............................................................................................................................
(55,812)
(81,897)
(72,358)
(109,314)
Foreign currency forward contracts
Less than one year ...............................................................................................................................
(39,507)
18,872
More than one year ..............................................................................................................................
(2,854)
763
(42,361)
19,635
Commodity forward contracts
Less than one year ...............................................................................................................................
52,736
-
52,736
-
Net derivative position at year end................................................................................................
(61,983)
(89,679)
Additional information in relation to the above interest rate swaps and forward currency contracts (i.e. notional value and weighted average
interest rates) can be found in note 11.
Interest rate swaps are primarily used to convert a portion of the Group’s floating rate exposures on
borrowings and operating leases into fixed rate exposures and are set so as to match exactly the critical terms
of the underlying debt or lease being hedged (i.e. notional principal, interest rate settings, repricing dates).
These are all classified as cash flow hedges of the forecasted variable interest payments and rentals due on
the Group’s underlying debt and operating leases and have been determined to be highly effective in
achieving offsetting cash flows. Accordingly no material level of ineffectiveness has been recorded in the
income statement relating to these hedges in the current year. Unrealised losses on the Group’s interest rate
swaps of 72.4m (2006: 109.3m) will be amortised to the income statement from equity over the period in
which forecasted interest and lease payments will be made (typically 1-10 years from the year end), as an
offset to the related interest and rental expense.
Foreign currency forward contracts are utilised in a number of ways: Forecast Sterling pounds and
euro revenue receipts are converted into U.S. dollars to hedge against forecasted U.S. dollar payments
principally for jet fuel, insurance and other aircraft related costs. These are classified as either cash flow or
fair value hedges of forecasted and committed U.S. dollar payments and have been determined to be highly
effective in offsetting variability in future cash flows and fair values arising from the fluctuation in the U.S.
dollar to Sterling pounds and euro exchange rates for the forecasted and committed U.S. dollar purchases.
No material level of ineffectiveness has been recorded for these foreign currency forward contracts in the
current year as the underlying hedged items and hedging instruments have been consistently closely
matched.
The Group also utilises jet fuel forward contracts to manage exposure to jet fuel prices. These are
used to hedge the Group’s forecasted fuel purchases, and are arranged so as to match against forecasted fuel
delivery and payment requirements. These are classified as cashflow hedges of forecast fuel payments and
have been determined to be highly effective in offsetting variability in future cash flows arising from
fluctuations in jet fuel prices. No material level of ineffectiveness has been recorded on these arrangements
in the current or prior year.

57
6
Inventories
At March 31,
2007
2006
000
000
Consumables.............................................................................................................
2,420
3,422
In the view of the directors, there are no material differences between the replacement cost of
inventories and the balance sheet amounts.
7
Other assets
At March 31,
2007
2006
000
000
Prepayments............................................................................................................
39,253
14,643
Interest receivable ...................................................................................................
9,028
9,076
Refundable deposits................................................................................................
24,088
-
Value Added Tax recoverable.................................................................................
5,338
5,734
77,707
29,453
All amounts fall due within one year.
8
Trade receivables
At March 31,
2007
2006
000
000
Trade receivables ..............................................................................................................
23,600
30,362
Provision for impairment ................................................................................................
(188)
(453)
23,412
29,909
All amounts fall due within one year.
The movement in the provision for trade receivable impairments is as follows:
Balance at
beginning
of year
Additions
charged to
expenses
Write-offs
Balance at end
of year
000
000
000
000
Year ended March 31, 2007................................
453
-
(265)
188
Year ended March 31, 2006................................
405
48
-
453
9
Restricted cash
Restricted cash consists of 255m (2006: 200m) placed on deposit as collateral for certain derivative
financial instruments and other financing arrangements entered into by the Group, and a further 4m (2006:
4m) held in escrow relating to ongoing legal proceedings.

58
10 Accrued expenses and other liabilities
At March 31,
2007
2006
000
000
Accruals .............................................................................................................................
207,311
109,681
Taxation .............................................................................................................................
193,887
111,291
Unearned revenue ..............................................................................................................
405,938
349,642
807,136
570,614
Taxation above comprises:
At March 31,
2007
2006
000
000
PAYE (payroll taxes).........................................................................................................
4,969
4,012
Other tax (principally air passenger duty)..........................................................................
188,918
107,279
193,887
111,291
11 Financial instruments including current and non-current debt
The Group utilises financial instruments to reduce exposures to market risks throughout its business.
Borrowings, cash and cash equivalents and liquid investments are used to finance the Group’s operations.
Derivative financial instruments are contractual agreements with a value which reflects price movements in
an underlying asset. The Group uses derivative financial instruments, principally jet fuel derivatives,
interest rate swaps and forward foreign exchange contracts to manage commodity risks, interest rate risks,
currency exposures and achieve the desired profile of borrowings and leases. It is the Group’s policy that
no speculative trading in financial instruments shall take place.
The main risks attaching to the Group’s financial instruments and the details of the derivatives
employed to hedge against these risks have been given in note 5.
(a)
Commodity risk
The Group’s exposure to price risk in this regard is primarily for jet fuel used in the normal course of
operations.
At the year end, the Group had the following jet fuel arrangements in place;
At March 31,
2007
2006
$000
$000
Jet fuel forward contracts- fair value
52,736
-
All of the above commodity contracts mature within the year and are matched against highly probable
forecast fuel purchases.

59
(b)
Maturity and interest rate risk profile of financial assets and financial liabilities
At March 31, 2007, the Group had total borrowings of 1,862.1m (2006: 1,677.7m) from various
financial institutions provided primarily on the basis of guarantees granted by the Export-Import Bank of
the United States to finance the acquisition of 91 Boeing 737-800 “next generation” aircraft. The
guarantees are secured with a first fixed mortgage on the delivered aircraft. The remaining long term debt
relates to 8 aircraft held under finance leases, 3 aircraft financed under commercial debt and aircraft
simulators.
The maturity profile of the Group’s financial liabilities at March 31, 2007 was as follows:
All of the above debt which matures after 2011 will mature over each of the periods between 2012 and
2019.
The maturity profile of the Group’s financial liabilities at March 31, 2006 was as follows:
Year ended March 31,
Weighted
average
fixed rate
(%)
2008
000
2009
000
2010
000
2011
000
Thereafter
000
Total
000
Fixed rate
Secured long term debt ...........
5.17%
57,363
60,758
64,379
68,240
139,662
390,402
Debt swapped from floating to
fixed........................................
5.92%
64,492
66,072
67,719
69,391
367,367
635,041
Secured long term debt after
swaps ......................................
5.63%
121,855
126,830
132,098
137,631
507,029
1,025,443
Finance leases .........................
2.70%
-
-
-
-
73,976
73,976
Total fixed rate debt................
121,855
126,830
132,098
137,631
581,005
1,099,419
Floating rate
Secured long term debt ...........
109,092
112,299
114,659
120,033
774,295
1,230,378
Debt swapped from floating to
fixed........................................
(64,492)
(66,072)
(67,719)
(69,391)
(367,367)
(635,041)
Secured long term debt after
swaps ......................................
44,600
46,227
46,940
50,642
406,928
595,337
Finance leases .........................
12,463
13,012
13,587
14,186
114,062
167,310
Total floating rate debt............
57,063
59,239
60,527
64,828
520,990
762,647
Total financial liabilities .........
178,918
186,069
192,625
202,459
1,101,995
1,862,066
Year ended March 31,
Weighted
average
fixed rate
(%)
2007
000
2008
000
2009
000
2010
000
Thereafter
000
Total
000
Fixed rate
Secured long term debt .............
5.17%
54,174
57,363
60,758
64,379
207,902
444,576
Debt swapped from floating to
fixed..........................................
5.91%
63,091
64,612
66,166
67,786
436,809
698,464
Secured long term debt after swaps
5.62%
117,265
121,975
126,924
132,165
644,711
1,143,040
Finance leases ...........................
2.70%
-
-
-
-
34,395
34,395
Total fixed rate debt..................
117,265
121,975
126,924
132,165
679,106
1,177,435
Floating rate
Secured long term debt .............
93,198
95,655
98,280
100,977
729,267
1,117,377
Debt swapped from floating to
fixed..........................................
(63,091)
(64,612)
(66,166)
(67,786)
(436,809)
(698,464)
Secured long term debt after swaps
30,107
31,043
32,114
33,191
292,458
418,913
Finance leases ...........................
5,939
6,195
6,462
6,740
56,044
81,380
Total floating rate debt..............
36,046
37,238
38,576
39,931
348,502
500,293
Total financial liabilities ...........
153,311
159,213
165,500
172,096
1,027,608
1,677,728

60
Analysis of changes in borrowings during the year
At March 31,
2007
2006
000
000
Balance at start of year .........................................................................
1,677,728
1,414,857
Loans raised to finance aircraft/simulator purchases............................
339,409
386,809
Repayments of amounts borrowed .......................................................
(155,071)
(123,938)
Balance at end of year ........................................................................
1,862,066
1,677,728
Less than one year ................................................................................
178,918
153,311
More than one year...............................................................................
1,683,148
1,524,417
1,862,066
1,677,728
Interest rate repricing:
Floating interest rates on financial liabilities are generally referenced to European inter-bank interest
rates (EURIBOR). Secured long term debt and interest rate swaps typically reprice on a quarterly basis
with finance leases repricing on a semi-annual basis.
Fixed interest rates on financial liabilities are fixed for the duration of the underlying structures
(typically between 10 and 12 years).
The Group holds significant cash balances that are invested on a short-term basis. At March 31, 2007,
all of the Group’s cash and liquid resources had a maturity of one year or less and attracted a weighted
average interest rate of 3.85% (2006: 2.71%). The Group also holds an equity investment of 406.1m,
which was classified as an available for sale security (2006: nil). This has no fixed maturity and is non
interest bearing.
Financial assets:
Within
1 year
2007
Total
Within
1 year
2006
Total
000
000
000
000
Cash and cash equivalents.....................................
1,346,419
1,346,419
1,439,004
1,439,004
Cash > 3 months....................................................
592,774
592,774
328,927
328,927
Restricted cash ......................................................
258,808
258,808
204,040
204,040
Total financial assets .............................................
2,198,001
2,198,001
1,971,971
1,971,971
Interest rates on cash and liquid resources are generally based on the appropriate EURIBOR, LIBOR
or bank rates dependant on the principal amounts on deposit.
(c) Foreign currency risk
The Group has exposure to various foreign currencies (principally Sterling pounds and U.S. dollars)
due to the international nature of its operations. The Group manages this risk by matching Sterling pound
revenues against Sterling pound costs. Any unmatched Sterling pound revenues are used to fund U.S.
dollar currency exposures that arise in relation to fuel, maintenance, aviation insurance and capital
expenditure costs or are sold for euro. Further details of the hedging activity carried out by the Group are
given in note 5.

61
The following table shows the net amount of monetary assets of the Group that are not denominated in
euro at March 31, 2007 and March 31, 2006 and have been translated using the following year end foreign
currency rates: 2007 EUR to GBP 0.6798, EUR to USD 1.3318 (2006: EUR to GBP 0.6964, EUR to USD
1.2104)
March 31, 2007
March 31, 2006
GBP
U.S.$
euro
equiv
GBP
U.S.$
euro
equiv
£000
$000
000
£000
$000
000
Monetary assets
GBP cash and liquid resources ......................
68,114
-
100,197
79,424
-
114,049
USD cash and liquid resources ...................... -
15,877
11,921
-
54,839
45,307
68,114
15,877
112,118
79,424
54,839
159,356
All of the Group’s equity securities held as available for sale assets are denominated in euro currency.
All of the Group’s financial liabilities are denominated in euro.
The Group also enters into U.S. dollar and Sterling pound currency forward contracts in order to
manage currency risk which arises on its forecasted aircraft payments, fuel, maintenance and aviation
insurance costs, which are primarily denominated in U.S. dollars, and certain of its revenue income streams
which arise in Sterling pounds. See further details in note 5.
The following table gives details of the notional amounts of the Group’s currency forward contracts as
at March 31, 2007 and at March 31, 2006:
March 31, 2007
March 31, 2006
Currency forward contracts
GBP
U.S.$
euro
equiv
GBP
U.S.$
euro
equiv
£000
$000
000
£000
$000
000
U.S. dollar currency forward contracts
- for aircraft purchases ...................................
-
870,000
668,915
-
480,000
384,268
- for fuel and other purchases.........................
-
989,000
762,228
-
592,923
470,775
GBP currency forward contracts
- sterling revenues ..........................................
-
-
-
37,039
-
53,044
-
1,859,000
1,431,143
37,039
1,072,923
908,087
(d) Fair values
Fair value is the amount at which a financial instrument could be exchanged in an arm’s length
transaction between informed and willing parties, other than as part of a forced liquidation sale. The
following methods and assumptions were used to estimate the fair value of each material class of the
Group’s financial instruments:
•
Cash and liquid resources: carrying amount approximates to fair value due to the short-term
nature of these instruments.
•
Fixed-rate long-term debt: the repayments which Ryanair is committed to make have been
discounted at the relevant rates of interest applicable at March 31, 2007 and March 31, 2006, which
would be payable to a third party to assume the obligation.
•
Derivative – interest rate swaps: discounted cash flow analyses have been used to determine the
estimated amount Ryanair would receive or pay to terminate the contracts. Discounted cash flow
analyses are based on estimated future interest rates.
•
Derivative – currency forward and aircraft fuel: a comparison of the contracted rate to the
market rate for contracts providing a similar risk management profile at March 31, 2007 and
March 31, 2006 has been made.

62
The fair value of the Group’s financial instruments at March 31, 2007 and March 31, 2006 was as
follows:
2007
Carrying
amount
2007
Fair
value
2006
Carrying
amount
2006
Fair
value
000
000
000
000
Financial assets
Available for sale assets................................................................ 406,075
406,075
-
-
Cash and liquid resources
Cash and cash equivalents ................................................................
1,346,419
1,346,419
1,439,004
1,439,004
Cash > 3 months ................................................................
592,774
592,774
328,927
328,927
Restricted cash ................................................................................................
258,808
258,808
204,040
204,040
Debt instruments
Long term debt................................................................................................
(1,862,066)
(1,877,033)
(1,677,728)
(1,703,431)
Derivative instruments
Interest rate swaps (loss)................................................................
(72,358)
(72,358)
(109,314)
(109,314)
U.S. dollar currency forward contracts gain ................................(42,361)
(42,361)
19,837
19,837
Sterling currency forward contracts gain/(loss) ................................
-
-
(202)
(202)
Aircraft fuel price contracts gain ................................................................
52,736
52,736
-
-
(e) Credit risk
The Group holds significant cash balances which are invested on a short-term basis and are classified
as either cash equivalents or liquid investments. These deposits and other financial instruments (principally
certain derivatives and loans as identified above) give rise to credit risk on amounts due from
counterparties. Credit risk is managed by limiting the aggregate amount and duration of exposure to any
one counterparty primarily depending on its third party market based ratings and by regular review of these
ratings. The Group typically enters into deposits and derivative contracts with parties that have at least an
“A” or equivalent credit rating. The maximum exposure arising in the event of default on the part of the
counterparty is the carrying value of the relevant financial instrument.
The Group’s revenues derive principally from airline travel on scheduled services, car hire, inflight
and related sales. Revenue is wholly derived from European routes. No individual customer accounts for a
significant portion of total revenue.
(f) Guarantees
Details of the Group’s guarantees and the related accounting have been given in note 24.
(g) Sensitivity analysis
Interest rate risk: If the Group had not entered into its interest rate derivative agreements, a plus or
minus one percentage point movement in interest rates would impact the fair value of its liability at March
31, 2007 by approximately 39m. The earnings and cashflow impact of such a change in interest rates
would have been approximately plus or minus 10m per year.
Foreign currency risk: If the Group had not entered into its foreign currency forward contracts,
holding other variables constant, if there was an adverse change of 10% in relevant foreign currency
exchange rates, the market value of the Group’s foreign currency forward contracts outstanding at March
31, 2007 would decrease by approximately 112m.

63
12 Deferred and current taxation
The components of the deferred and current taxation in the balance sheet were as follows:
At March 31,
2007
2006
000
000
Current income tax liabilities
Corporation tax provision ................................................................................................
20,822
15,247
Total current tax......................................................................................................................
20,822
15,247
Deferred income tax liabilities (non-current)
Origination and reversal of temporary differences on property, plant and equipment,
derivatives, pensions, and available for sale securities ...........................................................
151,032
127,260
Total non current ....................................................................................................................
151,032
127,260
Total tax liabilities (net)..........................................................................................................
171,854
142,507
At March 31,
2007
2006
Reconciliation of current tax
000
000
At beginning of year ..............................................................................................................
15,247
17,534
Corporation tax charge in year......................................................................................…..
22,310
1,950
Adjustment in respect of prior year overprovision..............................................................
(11,541)
(4,673)
Tax (paid)/refund ............................................................................................................................ (5,194)
436
At end of year ................................................................................................................................
20,822
15,247
At March 31,
2007
2006
Reconciliation of deferred tax
000
000
At beginning of year……………………………………………………………………….
127,260
104,180
Adjustment in respect of prior year overprovision..............................................................
(22,078)
-
New temporary differences on property, plant and equipment, derivatives, pensions
and other items................................................................................................................…
45,850
23,080
At end of year .....................................................................................................................
151,032
127,260
The release of the prior year overprovision included above relates to the recognition of certain
previously unrecognised tax benefits, resulting in a benefit to the Group’s effective tax rate which is not
reasonably expected to recur. New temporary differences arising in the year to March 31, 2007 principally
consisted of 26.7m for property, plant and equipment recognised within the income statement, 0.2m for
pensions, 6.9m for derivatives and 12.2m in respect of available for sale assets, all recognised in equity.
The charge to March 31, 2006 consisted of temporary differences of 34.9m for property, plant and
equipment recognised in the income statement, 0.3m for pensions and a deferred tax credit of 12.1m for
derivatives recognised in equity.
Year ended
March 31,
2007
Year ended
March 31,
2006
The components of the tax expense in the income statement were as follows:
000
000
Current tax charge for year .......................................................................................
22,310
1,950
Adjustment in respect of prior year overprovisions .................................................
(33,619)
(4,673)
Deferred tax charge relating to origination and reversal of temporary differences ...
26,746
34,899
15,437
32,176

64
The following table reconciles the statutory rate of Irish corporation tax to the Group’s effective
corporation tax rate:
Year ended
March 31,
2007
Year ended
March 31,
2006
%
%
Statutory rate of Irish corporation tax ........................................................................
12.5
12.5
Adjustments for earnings taxed at higher rates ..........................................................
1.2
1.1
Adjustments for earnings taxed at lower rates ...........................................................
(3.2)
(4.5)
Other differences ......................................................................................................
0.5
0.4
Adjustments for prior year overprovisions................................................................
(7.6)
-
Total effective rate of taxation ...................................................................................
3.4
9.5
Deferred tax applicable to items charged or credited directly to equity were as follows:
At March 31,
2007
2006
000
000
Defined benefit pension obligations..........................................................................
284
332
Derivative financial instruments ...............................................................................
6,588
(12,151)
Available for sale securities ......................................................................................
12,231
-
Total tax charge/(credit) in equity.............................................................................
19,103
(11,819)
At March 31, 2007, the Group had no unused net operating losses carried forward (2006: 20.3m).
The majority of current and deferred tax recorded in each of fiscal 2007 and 2006 relates to domestic tax
charges and there is no expiry date associated with these temporary differences. In fiscal 2007, the Irish
headline corporation tax rate remained at 12.5%.
Ryanair.com Limited is engaged in international data processing and reservation services. In these
circumstances, Ryanair.com Limited is entitled to claim 10% corporation tax rate on profits derived from
qualifying activities in accordance with Section 448 of the Taxes Consolidated Act, 1997. This legislation
provides for the continuation of the 10% effective corporation tax rate until 2010.
The principal components of deferred tax at each year end were:
At March 31,
2007
2006
000
000
Arising on capital allowances and other temporary differences................................
145,164
143,032
Arising on unused net operating losses carried forward............................................
-
(2,537)
Arising on derivatives ...............................................................................................
(5,563)
(12,151)
Arising on pensions ..................................................................................................
(800)
(1,084)
Arising on available for sale securities .....................................................................
12,231
-
Total..........................................................................................................................
151,032
127,260
At March 31, 2007 and 2006, the Group had fully provided for all required deferred tax assets and
liabilities. No deferred tax has however, been provided on the unremitted earnings of overseas subsidiaries
because there is no intention to remit these to Ireland.

65
13 Provisions
At March 31,
2007
2006
000
000
Provision for aircraft maintenance on operating leased aircraft:
At beginning of year ......................................................................................................
16,722
7,236
Charge for the year ........................................................................................................
11,997
9,486
At end of year ................................................................................................................
28,719
16,722
14 Other creditors
This consists of:
•
Deferred gains arising from the sale and leaseback of aircraft. During fiscal year 2007,
Ryanair entered into a sale and leaseback arrangement for 15 new Boeing 737-800 “next
generation” aircraft (2006: 4) in addition to a further 17 in previous years.
•
The present value of the net pension obligation before tax of 7.0m (2006: 8.7m) in Ryanair
Limited. See note 22 for further details.
•
Loss on fair value movement in firm commitments to acquire aircraft – maturing within the
year of Nil (2006: 7.5m), (forming part of the Group’s fair value hedge accounting - see
note 5).
15 Issued share capital, share premium account and share options
(a) Share capital
At March 31,
2007
2006
000
000
Authorised:
1,680,000,000 ordinary equity shares of 0.635 euro cent each .....................................
10,668
10,668
Allotted, called up and fully paid:
1,547,028,730 ordinary equity shares of 0.0635 euro cent each ........................................
9,822
-
1,542,033,246 ordinary equity shares of 0.0635 euro cent each......................................
-
9,790
On February 26, 2007 the Company implemented a sub-division of the Company’s ordinary shares of
1.27 cent into ordinary shares of 0.635 cent (the “stock split”). Both the share capital and earnings per
share figures have been restated to give effect to the stock split. The movement in the share capital balance
year on year principally relates to 5.0m (2006: 18.1m) in new shares issued due to the exercise of share
options.

66
(b) Share premium account
At March 31,
2007
2006
000
000
Balance at beginning of year....................................................................................
596,231
565,756
Share premium arising from the exercise of 4,995,486 options in fiscal 2007 and
18,107,030 in fiscal 2006 ..........................................................................................
11,202
30,475
Balance at end of year ..........................................................................................................
607,433
596,231
(c) Share options and share purchase arrangements
The Group has adopted a number of share option plans, which allow current or future employees or
executive directors to purchase shares in the Company up to an aggregate of approximately 5% (when
aggregated with other ordinary shares over which options are granted and which have not yet been
exercised) of the outstanding ordinary shares of Ryanair Holdings plc, subject to certain conditions. These
are exercisable at a price equal to the market price of the ordinary shares at the time options are granted.
The key terms of these option plans include:
•
Certain non-market performance conditions to be met;
•
Approval of the Remuneration Committee to be given; and
•
Certain employees to remain in employment with the Group for a specified period of time.
Details of the share options outstanding (as adjusted for the stock split on February 26, 2007) are set out
below:
Share Options
Weighted
Average
Exercise Price
Outstanding at March 31, 2005.................................................................................
51,912,988
2.20
Exercised ..................................................................................................................
(18,107,030)
1.73
Granted .....................................................................................................................
10,400,000
3.21
Expired......................................................................................................................
(1,571,956)
1.30
Outstanding at March 31, 2006.................................................................................
42,634,002
2.67
Exercised ..................................................................................................................
(4,995,486)
2.31
Granted .....................................................................................................................
666,000
3.77
Expired......................................................................................................................
(3,196,538)
2.32
Outstanding at March 31, 2007.................................................................................
35,107,978
2.77
The mid-market price of Ryanair Holdings plc’s ordinary shares on the Irish Stock Exchange at
March 31, 2007 was 5.83 (2006: 3.92). The highest and lowest prices at which the Company’s shares
traded on the Irish Stock Exchange in the year ended March 31, 2007 were 6.30 and 3.25, respectively
(2006: 4.15 and 2.80). There were 1,939,190 options exercisable at March 31, 2007 (2006: 3,510,847).
The average share price for the year was 4.43 (2006: 3.48)
The Group has accounted for its share option grants to employees at fair value, in accordance with
IFRS 2, using a binomial lattice model to value the option grants. This has resulted in a charge of 3.9m
(2006: 2.9m) being recognised within the income statement in respect of employee services rendered,
which was based on 15.8m share options within the scope of IFRS 2 (2006: 16.0m) as compared to the total
share options disclosed above.

67
The weighted average fair value of the individual options granted during the years ended March 31,
2007 and 2006 were estimated, using a binomial lattice model, based on the following assumptions:
Options Granted
2007
2006
Date Granted ..........................................................................................................
Apr 7, 2006
Aug 10, 2005
Date of earliest exercise ............................................................................................ Apr 7, 2011
Aug 10, 2010
Date of expiration ....................................................................................................
Apr 7, 2013
Aug 10, 2012
Fair Value .................................................................................................................
1.51
1.43
Assumptions:
Risk-free interest rate ...........................................................................................
3.7%
3.0%
Volatility* ............................................................................................................
40%
40%
Dividend Yield......................................................................................................
Nil
Nil
Expected life (years) ............................................................................................
5.5
5.5
*historical daily volatility over a five and a half year average period
16 Retained earnings and other equity movements
Ordinary
shares
Share
premium
account
Retained
earnings
Other
Reserves
Total
000
000
000
000
000
Balance at March 31, 2005................................................................
9,675
565,756
1,158,584
488
1,734,503
Adjustment for impact of first time adoption of IAS 39 ................................
-
-
(128,074)
(128,074)
Effective portion of changes in fair value of cash flow hedges .....................
-
-
-
65,966
65,966
Net change in fair value of cash flow hedges transferred to the
profit and loss ...............................................................................................
-
-
-
(22,960)
(22,960)
Net movements into cash flow hedge reserve................................................
-
-
-
43,006
43,006
Issue of ordinary equity shares (net of issue costs)................................
115
30,475
-
-
30,590
Profit for the financial year................................................................
-
-
306,712
-
306,712
Share-based payments ...................................................................................
-
-
-
2,921
2,921
Retirement benefits........................................................................................
-
-
2,327
-
2,327
Balance at March 31, 2006 ..............................................................
9,790
596,231
1,467,623
(81,659)
1,991,985
Effective portion of changes in fair value of cash flow hedges .....................
-
-
-
79,025
79,025
Net change in fair value of cash flow hedges transferred to the
profit and loss ................................................................................................
-
-
-
(32,920)
(32,920)
Net movements into cash flow hedge reserve................................................
-
-
-
46,105
46,105
Issue of ordinary equity shares (net of issue costs)................................
32
11,202
-
-
11,234
Net change in fair value of available for sale asset ................................
-
-
-
48,926
48,926
Profit for the financial year................................................................
-
-
435,600
-
435,600
Share-based payments ....................................................................................
-
-
-
3,935
3,935
Retirement benefits........................................................................................
-
-
1,988
-
1,988
Balance at March 31, 2007 ..............................................................
9,822
607,433
1,905,211
17,307
2,539,773
The total share based payments reserve at March 31, 2007 was 7.3m (2006: 3.4m) and the total cash
flow hedge reserve amounted to 39.0m (negative) at March 31, 2007 (2006: 85.1m negative). The total
available for sale reserve amounted to 48.9m at March 31, 2007 (2006: Nil). Further details of the Group’s
derivatives are set out in notes 5 and 11. The accumulated balance on retained earnings is stated after a write
off of goodwill on a previous Group reorganisation of 4.1m which arose in the year ended March 31, 1997.
The Group has elected not to restate this transaction in accordance with the transitional provisions of IFRS 1.

68
17 Analysis of operating revenues and segmental analysis
All revenues derive from the Group’s principal activity and business segment as a low fares airline and
includes scheduled services, car hire, internet income and related sales to third parties.
Revenue is analysed by geographical area (by country of origin) as follows:
Year ended
March 31,
2007
Year ended
March 31,
2006
000
000
United Kingdom ....................................................................................................
984,010
809,706
Other European countries ......................................................................................
1,252,885
882,824
2,236,895
1,692,530
Ancillary revenues included in total revenue above comprise:
Year ended
March 31,
2007
Year ended
March 31,
2006
000
000
Non-flight scheduled..............................................................................................
241,990
166,796
Car hire ..................................................................................................................
22,972
19,752
In-flight..................................................................................................................
60,079
45,306
Internet income ......................................................................................................
37,063
27,299
362,104
259,153
All of the Group’s operating profit arises from low fares airline-related activities, its only business
segment. The major revenue earning assets of the Group are comprised of its aircraft fleet, which is
registered in Ireland and therefore principally all profits accrue in Ireland. Since the Group’s aircraft fleet
is flexibly employed across its route network in Europe, there is no suitable basis of allocating such assets
and related liabilities to geographical segments. Internet income comprises revenue generated from
Ryanair.com, excluding internet car hire revenue, which is included under the heading car hire. Non-flight
scheduled revenue arises from the sale of rail and bus tickets, hotel reservations and other revenues
generated, including excess baggage charges, all directly attributable to the low fares business.
18 Staff numbers and costs
The average weekly number of employees, including the executive director, during the year, analysed
by category, was as follows:
Year ended
March 31,
2007
Year ended
March 31,
2006
Flight and cabin crew................................................................................................
3,052
2,271
Sales, operations and administration.......................................................................................
939
792
3,991
3,063

69
The aggregate payroll costs of these persons were as follows:
Year ended
March 31,
2007
Year ended
March 31,
2006
000
000
Salaries and related costs ................................................................................................
204,654
151,962
Social welfare costs ................................................................................................
15,547
13,338
Other pension costs (i) ................................................................................................
2,444
3,191
Share based payments ................................................................................................
3,935
2,921
226,580
171,412
(i) Costs in respect of defined contribution benefit plans and other pension arrangements were 0.7m (2006 1.4m) while costs associated
with defined benefit plans included here were 1.7m (2006: 1.8m) (See note 22)
19 Other expenses-insurance claim
Included in the income statement for the year to March 31, 2006 is a credit of 5.2m (net of tax)
arising from the settlement of an insurance claim for the scribing of 6 Boeing 737-200 aircraft. This credit
has been included as a reduction to insurance costs included within operating expenses in the 2006 income
statement. No such items arose in fiscal 2007.
20 Statutory and other information
Year ended
March 31,
2007
Year ended
March 31,
2006
000
000
Directors’ emoluments:
-Fees ...........................................................................................................
251
265
-Other emoluments, including bonus and pension contributions ................
1,032
877
Depreciation of property, plant and equipment...................................................
138,109
120,877
Depreciation of property, plant and equipment held under finance leases ..........
5,394
3,528
Auditors’ remuneration
- audit (i) .....................................................................................................
281
213
- audit-related (ii)........................................................................................
18
67
- tax services (iii) ........................................................................................
243
188
- integrated audit costs associated with Sarbanes-Oxley (i) .......................
650
-
Operating lease charges, principally aircraft .......................................................
58,183
47,376
(i)
Audit services include integrated audit work performed on the consolidated financial statements, as well as work that
generally only the independent auditor can reasonably be expected to provide, including comfort letters, statutory audits,
and discussions surrounding the proper application of financial accounting and/or reporting standards.
(ii)
Audit-related services are for assurance and related services that are traditionally performed by the independent auditor,
including due diligence related to mergers and acquisitions, employee benefit plan audits, and special procedures
required to meet certain regulatory requirements.
(iii) Tax services include all services, except those services specifically related to the audit of financial statements,
performed by the independent auditor’s tax personnel, including tax analysis; supporting other tax-related regulatory
requirements; and tax compliance and reporting.

70
(a) Fees and emoluments - Executive Director
Year ended
March 31,
2007
Year ended
March 31,
2006
000
000
Basic salary...........................................................................................................
565
550
Bonus (Performance & target related) ..................................................................
365
200
Pension contributions............................................................................................
62
58
992
808
During the years ended March 31, 2007 and 2006 Michael O’Leary was the only executive director.
b) Fees and emoluments - Non Executive Directors
Year ended
March 31,
2007
Year ended
March 31,
2006
000
000
Fees
Emmanuel Faber ...................................................................................................
47
47
Michael Horgan ....................................................................................................
32
32
Klaus Kirchberger.................................................................................................
32
32
Raymond MacSharry (retired September, 2006) ..................................................
23
47
Kyran McLaughlin................................................................................................
47
47
James R. Osborne .................................................................................................
38
28
Paolo Pietrogrande................................................................................................
32
32
251
265
Emoluments
Michael Horgan ....................................................................................................
40
40
291
305
(c) Pension benefits
Directors
Increase in
Accrued Benefit
Transfer Value
Equivalent of Increase in
Accrued Benefit
Total Accumulated
Accrued Benefit
Fiscal 2007
Fiscal 2006
Fiscal 2007
Fiscal 2006
Fiscal 2007
Fiscal 2006
Michael O’Leary...............
9,535
8,885
56,735
49,549
116,907
104,244
There have been no changes in pension benefits provided to directors during the year. No pension
benefits are provided for non-executive directors. The executive director is a member of a defined benefit
plan. The cost of the death-in-service and disability benefits provided during the accounting year is not
included in the above figures. The pension benefits set out above have been computed in accordance with
Section 12.43(x) of the Listing Rules of the Irish Stock Exchange. The increases in transfer values of the
accrued benefits have been calculated as at each year-end in accordance with Actuarial Guidance Note
GN11.

71
(d) Shares and share options
(i) Shares
Ryanair Holdings plc is listed on the Irish, London and Nasdaq Stock Exchanges.
The beneficial interests as at March 31, 2007 and 2006 of the directors and of their spouses and minor
children in the share capital of the Company are as follows:
March 31,
2007
No. of Shares
March 31,
2006
No. of Shares
David Bonderman ......................................................................................................
14,117,360
14,017,360
Michael O’Leary ........................................................................................................
65,000,016
70,000,016
James R. Osborne.......................................................................................................
1,410,256
1,410,256
T. Anthony Ryan........................................................................................................
6,517,070
11,517,070
Kyran McLaughlin .....................................................................................................
50,000
50,000
Michael Horgan..........................................................................................................
50,000
50,000
All figures have been adjusted for 2:1 stock split on February 26, 2007
(ii) Share options
The number of share options held by directors in office at the end of fiscal 2007 were:
March 31,
2007
Number of Options
March 31,
2006
Number of Options
David Bonderman* ................................................................................................
-
100,000
Emmanuel Faber** ................................................................................................
50,000
50,000
Klaus Kirchberger** ................................................................................................
50,000
50,000
Kyran McLaughlin* ................................................................................................
-
100,000
Michael O’Leary*** ................................................................................................
81,240
81,240
James R. Osborne*................................................................................................
-
100,000
Paolo Pietrogrande* ................................................................................................
-
100,000
T. Anthony Ryan* ....................................................................................................................
-
100,000
All figures have been adjusted for 2:1 stock split on February 26, 2007
Directors not referred to above held no shares or share options.
*
These options were granted to these directors at 1.85 (the market value at date of grant) during the year ended
March 31, 2001 and were exercisable between June 2005 and June 2007.
**
These options were granted to these directors at 2.83 each (the market value at date of grant) during the year ended
March 31, 2003 and are exercisable between June 2007 and June 2009.
***
These options were granted to Michael O’Leary as follows: 35,402 in fiscal 2003 at 2.86 and 45,838 in fiscal 2004 at
2.21 (the market value at date of grant), in either case under the 2003 share option plan these are exercisable between
2009 and 2011.

72
21 Finance expense
Year ended
March 31,
2007
Year ended
March 31,
2006
000
000
Interest payable on bank loans wholly repayable after five years ............
82,891
73,758
Interest arising on pension liabilities, net (see note 22)............................
(15)
200
82,876
73,958
22 Pensions
The Group accounts for pensions in accordance with IAS 19, “Employee Benefits,” (IAS 19).
The Company operates defined benefit and defined contribution schemes.
(i) Defined benefit schemes.
The Group funds the pension entitlements of certain employees through defined benefit plans. Two
plans are operated for eligible Irish and UK employees. In general, on retirement, a member is entitled to
pension calculated at 1/60th of final pensionable salary for each year of pensionable service, subject to a
maximum of 40 years. Theses plans are fully funded on a discontinuance basis and the related pension costs
and liabilities are assessed in accordance with the advice of a professionally qualified actuary. The
investments of the plans at March 31, 2007 consisted of units held in independently administered funds.
The most recent full actuarial valuations of the plans were carried out at December 31, 2003 in accordance
with local regulatory requirements using the projected unit credit method and the valuation reports are not
available for public inspection. A new 3 year actuarial evaluation is currently underway.
The 2003 actuarial report showed that at the valuation date the market value of the scheme’s assets
was 11.5m, which was sufficient to cover more than 100% of the accrued liabilities, based on current
earnings and 78% of the accrued liabilities allowing for expected future increases in earnings. The actuarial
report recommends payment of contributions at 11.5% of staff and 17.8% of pilots’ pensionable salaries
respectively, which is an increase from previous contribution rates, intended to make good the shortfall on
accrued liabilities allowing for expected future increases in earnings. These rates may be revised following
the new actuarial valuation.
A separate annual actuarial valuation has been performed for the purposes of preparing these financial
statements. The principal actuarial assumptions used for the purpose of this actuarial valuation were as
follows:
At March 31,
2007
2006
%
%
Discount rate used for Irish plan ......................................................................................
4.75
4.75
Discount rate used for UK plan........................................................................................
5.35
4.90
Return on plan assets for Irish plan ..................................................................................
6.95
6.61
Return on plan assets for UK plan ...................................................................................
7.38
6.93
Rate of Euro inflation.......................................................................................................
2.50
2.25
Rate of UK inflation.........................................................................................................
2.75
2.75
Future pension increases in Irish plan ..............................................................................
0.00
2.75
Future pension increases in UK plan................................................................................
2.75
2.75
Future salary increases for Irish plan ...............................................................................
3.50
3.25
Future salary increases for UK plan .................................................................................
3.75
3.75

73
The Group uses certain mortality rate assumptions when calculating scheme obligations. Both the
Irish and UK schemes use the PMA/PFA92 mortality tables for calendar year 2020, for current employees,
which include sufficient allowance for future improvements in mortality rates. Retirement ages for scheme
members are 60 for pilots and 65 for staff. The current life expectancies underlying the value of the scheme
liabilities for the Irish and UK schemes are the following.
At March 31,
2007
Years
Retiring at age 60:
Male .................................................................................................................................
24.4
Female..............................................................................................................................
27.4
Retiring at age 65:
Male .................................................................................................................................
19.8
Female..............................................................................................................................
22.8
The amount recognised in the consolidated balance sheet in respect of our defined benefit plans is as
follows:
At March 31,
2007
2006
000
000
Present value of benefit obligations ..........................................................................
(35,596)
(33,367)
Fair value of plan assets............................................................................................
28,616
24,690
Present value of net obligations ................................................................................
(6,980)
(8,677)
Related deferred tax asset .........................................................................................
872
1,084
Net pension (liability) ...............................................................................................
(6,108)
(7,593)
The amount recognised in the consolidated income statement in respect of our defined benefit plans is
as follows:
Year ended
March 31,
2007
Year ended
March 31,
2006
000
000
Included in payroll costs
Service cost...............................................................................................................
1,722
1,812
Included in finance costs
Interest on pension scheme liabilities .......................................................................
1,682
1,460
Expected return on plan assets ..................................................................................
(1,697)
(1,260)
Net finance costs.......................................................................................................
(15)
200
Net periodic pension cost..........................................................................................
1,707
2,012

74
Analysis of amounts included in the Statements of Recognised Income and Expense (SORIE);
Year ended
March 31,
2007
Year ended
March 31,
2006
000
000
Actual return less expected return on pension scheme assets....................................
748
3,531
Experience gains on scheme liabilities .....................................................................
1,586
62
Changes in assumptions underlying the present value of scheme liabilities .............
(62)
(934)
Actuarial gains recognised in the SORIE..................................................................
2,272
2,659
Related deferred tax asset/(liability) .........................................................................
(284)
(332)
Net actuarial gains recognised in the SORIE ............................................................
1,988
2,327
Changes in the present value of the defined benefit obligation of the plans are as follows:
At March 31,
2007
2006
000
000
Projected benefit obligation at beginning of year .....................................................
33,367
29,213
Service cost...............................................................................................................
1,722
1,812
Interest cost...............................................................................................................
1,682
1,460
Plan participants’ contributions ................................................................................
642
681
Actuarial (gain)/loss..................................................................................................
(1,783)
978
Benefits paid .............................................................................................................
(294)
(672)
Foreign exchange rate changes .................................................................................
260
(105)
Projected benefit obligation at end of year................................................................
35,596
33,367
Changes in fair values of the plans’ assets are as follows:
At March 31,
2007
2006
000
000
Fair value of plan assets at beginning of year ...........................................................
24,690
18,585
Actual gain on plan assets.........................................................................................
2,272
4,867
Employer contribution ..............................................................................................
1,133
1,305
Plan participants’ contributions ................................................................................
642
681
Benefits paid .............................................................................................................
(294)
(672)
Foreign exchange rate changes .................................................................................
173
(76)
Fair value of plan assets at end of year .....................................................................
28,616
24,690

75
The fair value of the plans’ assets at March 31 is analysed as follows:
At March 31,
2007
2006
000
000
Equities .....................................................................................................................
22,949
20,147
Bonds........................................................................................................................3,173
2,469
Property ................................................................................................
1,150
1,012
Other assets................................................................................................
1,344
1,062
Total fair value of plan assets ................................................................
28,616
24,690
The plans’ assets do not include any of our own financial instruments, nor any property occupied by,
or other assets used by us.
The expected long-term rate of return on assets of 6.95% for the Irish Scheme was calculated based on
the assumptions of the following returns for each asset class: Equities 7.25%; Bonds 3.76%; Property
6.25%; and Cash 2.5%. The expected long-term rate of return on assets of 7.38% for the UK Scheme was
calculated based on the assumptions of the following returns for each asset class: Equities 7.75%; Corporate
and Overseas Bonds 5.35%; UK Government Bonds 4.5%; and Other 4.75%.
Since there are no suitable euro-denominated AA rated corporate bonds, the expected return is
estimated by adding a suitable risk premium to the rate available from Government bonds. The
assumptions are based on long-term expectations at the beginning of the reporting period and are expected
to be relatively stable.
The history of the plans for the current and prior period is as follows:
At March 31,
2007
2006
2005
000
000
000
Difference between expected and actual return on assets ................................
748
3,531
952
Expressed as a percentage of scheme assets .............................................................
3%
14%
5%
Experience gains/(losses) on scheme liabilities ........................................................
1,586
62
(242)
Expressed as a percentage of scheme liabilities ........................................................
4%
-
(1%)
Total actuarial gains/(losses).....................................................................................
2,272
2,659
(3,419)
Expressed as a percentage of scheme liabilities ........................................................
6%
8%
(12%)
We expect to contribute approximately 0.9m to our defined benefit plans in 2008.
(ii) Defined contribution schemes
The Group operates defined contribution retirement plans in Ireland and the UK. The costs of these
plans are charged to the consolidated income statement in the period they are incurred. The pension cost of
these defined contribution plans was 0.7m in 2007 (2006: 1.4m).

76
23 Earnings per share
Basic earnings per ordinary share (EPS) for Ryanair Holdings plc for the years ended March 31, 2007
and March 31, 2006 has been computed by dividing the profit attributable to shareholders by the weighted
average number of ordinary shares outstanding during the year.
Diluted earnings per share, which takes account solely of the potential future exercise of share options
granted under the Group’s share option schemes, is based on the weighted average number of shares in
issue of 1,557,502,826 (2006: 1,543,562,546) including weighted average share options assumed to be
converted of 13,045,390 (2006: 9,897,542).
Reconciliation of adjusted EPS
At March 31,
2007
2006
cent
cent
Basic EPS .................................................................................................................
28.20
20.00
Adjusted by:
Aircraft insurance claim............................................................................................
-
(0.34)
Release of income tax overprovision ........................................................................
(2.21)
-
Adjusted basic EPS...................................................................................................
25.99
19.66
Adjusted diluted EPS ................................................................................................
25.77
19.53
Number of ordinary shares (in 000’s) used for EPS and adjusted EPS*
Basic ........................................................................................................................
1,544,457
1,533,666
Diluted .....................................................................................................................
1,557,503
1,543,562
Details of share options in issue have been described more fully in note 15
* Adjusted for share split of 2 for 1 which occurred on February 26, 2007
24 Commitments and contingencies
Commitments
In January 2002, the Group entered into a contract with The Boeing Company (“Boeing”) (the “2002
Boeing contract”); whereby the Group agreed to purchase 100 new Boeing 737-800 “next generation”
aircraft, and received purchase rights to acquire a further 50 such aircraft. The 2002 Boeing contract was
superceded by a contract entered into with Boeing in January 2003 (the “2003 Boeing contract”) whereby
the Group agreed to purchase 125 new Boeing 737-800 “next generation” aircraft, thus adding “firm”
orders for 22 aircraft to the existing “firm” orders (100 “firm” plus 3 options exercised) under the 2002
Boeing contract. In addition, the Group acquired purchase rights over a further 78 aircraft, bringing the
number of option aircraft to 125.
In February 2005, the Group entered into a contract with Boeing (the “2005 Boeing contract”)
whereby the Group agreed to purchase 70 new Boeing 737-800 “next generation” aircraft and acquired
additional purchase rights to acquire a further 70 such aircraft over a 5 year period from 2006 to 2011. The
aircraft to be delivered after January 1, 2005, arising from the 2002 and 2003 Boeing contracts, benefit
from the discounts and concessions under the 2005 Boeing contract. In addition, the orders for the 89
“firm” aircraft still to be delivered at January 1, 2005 and the remaining additional purchase rights in
respect of 123 aircraft granted under the 2002 and 2003 Boeing contracts are governed by the 2005 Boeing
contract from January 2005.

77
In June 2006 the Group exercised 10 options under the 2005 contract whereby it will increase its firm
aircraft deliveries by this amount during fiscal 2008 (3) and 2009 (7).
In August 2006 the Group exercised 32 options under the 2005 contract whereby it will increase its
“firm” aircraft deliveries by this amount during fiscal 2009 (22) and 2010 (10).
The table below details the firm aircraft delivery schedule at March 31, 2007 and March 31, 2006 for
the Group respectively:
Aircraft
Delivered at
March 31,
2007
Firm Aircraft
Deliveries
Fiscal 2008-2012
Total “Firm”
Aircraft
Basic price
per aircraft
(U.S.$’m)
Firm Aircraft
Deliveries
Fiscal 2007-
2012 at
March 31,
2006
2002 Contract .......................
80
23
103
50.885
51
2003 Contract .......................
24
-
24
50.889
1
2005 Contract .......................
1
125
126
50.916
84
Total......................................
105
148
253
136
The “Basic Price” (equivalent to a standard list price for an aircraft of this type) for each aircraft
governed by the 2005 Boeing contract will be increased by (a) an estimated U.S.$900,000 per aircraft for
certain “buyer furnished” equipment the Group has asked Boeing to purchase and install on each of the
aircraft, and (b) an “Escalation Factor” designed to increase the Basic Price of any individual aircraft by
applying a formula which reflects increases in the published U.S. Employment Cost and Producer Price
indices between the time the Basic Price was set and the period of 6 months prior to the delivery of such
aircraft.
Boeing has granted Ryanair certain price concessions with regard to the Boeing 737-800 “next
generation” aircraft. These take the form of credit memoranda to the Group for the amount of such
concessions, which the Company may apply toward the purchase of goods and services from Boeing or
toward certain payments, in respect of the purchase of the aircraft under the various Boeing contracts.
Boeing and CFMI (the manufacturer of the engines to be fitted on the purchased aircraft) have also
agreed to give the Group certain allowances in addition to providing other goods and services to the Group
on concessionary terms. These credit memoranda and allowances will effectively reduce the price of each
aircraft to the Group. As a result, the effective price of each aircraft will be significantly below the Basic
Price mentioned above. At March 31, 2007, the total potential commitment to acquire all 148 “firm”
aircraft, not taking such increases and decreases into account, will be up to U.S.$7.53 billion. (At March
31, 2006 the potential commitment was U.S.$6.9 billion to acquire 136 “firm” aircraft).

78
a)
Total future minimum payments due under operating leases
At March 31,
2007
2006
000
000
Due within one year ..................................................................................................
75,322
45,097
Due between one and two years................................................................................
75,322
45,097
Due between two and three years .............................................................................
75,322
45,097
Due between three and four years .............................................................................
69,320
45,097
Due between four and five years...............................................................................
44,277
39,314
Due after five years...................................................................................................
44,471
14,194
Total..........................................................................................................................
384,034
233,896
The above table sets out the committed future cost of leasing 32 (2006:17) Boeing 737-800 “next
generation” aircraft at March 31, 2007 and 2006, respectively.
b)
Commitments resulting from the use of derivative financial instruments by the Group are described
in notes 5 and 11.
Contingencies
c)
The Group is engaged in litigation arising in the ordinary course of its business. Management does
not believe that any such litigation will individually or in aggregate have a material adverse effect on the
financial condition of the Group. Should the Group be unsuccessful in these litigation actions,
management believes the possible liabilities then arising cannot be determined but are not expected to
materially adversely affect the Group’s results of operations or financial position.
d)
The Group has also entered into a series of interest rate swaps to hedge against fluctuations in
interest rates for certain floating rate financing arrangements. Cash deposits have been set aside as
collateral to mitigate certain counterparty risk of fluctuations on long-term derivative and other financing
arrangements (“restricted cash”) (see note 11 for further details). Additional numerical information on
these swaps and on other derivatives held by the Group is set out in notes 5 and 11 of the financial
statements.
e)
In February 2004, the European Commission ruled that Ryanair had received illegal state aid from
the Walloon regional government in connection with its establishment of a low cost base at Brussels
(Charleroi).
Subsequently Ryanair was requested by the regional government to repay all deemed illegal state aid,
but in accordance with the Commission ruling Ryanair may deduct various costs incurred in establishing
its base at Brussels (Charleroi) from this amount. Ryanair has advised the regional government that it
believes no money is repayable as the cost of establishing the base exceeded the amount determined to
be illegal state aid.
Ryanair is also appealing the decision of the European Commission to the European Court of First
Instance, requesting that the Court annul the decision on the basis that Ryanair’s agreement at Brussels
(Charleroi) was consistent with agreements at similar privately owned airports and therefore did not
constitute illegal state aid. The Company has placed 4m in an escrow account pending the outcome of
this appeal
.

79
25 Note to cash flow statements
At March 31,
2007
2006
000
000
Net funds at beginning of year ..................................................................................
294,243
190,848
(Decrease)/increase in cash and cash equivalents in year .........................................
(92,585)
566,746
Movement in financial assets > 3 months .................................................................
263,847
(200,480)
Movement in restricted cash .....................................................................................
54,768
-
Net cash flow from (increase) in debt .......................................................................
(184,338)
(262,871)
Movement in net funds resulting from cash flows ....................................................
41,692
103,395
Net funds at end of year ............................................................................................
335,935
294,243
Analysed as:
Cash & restricted cash ..............................................................................................
2,198,001
1,971,971
Total borrowings.......................................................................................................
(1,862,066)
(1,677,728)
Net funds
335,935
294,243
Net funds arise when cash and liquid resources exceed debt.
26 Post balance sheet events
A share buy back which was approved at the 2006 AGM was formally announced on June 5, 2007.
With effect from June 7, 2007 the Company planned to repurchase up to 300m worth of shares. The buy
back is expected to take place at anytime up to September 20, 2007 (the 2007 AGM) for a total maximum of
77,171,868 shares. To date the Company had repurchased 37.6 million shares at a total cost of 187m.
Since the year end the Company has entered into sale agreements for the disposal of 20 Boeing 737-
800 aircraft in the period September 2006 to April 2010.
Ryanair is in the process of preparing an appeal to the European Court of First Instance against a
decision by the European Commission prohibiting its proposed acquisition of Aer Lingus, following the
initial public offering of the Irish flag carrier airline. Subsequent to the year end, Ryanair increased its
stake in Aer Lingus plc by a further 4.2%, taking its shareholding from 25.2% at March 31, 2007 to over
29.4% at August 21, 2007, at a total cost of 392m which amounted to an average cost of 2.52 per share.
Ryanair offered remedies to the Commission in the first phase of the Commission’s merger investigation,
something that has not been done in other previous airline mergers, including Air France/KLM. Despite
demonstrating that the merger of these two airlines would have significant consumer benefits and
efficiencies, and despite offering substantial remedies – including guaranteed fare and fuel levy
reductions/eliminations, and large numbers of slot surrenders – the Commission nevertheless prohibited the
merger in June 2007. Ryanair has two months from the date of decision to submit an appeal.
In April 2007 the Group exercised 27 options under the 2005 contract with the Boeing Company
whereby it will increase its “firm” aircraft deliveries by this amount during fiscal 2010.

80
27 Subsidiary undertakings and related party transactions
The following are the principal subsidiary undertakings of Ryanair Holdings plc:
Name
Effective date of
acquisition/incorporation
Registered
Office
Nature of
Business
Ryanair Limited ..........................
August 23, 1996
Corporate Headquarters
Airline operator
(acquisition)
Dublin Airport
Co Dublin
Darley Investments Limited*......
August 23, 1996
Corporate Headquarters
Investment holding
(acquisition)
Dublin Airport
Company
Co Dublin
Ryanair.com Limited* ................
August 23, 1996
Corporate Headquarters
International data
(acquisition)
Dublin Airport
processing services
Co Dublin
Coinside Limited*.......................
August 8, 2006
Corporate Headquarters
Investment holding
(incorporation)
Dublin Airport
Company
Co Dublin
*
These subsidiaries are wholly owned by Ryanair Limited, which is, in turn, wholly owned by Ryanair
Holdings plc.
All of the above subsidiaries are 100% owned by the Group. The shares owned by the Group
comprise one class (ordinary shares) in respect of each subsidiary.
Information regarding all other subsidiaries will be filed with the Company’s next Annual Return as
provided for by S.16 (3) (a) of Companies (Amendment) Act, 1986.
In accordance with the basis of consolidation policy as described in note 1 of these financial
statements, the subsidiary undertakings referred to above have been consolidated in the financial statements
of Ryanair Holdings plc for the years ended March 31, 2007 and March 31, 2006.
The total amount of remuneration paid to senior key management (defined as the executive team
reporting to the Board) in the Group amounted to 3.4m in the year (2006: 3.1m) the majority of which
comprises short term employee benefits.

81
Company Balance Sheet
At March 31,
2007
2006
Note
000
000
Non-current assets
Investments in subsidiaries ............ ....................................................................
29
79,338
75,403
Current assets
Loans and receivables from subsidiaries ....................................................................
30
581,065
569,831
Total assets .......................................................................................................
660,403 645,234
Current liabilities
Amounts due to subsidiaries ..............................................................................
31
35,172 35,172
Shareholders’ equity
Issued share capital ............................................................................................
15
9,822 9,790
Share premium account .....................................................................................
15
607,433 596,231
Retained earnings...............................................................................................
15
632 632
Other reserves ................................................................................................ 15
7,344 3,409
Shareholders’ equity........................................................................................
33
625,231 610,062
Total liabilities and shareholders’ equity.......................................................
660,403 645,234
On behalf of the Board
M. O’Leary D. Bonderman
Director Director
August 21, 2007

82
Company Cash Flow Statement
Year ended
March 31,
2007
Year ended
March 31,
2006
000
000
Investing activities
(Increase) in loans to subsidiaries………………………….
(11,234)
(30,590)
Net cash used in investing activities .................................
(11,234)
(30,590)
Financing activities
Net proceeds from share issued………………………........
11,234
30,590
Net cash provided by financing activities ........................
11,234
30,590
Movement in cash and cash equivalents..........................
-
-
Cash and cash equivalents at beginning and end of year
-
-
The Company had no recognised income or expenses for the year and accordingly the amount
recorded in the Statement of Recognised Income and Expense was Nil (2006 Nil). A reconciliation of
movements in shareholders’ funds has been included in note 33.

83
Notes- forming part of the Company Financial statements
28 Basis of preparation
The Parent’s financial statements have been prepared in accordance with International Financial
Reporting Standards (IFRS) as adopted by the European Union (EU) that are effective for the year ended
and as at March 31, 2007, as applied in accordance with the Companies Acts 1963 to 2006. On publishing
company financial statements together with Group financial statements the Company is taking advantage of
the exemption contained in Section 148(8) of the Companies Act 1963 not to present its individual income
statement and related notes that form a part of these approved financial statements.
The Company financial statements are presented in euro, rounded to the nearest thousand, being its
functional currency. They are prepared on an historical cost basis except for certain share based payment
transactions, which are based on fair values determined at grant date.
The preparation of financial statements requires management to make judgements, estimates and
assumptions that affect the application of policies and reported amounts of assets, liabilities, income and
expenses. These estimates and associated assumptions are based on historical experience and various other
factors believed to be reasonable under the circumstances, the results of which form the basis of making the
judgements about carrying values of assets and liabilities that are not readily apparent from other sources.
Actual results could differ materially from these estimates. These underlying assumptions are reviewed on
an ongoing basis. Revisions to accounting estimates are recognised in the period in which the estimate is
revised if the revision affects only that period, or in the period of the revision and future periods if these are
also affected. Principal sources of estimation uncertainty have been set out in the critical accounting policy
section on page 20 of the operating and financial review.
Statement of compliance
The Parent entity financial statements have been prepared in accordance with IFRS as adopted by the
EU that were effective at March 31, 2007 as applied in accordance with the Companies Acts 1963 to 2006.
The following provides a brief outline of the likely impact on future financial statements of relevant
IFRSs adopted by the EU which are not yet effective and have not been early adopted in these financial
statements:
•
Amendment to IAS 1 – Capital Disclosures (effective for annual periods beginning on or after January 1,
2007): this amendment will require additional disclosure about our capital structure;
•
IFRS 7 – Financial Instruments: Disclosures (effective for annual periods beginning on or after January 1,
2007. This will require us to make further disclosures relating to our financial instruments than are
currently required under IAS 32.
•
IFRIC 9 – Reassessment of Embedded Derivatives (effective for annual periods beginning on or after
June 1, 2006) deals with the requirement of an entity to re-assess embedded derivatives during the life of
the underlying contract. This interpretation is not expected to have any material effect on the Company’s
future financial statements.

84
•
IFRIC 11 – IFRS 2 Group and Treasury Share Transactions (effective for annual periods beginning on or
after March 1, 2007) addresses how share based payment arrangements that affect more than one
company in a Group are accounted for in each company’s financial statements. This is not expected to
result in any material change in the way that share based payment transactions are accounted for by the
Company.
Share based payments
The Company accounts for the fair value of share options granted to employees of a subsidiary as an
increase in its investment in that subsidiary. The fair value of such options is determined in a consistent
manner to that set out in the Group share based payment accounting policy and as set out in note 15 (c).
Income taxes
Income taxes are accounted for by the Company in a manner consistent to that set out in the Group
income tax accounting policy.
Financial assets
The Parent entity holds investments in subsidiary companies, which are carried at cost less any
impairments.
Guarantees
The Company occasionally guarantees certain liabilities of subsidiary companies. These are
considered to be insurance arrangements and are accounted for as such i.e. a contingent liability until such
time as it becomes probable that the Company will be required to make a payment under the guarantee.
Loans and borrowings
All loans and borrowings are initially recorded at the fair value of consideration received, net of
attributable transaction costs. Subsequent to initial recognition, non-current interest bearing loans are
measured at amortised cost, using the effective interest yield methodology.
29 Investments in subsidiaries
Year ended
March 31,
2007
Year ended
March 31,
2006
000
000
Balance at start of year
75,403
72,482
New investments in subsidiaries by way of share option grant to subsidiary employees
3,935
2,921
Balance at end of year
79,338
75,403

85
30
Loans and receivables from subsidiaries
Year ended
March 31,
2007
Year ended
March 31,
2006
000
000
Due from Ryanair Limited (subsidiary) ................................................................
581,065
569,831
581,065
569,831
All amounts due from subsidiaries are repayable upon demand.
31
Amounts due to subsidiaries
Year ended
March 31,
2007
Year ended
March 31,
2006
000
000
Due to Ryanair Limited .........................................................................................
35,172
35,172
35,172
35,172
At March 31, 2007, Ryanair Holdings plc had borrowings of 35,171,745 (2006: 35,171,745) from Ryanair Limited. The loan is repayable on
demand
32 Financial Instruments
The Company does not undertake hedging activities on behalf of itself or other companies within the
Group. Financial instruments in the Company primarily take the form of loans to subsidiary undertakings.
Amounts due to or from subsidiary undertakings (primarily Ryanair Limited) in the form of inter
company loans are interest free and are repayable upon demand and further details of these have been given
in notes 30 and 31. These inter company balances are eliminated in the Group consolidation.
The euro is the functional and presentation currency of the Company’s balance sheet and all
transactions entered into by the Company are euro denominated. As such, the Company does not have any
significant foreign currency risk.
The credit risk associated with the Company’s financial assets principally relates to the credit risk of
the Ryanair Group as a whole, which is not rated by an external rating agency. Additionally the Company
had guaranteed certain of its subsidiary company liabilities. Details of these arrangements are given in note
34.

86
33 Reconciliation of movement in Shareholders’ Equity
Ordinary
shares
Share
premium
account
Retained
earnings
Other
Reserves
Total
000
000
000
000
000
Balance at April 1, 2005
9,675
565,756
632
488
576,551
Issue of ordinary equity shares (net of issue costs)................................
115
30,475
-
-
30,590
Share-based payments ...................................................................................
-
-
-
2,921
2,921
Balance at March 31, 2006 ..............................................................
9,790
596,231
632
3,409
610,062
Issue of ordinary equity shares (net of issue costs)................................
32
11,202
-
-
11,234
Share-based payments ...................................................................................
-
-
-
3,935
3,935
Balance at March 31, 2007 ..............................................................
9,822
607,433
632
7,344
625,231
34 Contingencies
a) The Company has provided 9.8m in letters of guarantee to secure obligations of subsidiary
undertakings in respect of loans and bank advances.
b) In order to avail itself of the exemption contained in Section 17 of the Companies (Amendment) Act,
1986, the holding company, Ryanair Holdings plc, has guaranteed the liabilities of its subsidiary
undertakings registered in Ireland. As a result, the subsidiary undertakings have been exempted from the
provisions of Section 7 of the Companies (Amendment) Act, 1986. Details of the Group’s principal
subsidiaries have been included at note 27. The Irish subsidiaries of the Group covered by the Section 17
exemption are listed at note 27 also. One additional Irish subsidiary covered by this exemption, which is not
listed as a principal subsidiary at note 27 is Airport Marketing Services Limited.
35
Date of Approval
The Consolidated and Company financial statements were approved by the Board on August 21, 2007.

87
Directors and other Information
Directors D. Bonderman Chairman
M. O’Leary Chief Executive
E. Faber
M. Horgan
K. Kirchberger
K. McLaughlin
J. Osborne
P. Pietrogrande
T. A. Ryan
Secretary J. Callaghan
Registered Office Corporate Headquarters
Dublin Airport
Co. Dublin
Ireland
Auditors KPMG – Chartered Accountants
1 Stokes Place
St. Stephens Green
Dublin 2
Ireland
Bankers Bank of Ireland
Dublin Airport
Co Dublin
Ireland
Barclays Bank Ireland PLC
Two Park Place, Hatch Street,
Dublin 2
Ireland
Barclays Bank PLC
1 Churchill Place
Canary Wharf
London, E14 5HP
United Kingdom
Solicitors & A&L Goodbody - Solicitors
Attorneys at Law IFSC
North Wall Quay
Dublin 1
Ireland
Cleary, Gottlieb, Steen & Hamilton LLP
One Liberty Plaza, New York
NY 10006, United States

88
Wyszukiwarka
Podobne podstrony:
Gor±czka o nieznanej etiologii
02 VIC 10 Days Cumulative A D O Nieznany (2)
Abolicja podatkowa id 50334 Nieznany (2)
45 sekundowa prezentacja w 4 ro Nieznany (2)
4 LIDER MENEDZER id 37733 Nieznany (2)
Mechanika Plynow Lab, Sitka Pro Nieznany
katechezy MB id 233498 Nieznany
2012 styczen OPEXid 27724 Nieznany
metro sciaga id 296943 Nieznany
Mazowieckie Studia Humanistyczn Nieznany (11)
cw 16 odpowiedzi do pytan id 1 Nieznany
perf id 354744 Nieznany
DO TEL! 5= Genetyka nadci nieni Nieznany
Opracowanie FINAL miniaturka id Nieznany
3 Podstawy fizyki polprzewodnik Nieznany (2)
interbase id 92028 Nieznany
Mbaku id 289860 Nieznany
Probiotyki antybiotyki id 66316 Nieznany
więcej podobnych podstron