
V
ERSION
2.0
A
UGUST
2003
T
HE READER IS ASSUMED TO HAVE THOROUGH
KNOWLEDGE OF OEE AND RELATED ISSUES
.
@
info@oeetoolkit.com
L
www.oeetoolkit.com
©
2003
A
RNO
K
OCH

2 / 30
Content
Preface
3
The History of the OEE Industry Standard
7
Section 1:
Scope 9
1.1
Brief description of different scopes
10
1.1.1
OEE Solitaire
10
1.1.2
OEE
10
1.1.3
OEE Top
10
1.1.4
Operations Effectiveness
11
1.1.5
Asset Utilization
11
1.1.6
Gross Utilization
11
1.1.7
Net Utilization (=TEEP)
11
Section 2:
Definition of several types of time
12
2.1
Groups and types of Time usages
13
2.1.1
Production time
13
2.1.2
Failure time
14
2.1.3
Idle time
15
2.1.4
Line restraint time
19
2.1.5
Unscheduled time
20
2.1.6
Idle Time registered as Unscheduled Time
22
Section 3:
Speed definitions
24
3.1
Time versus Quantity
24
3.2
Maximum speed of what?
24
3.3
Name Plate Capacity (NPC)
24
3.4
The Standard
25
3.5
How maximum is maximum speed?
26
Section 4:
Quality definitions
27
Section 5:
Discussion issues
28
About the company
30
3 / 30
Preface
“Just scrape the barrel” was the title of a cover story about organizations published in
“Intermediair”, a professional Dutch journal read by many managers. “We don’t need to pump
more money into it, we should work more efficiently”, is what several politicians said.
“Productivity can only be increased by making massive investments into ICT”, is another
frequently heard statement. “For reasons of efficiency, maintenance is being outsourced”, is
another favorite saying.
When you look for a deeper meaning behind these types of slogans, you will first encounter
an enormous confusion of concepts. What is actually meant by efficiency, effectiveness, and
productivity? And is it indeed true that improvements in this area always involve large
investments, or is that precisely not the right thing to do?
Efficiency, effectiveness, and productivity ….
What is the relationship between efficiency, effectiveness and productivity and what is the
path that can be followed to bring about ‘improvement’.
Efficiency is determined by the amount of time, money, and energy – i.e. resources – that
are necessary to obtain certain results. In order to meet our daily production quota, we
commit a specific machine that uses up energy, make operators and maintenance personnel
available, and provide raw materials. For example, if we are able to meet our daily production
with less energy and fewer operators, we have operated more efficiently.
Effectiveness is determined by comparing what a process or installation can produce with
what they actually produce; therefore, effectiveness does not tell anything about the
efficiency – the amount of resources that have to be committed to obtain that output. If we
are successful in manufacturing more good product in the same time period, effectiveness
will increase.
Productivity is determined by looking at the production obtained (effectiveness) versus the
invested effort in order to achieve the result (efficiency); in other words, if we can achieve
more with less effort, productivity increases.
Process
Machine
Line
Efficiency Effectiveness
Productivity
The amount of
resources needed to
execute the process
The ratio between
the actual and the
theoretical output
The ratio between
efficiency and
effectiveness

4 / 30
Goldrath (‘The Goal’) defines productivity as: ‘the extent in which a company generates
money’. The goal of a production company is therefore not to reduce expenses but to
generate as much money as possible!
Is improvement still possible?
Most striking when looking at the traditional approach to improvement, is that focus is often
exclusively on efficiency; the famous cheese slicer continuous to slice production further and
further.
How much room for improvement is still left at the input (efficiency) side? 10%? 20%? And
does it still make sense to try to reduce another operator or engineer, or to put pressure on
the buyers to negotiate even more competitive prices?
As is often the case, that question can not directly be answered. If the supplier can give us a
better price because we help him with managing his production process better or – as we
see in the automotive-industry – we force the supplier to go through basic improvement
processes, such as Lean Manufacturing or TPM, not only the price will decrease, but the
quality and the reliability in delivery will increase as well. That is good news for both parties.
However, by managing solely by keeping the cost price down, you run a large risk of saving
pennies per product but losing many euros or dollars due to stoppages, quality losses, etc.;
in other words, ‘penny wise, pound foolish’. Many production teams can give you striking
examples of that.
Increasing output
We strangely look less often at the output side – the effectiveness – of the equipment.
Apparently, the output is more or less considered to be ‘as it is’. However, every line
manager knows that the installation will spontaneously start to run better simply by standing
beside it and giving it attention. When you check the logbooks, there are days that, on
occasion, the installation produced spectacular amounts of good output.
It happened to go well that day…
Ask the team how that happened and you will hear a precise run-down of all elements that
went right that day. The raw materials arrived on time and were of the correct quality, the
installation kept on running and was set correctly, the right people were present, it was not
too warm, etc., etc. This is often regarded as a fluke and nobody is wondering how you could
create a similar situation a second time. That is strange actually, for if it can happen once,
why should it not be possible to happen again. And if it can happen a second time, why not
always? Usually, a whole series of ”Yes, but’s” will follow…
Suppose you would write down those “Yes, but’s” and turn them into a list of action items.
What would that give us?
To be able to answer that question, we will have to dive a little deeper into the world of
Effectiveness.

5 / 30
Our machines run non-stop!
What determines the effectiveness of an installation? First of all we must address the
question of whether it does or does not run. Roughly there can be three reasons why an
installation is not running:
• The installation quit; it broke down.
• The installation could be running technically speaking, but is waiting for something;
materials, an operator, filling, to be set-up, etc.
• The installation could be running, but is not planned in because there is more
capacity than demand.
Of course, the ideal machine would never break down and would never have to wait for
anything; therefore, it would be running all the time as long as there is demand for the
product.
Our machines run at top speed!
Subsequently, the effectiveness is determined by the speed at which the installation is
running. This is always a tricky topic, for what is the maximum speed? The speed at which it
is at the verge of breaking down? Or the speed at which the quality of the output reaches the
bottom limit of its spec? This will guarantee a lively discussion. It is useful to see that it is
often simply unknown what the maximum speed is, while the maximum speed that people
come up with is usually based on various assumptions (which, in turn, you could turn into an
interesting list of action points!). An example of such assumption is: “If I ran the machine any
faster and the material got jammed, we would suffer major damage”. Why does it get
jammed? Is that always the case? When not? What must happen to prevent it from jamming
again? Why does damage occur when it gets jammed? What do you have to do in order
to…. etc.
We have ‘zero defects’!
If the actual speed is determined versus the theoretical speed, the next effectiveness
determining factor can be looked at: Does the realized output meet the set quality standards?
It can be quite an eye opener, if you ask ten different people on the shop floor to indicate
very clearly when a product does or does not meet the specs, you will receive ten different
answers. It becomes even worse when it turns out that the one who produces the product,
the operator, cannot determine, or cannot unequivocally determine this. Also here lie many
opportunities to solve all “Yes but’s” and to ensure that the person who makes the product is
also able to determine whether he is manufacturing a good product, so that he can keep the
quality within pre-set specifications.
Are we ‘ideal’?
Thus, if there is demand, an ideal and effective machine is always running at maximum
speed without producing any out-of-spec products. We can assume this to be 100%
effective. We know that 100% effectiveness is impossible over a longer period of time; after
all, installations must sometimes be maintained and converted. The guideline is that 85% is a
realistic “World Class” value for “traditional” machines. That implies that the installation, for
example, produces 99% of the products “First Time Right within Specs”, operates at a speed
of 95% of the theoretical maximum speed, and is actually running 90% of the operating time
(99% quality x 95% speed x 90% running time = 85% effectiveness).

6 / 30
In a three-shift system it means that the installation runs for 90% x 24 hrs = 21:36 hrs at 95%
speed with 99% quality. Consequently, there will be 03:24 hrs available for maintenance,
conversion, and other possible waiting times. Incidentally, the 85% mentioned is a rather
conservative figure; nowadays we see in the automotive-industry equipment that runs over
90%.
The analysis of hundreds of installations for various processes shows that, as rule of thumb,
an average installation in an average (non-TPM) company runs at an effectiveness rate
between 35 and 45%. Of course, there are always cases that stick out; for example, values
in the pharmaceutical industry may lie considerably lower and there are also cases that show
considerably higher values.
If it turns out that an installation has an effectiveness of 40%, while people always thought
that there were limited options left for potential improvements, it is extremely good news: this
means that twice as much good product can be manufactured (your effectiveness rate would
be 80%!) at the present cost level. Or, you manufacture the same product with one shift
instead of two.
Yes, but then the costs will increase!
It is often assumed that achieving such improvements will necessitate an enormous increase
in costs for, for instance, maintenance. That is sometimes partly true, for example, when it
concerns overdue maintenance and you are then actually paying off a loan, because a
fundamental design flaw has to be solved (and, therefore, you can also see this as paying off
a postponed cost item). However, by activating the knowledge that is present on the shop
floor in the right way, 80% of the improvements can often be implemented without any capital
expenditures and at minimal costs.
It is not so hard to imagine that an installation, which halts on a regular basis for various
reasons, or whose process is not stable enough to operate at high speed without any losses
in quality, automatically requires more resources at the input side as well! Reversely, it may
be that lowering the efficiency (for instance, by spending a little bit more money and time on
preventive maintenance) will bring about a strong increase in effectiveness, which - bottom
line - creates a higher net productivity. Such considerations can only be made if, in addition
to efficiency, particular attention is paid to losses in effectiveness as well.
In all cases, it is necessary to take decisions concerning actions leading to improvement on
the basis of facts and figures describing the entire productivity picture.
World Class Manufacturing does not accept any losses at all. That is what management
must focus on and management must have the will to go further than mere window dressing
and scratching the surface. Unfortunately, that is often even harder than just opening the
wallet. Companies that do take this route, discover over and over again: There still lies a
nearly unlimited potential for improvement for those who learn to see it and seize it!
Arno Koch
Senior Consultant
7 / 30
The History of the OEE Industry Standard
Working as a sr. Lean consultant I noticed two things over and over again:
1.
Operators, line managers and management all either want to compare equipment, or
are afraid that this will be done.
2.
Setting up the definitions for gathering OEE data brings up the same discussions over
and over again. Larger companies all seem to struggle -most political- fights about
how OEE is defined, one wants to include PM, the other takes it out, and the third
takes it out under conditions... thus giving fear on the shop floor that 'unfair
comparisons' are done.
Ad 1. Although I feel OEE is a shop floor tool, not meant to benchmark, it is certainly
possible to use certain elements as useful reference information considering it is done
in the right way.
Ad 2. For every problem there is only one optimal solution. So why discover the wheel
again...
So I started to wonder if it would be possible to define a kind of an 'Industry Standard OEE
definition', that would make sure that at least within the same company everybody uses OEE
in the same way. i.e. if we are talking about 'Availability' at least it should be clear that
everybody in- or excludes the same issues (i.e. breaks, PM, etc).
What I did was this:
• I took ALL OEE registrations I had ever seen (quite some...) and figured out where
the common denominators were.
• I grouped all possible OEE elements in a logical way.
• I tried to give all 'negotiable' elements a clear definition.
• I validated every group as 'Production', 'Failure', 'Idle' or 'Unscheduled'.

8 / 30
At first I thought this would become a huge document since the equipment I looked at was
varying from refineries to cement- and paper mills to beer breweries, food processors,
drilling, stamping, welding, plating.... well you name it and is was there.
Guess what… I figured out the whole lot of it fits on a couple of A4!
Then I took this concept to some experienced OEE implementers and discussed every
element. Every time we had a discussion, I gave all arguments I had heard and tried to find
the Best Of Best argument, considering it had to be applicable on ANY other situation! In fact
this process is still going on, but the picture becomes quite clear.
It is my objective to have an OEE standard definition available where every choice is
companioned with very reasonable and strong argumentation, that (if I did my job well) can
not be refuted within the spirit of TPM and Lean Manufacturing.
Now, in 2003 many parties have joined us on this adventure and tried hard to ‘doubt’ every
element of the standard; yet the arguments given by the first group of forum-members stand
firm. However we have gathered some additions and clarifications which are added to this
version of the OEE Industry Standard.
I now want to invite every OEE using company to join us in this standard:
1. to check if the definition can stand up to new discussions;
2. to get broader support within the industry, so we get more unity in OEE
definitions.
If you would like to contribute to the discussion please let us know by sending an email to:
info@oeetoolkit.com
.
Arno Koch
9 / 30
Section 1: Scope
Several parties, such as production teams, line managers and top management may have a
different scope when looking at ‘effectiveness’. Being aware of those differences, it is
possible to calculate different indices representing those different scopes; all based upon
the same data. In the literature we find several attempts to do so, unfortunately they are not
always consistent.
Although this definition goes beyond the scope of OEE, it is necessary to have a clear picture
on this issue since it determines how to define certain categories within the OEE.
OEE Solitaire
OEE (top)
Operations Effectiveness
Net Utilization (=TEEP*)
Capacity Utilization
Asset Utilization
Total Operations time
Loading time
Running time (Production time)
Failures
Theoretical output
Actual output
Reduced
Speed
Good!
Scrap
Unscheduled (-)
Not scheduled
Total time (365 days x 24 hrs)
Line
restraint
Rework
Minor
stoppages
Idling

10 / 30
1.1 Brief description of different scopes
1.1.1 OEE
Solitaire
OEE Solitaire is only applicable in situations where the monitored equipment has a technical
link to other equipment/processes. Thus the equipment is an integrated part of a line. The
effectiveness of such equipment is partially depending on factors like line balance and
effectiveness of other equipment. ‘No Input’ (input buffer empty) and ‘No Output’ (Output
buffer full) are the exponents of such influences.
In certain case i.e. with huge installations in process industry parties may want to know the
effectiveness of the equipment independently from the rest of the process. In other words;
What would be the effectiveness of the equipment when it was running solitaire, with no
restraints from the rest of the line?
For this purpose, an OEE can be calculated excluding ‘No Input’ and ‘No Output’ thus
showing the effectiveness purely focussed on the equipment independent from the line.
Calculating the OEE Solitaire takes Line restraint time (normally considered to be (I) Idle
time) out of the loading time (so it is considered as Unscheduled time (-) ).
Caution: ‘No Input’/’No Output’ should not be confused with for example ‘no raw material’ or
‘no packaging’ since these have an other cause; they are not Line Restraints!
1.1.2 OEE
OEE is the default scope for a production team.
It shows the ratio between the theoretical maximum good output during the loading time vs
the actual good output.
The loading time can be less then the operations time since the equipment can be
unscheduled during the operations time, thus reducing the loading time. Loading time
therefore is the time the equipment was supposed to be running
In cases where several products have been produced, (either sequential or parallel) the
Performance part of the OEE is calculated as a weighted average between the several
expected output ranges.
1.1.3 OEE
Top
OEE Top is equal to OEE except for the way the performance rate is calculated. In OEE Top
the performance rate is calculated based upon the Name Plate capacity of the equipment;
thus ignoring restraints due to the product-machine combination. It is used to detect
effectiveness losses due to the chosen product mix.
11 / 30
1.1.4 Operations
Effectiveness
Operations effectiveness goes beyond the scope of the production team (Maintenance –
Operator – Engineer). It includes the operations time the equipment is not available to the
production team or operations management does not want or can not schedule the
equipment. Examples are [No Orders], [Legal Restrictions] like energy contracts and
mandatory holidays and test runs for R&D.
1.1.5 Asset
Utilization
The percentage of the total (calendar) time that the equipment runs.
1.1.6 Net Utilization (=TEEP)
Net utilisation reflects the ultimate improvement potential; it is the ratio between the total
(calendar) time and the actual effective production time (or, if you wish; the theoretical
maximum amount of good product versus the actual amount of good product coming out
during that time). In some publications you may find the same definition named TEEP; Total
Effective Equipment Performance.
1.1.7 Capacity
Utilization
(=Gross
Utilization)
Capacity Utilisation reflects the ratio between the total (calendar) time and the loading time. It
shows the hidden operations potential i.e. the difference between 3 and 4 shifts.
12 / 30
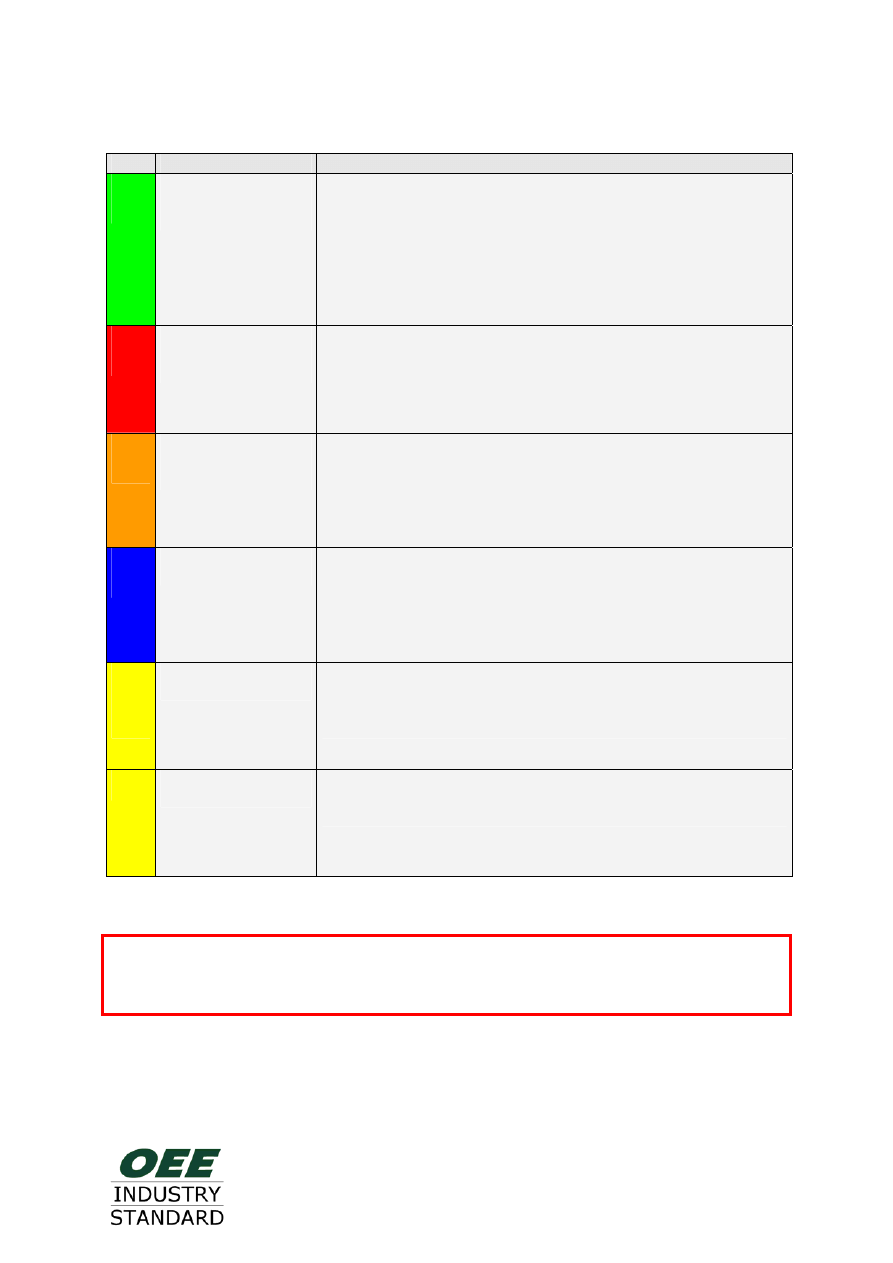
Section 2: Definition of several types of time
Type Name
Definition
P
Production time =
Running time
Something is coming out of the equipment, regardless of the
amount, speed or quality.
A machine, spinning at top speed, not generating output
therefore is not running….
Caution; batch producing equipment (like cookers, brick-ovens)
are considered to run during their batch processing time.
F
Failure time =
Breakdown time
The machine is not having output due to a machine related
technical problem.
I
Idle time =
Waiting time
The machine is not producing output because it has to wait for
something (like a setup, or raw material)
Therefore, waiting for a technician during a breakdown is not
Failure time but Idle time!
L
Line restraint time
The equipment can not generate output because it gets no
input from the line, or can not give its output to the line
Applicable to equipment with a technical link to the line (pipe,
conveyor)
—
Unscheduled
The equipment is scheduled out of the total operations time for
reasons beyond the scope of the production team.
Not Scheduled
Time where there are no operations-activities going on at all.
‘The factory is closed, the lights are out’.
A
A
m
m
a
a
c
c
h
h
i
i
n
n
e
e
i
i
s
s
r
r
u
u
n
n
n
n
i
i
n
n
g
g
w
w
h
h
e
e
n
n
t
t
h
h
e
e
r
r
e
e
i
i
s
s
o
o
u
u
t
t
p
p
u
u
t
t
,
,
r
r
e
e
g
g
a
a
r
r
d
d
l
l
e
e
s
s
s
s
o
o
f
f
t
t
h
h
e
e
q
q
u
u
a
a
n
n
t
t
i
i
t
t
y
y
o
o
r
r
q
q
u
u
a
a
l
l
i
i
t
t
y
y
13 / 30
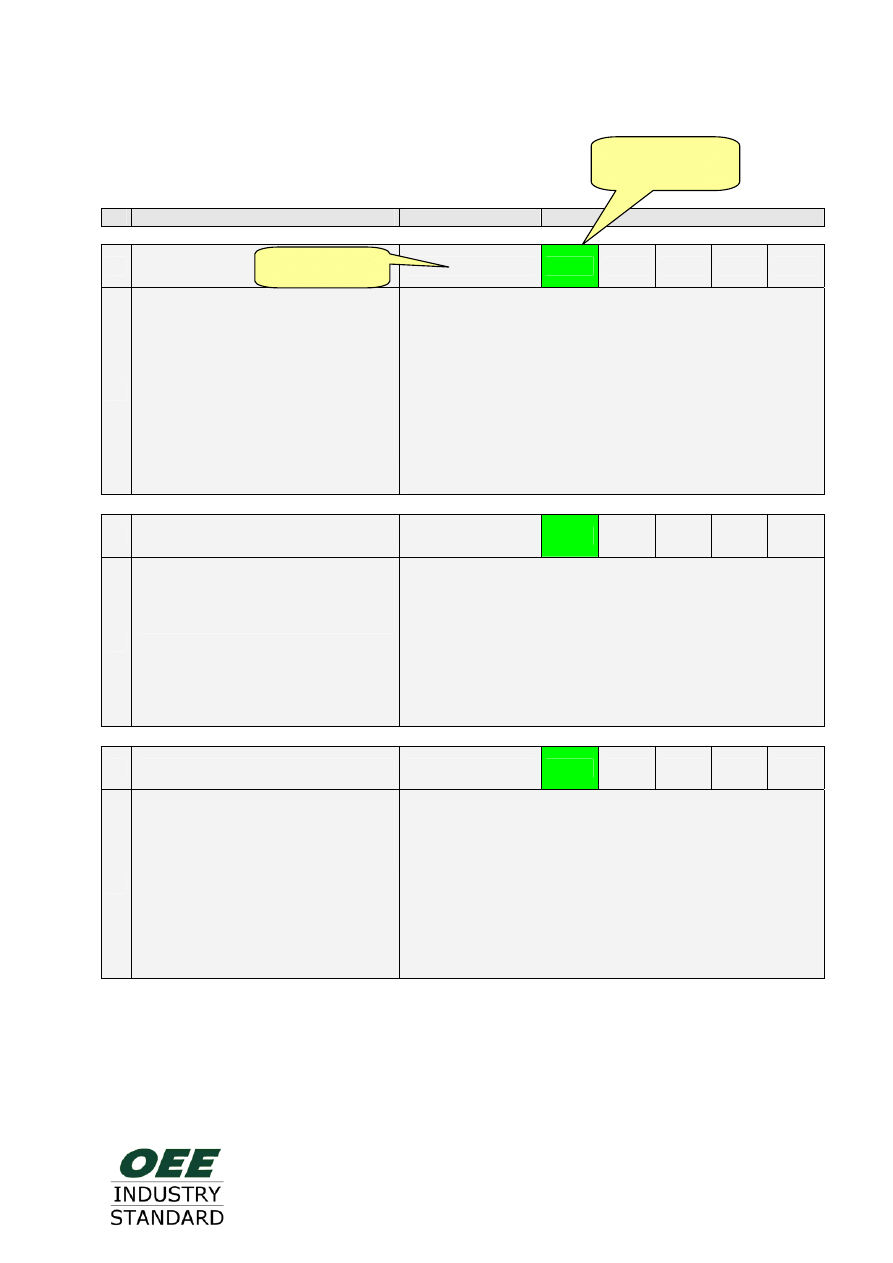
2.1 Groups and types of Time usages
2.1.1 Production
time
No Time Usage
Max. recommended
Time type
1
Production
5
P
F
I
L
-
Plating
Stamping
Assembly
Filling
Moulding
Drilling
Refining
Baking
‘Something is coming out of the machine’ regardless the
speed and its quality.
In batch producing equipment:
From the start of the batch processing time until the end
of the processing time. While loading or unloading the
equipment, the product is not being processed thus the
equipment is NOT running!
2 Reworking
3
P
F
I
L
-
Re-filling
Re-pressing
Remanufacture
The equipment is running, (re-)processing product that
was not produced first time right.
Although this is normal production time in terms of OEE,
in some cases it is useful to split the different types of
production runs to make them visible in the pareto of
time-usage.
3 Reduced Speed Run
3
P
F
I
L
-
Running ½ die
Reduced Setup Tact
The equipment is running at reduced speed; the
equipment output is deliberately slowed down to balance
a line or to execute an inline setup.
Although this is normal production time in terms of OEE,
in some cases it is useful to split the different types of
production runs to make them visible in the pareto of
time-usage.
Refer to Section 2
for explanation!
Try to define no
more categories!

14 / 30
2.1.2 Failure
time
No Time Usage
Max. recommended
Time type
10 Failure [function x]
10
P
F
I
L
-
Failure filler
Failure Capper
Failure depalletiser
A failure (=breakdown) prevents production due to a
technical reason in the machine. The categories should
be chosen process oriented and should describe the
phenomenon, not the cause.
Choosing functional categories (like Electric,
Mechanical, Pneumatic) is not supporting the cross-
functional production team efforts.
11 (Re)Adjustment
2
P
F
I
L
-
Adjustment
Re-calibration
The machine is stopped WHILE A BATCH RUNS
because adjustment is needed, to keep/get a product in
spec. It is seen as a failure because at a certain point
the equipment is no longer capable of producing the
right spec due to a technical malfunction that needs to
be corrected. The process is not capable of a stable
operation.
Adjustment and calibration after setup belong to startup.
T
T
i
i
m
m
e
e
c
c
a
a
t
t
e
e
g
g
o
o
r
r
i
i
e
e
s
s
s
s
h
h
o
o
u
u
l
l
d
d
b
b
e
e
P
P
R
R
O
O
C
C
E
E
S
S
S
S
r
r
e
e
l
l
a
a
t
t
e
e
d
d
r
r
a
a
t
t
h
h
e
e
r
r
t
t
h
h
a
a
n
n
F
F
U
U
N
N
C
C
T
T
I
I
O
O
N
N
r
r
e
e
l
l
a
a
t
t
e
e
d
d

15 / 30
2.1.3 Idle
time
I
I
f
f
t
t
w
w
o
o
o
o
r
r
m
m
o
o
r
r
e
e
t
t
i
i
m
m
e
e
-
-
u
u
s
s
a
a
g
g
e
e
s
s
o
o
c
c
c
c
u
u
r
r
a
a
t
t
t
t
h
h
e
e
s
s
a
a
m
m
e
e
t
t
i
i
m
m
e
e
,
,
t
t
h
h
e
e
p
p
r
r
i
i
m
m
a
a
r
r
y
y
r
r
e
e
a
a
s
s
o
o
n
n
f
f
o
o
r
r
s
s
t
t
o
o
p
p
p
p
i
i
n
n
g
g
i
i
s
s
b
b
e
e
i
i
n
n
g
g
r
r
e
e
g
g
i
i
s
s
t
t
e
e
r
r
e
e
d
d
No Time Usage
Max. recommended
Time type
20 Setup
5
P
F
I
L
-
Product change
Setup
Quality Change
A setup in terms of OEE lasts from the last product A
until the first product B, regardless its quality. (remind,
this is different from the SMED definition: Last GOOD
product until first GOOD product!)
Depending the situation it might be useful to precede or
succeed the setup time by a shutdown and startup
category, to make visible in a pareto where the main
losses of setup are to be eliminated.
21 Startup/Shutdown
2
P
F
I
L
-
Heat up
Start after stop
Run-in
Checking machine
Preparation
Pressurise
Pump dry
Empty out
Clear out
Rinse out
Cool down
Calibration
The machine is not producing due to the fact it has no
vertical startup or shutdown. This can occur at beginning
or ending of shift but also before or after a setup or
repair works. This time is defined separately from the
main reason to shut down the machine.
Cleaning belongs here if it is part of the startup or
shutdown activity, including startup of a new product
(process-cleaning).

16 / 30
No Time Usage
Max. recommended
Time type
22 No Operator at machine
5
P
F
I
L
-
Break
Meeting
Training
Help at other machine
‘Washing hands’
The machine is available, but is not running because the
operator is not operating it for example during his break,
a training or a meeting. Just like Preventive
Maintenance, this time needs to have a balance
between doing enough but not too much.
23
Quality problems -
Process disturbance
2
P
F
I
L
-
Stopped because output is out of
spec
The machine can not run because the process can not
meet up with the specifications for (at that moment)
unknown reasons.
If the reason is known (i.e. bad raw material), it should
be registered as such (Bad raw material = Waiting for
correct material).

17 / 30
No Time Usage
Max. recommended
Time type
24 Refill/Replace
3
P
F
I
L
-
Blade change
Refill ink cartridge
Oil Refill
The machine is stopped while refilling or replacing
auxiliary, e.g. cutting blades, coolants, ink, oil, etc.
25 Loading
3
P
F
I
L
-
Load labels
Load boxes
Load Raw material
The machine is stopped while refilling/loading raw
material, e.g. packaging materials, foils, and other raw
materials.
26 Handling
2
P
F
I
L
-
Truck (un)loading
Forklift driving
Container change
The machine is waiting while needed material is being
handled.
This is a more specific situation from the ‘Waiting’ block.
27 Waiting
7
P
F
I
L
-
Waiting on Tooling
Waiting on Engineering
Waiting on Maintenance
Waiting on Inspection
Looking for Gauge
No/Bad Packaging
No/Bad Raw material
No operator Available
The machine is not running because, for example, the
correct raw material or a tool is not present at the
moment it is needed, or an action can not be performed.
In this block we find reasons for idling that are caused
by a weak planning. In the block ‘No Resources and
No Personnel’ the reasons are ‘Force Majeure’.
It might occur we forgot to schedule or replace an
operator.

18 / 30
No Time Usage
Max. recommended
Time type
28
Autonomous Maintenance &
Cleaning
3
P
F
I
L
-
Shift Maintenance
Daily Cleaning
The main reason why the machine was stopped was
due to AM activities, including cleaning. If a machine is
cleaned in the time it was standing due to another
reason (ie waiting for raw material) the real reason why
the machine is standing is being registered.
Process cleaning (like rinsing between two products)
belongs to startup-shutdown.
29
Preventive Maintenance
during Loading Time
2
P
F
I
L
-
Planned PM during Loading time
Unplanned PM
Scheduled time to perform PM.
The machine is stopped at a not scheduled moment to
perform PM or…
The machine is stopped at a scheduled moment but
exceeding the scheduled time to perform PM during a
scheduled time.
PM happens ‘in process’; it is scheduled in the
production sequence and needs to have a balance
between enough and not too much. If well performed,
the planned idling time will reduce the unplanned
breakdown time.
19 / 30
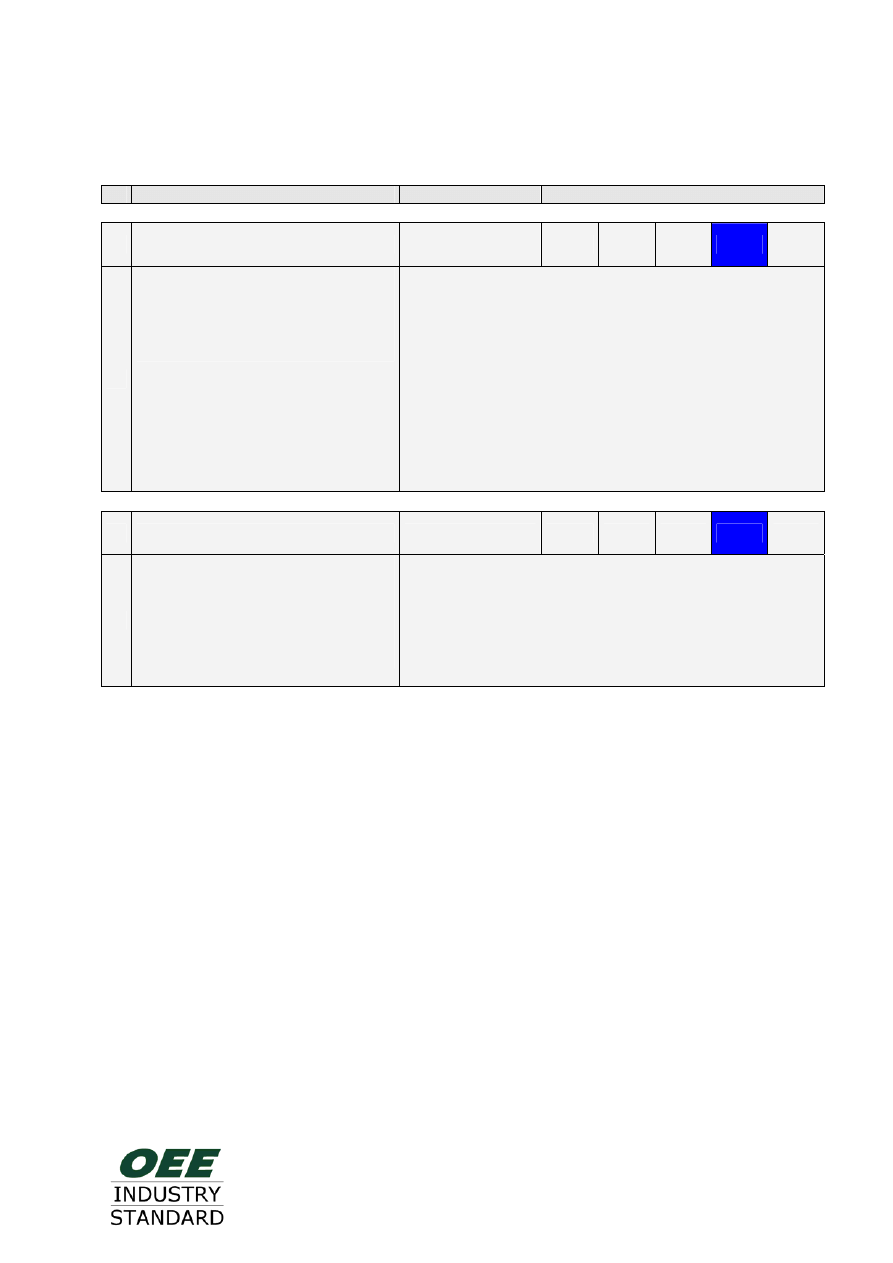
2.1.4 Line
restraint
time
No Time Usage
Max. recommended
Time type
50 No Input (in Line process)
5
P
F
I
L
-
Empty input buffer
No input due to pre-heater
No input due to depalletiser
The machine stands still due to no input from a
preceding process that has a technical link, e.g. a
conveyer.
In lines it can be useful to get an overview in the pareto
to show what process decreases the effectiveness from
this machine the most. In that case the time usage is
split in two or more items like;
[no input due to process x].
51 No Output (in Line process)
5
P
F
I
L
-
Output buffer full
Stop at palletiser
Stop at tray packer
Conveyer blocked
The machine stands still due to the fact it can not get rid
of its output; mostly due to a stop in a succeeding
process that has a technical link, e.g. a conveyer.
Also see block [No Input].
Remark:
The Line Restraint categories are used to reveal unbalanced capacities and/or timing in line
processes. A line can be thought of literally: several machines tied together with conveyors,
pipes etc.
However, applying Lean-Principles, those categories can be very well used to detect un-
balanced situations between machines not technically tied together, e.g. in a cell or between
several departments.
It even might be used to detect flaws in the supply-chain.
The [L] category therefore can be seen as a strict [L]ine Restraint but also as a [L]ean or
[L]ogistic restraint.
20 / 30
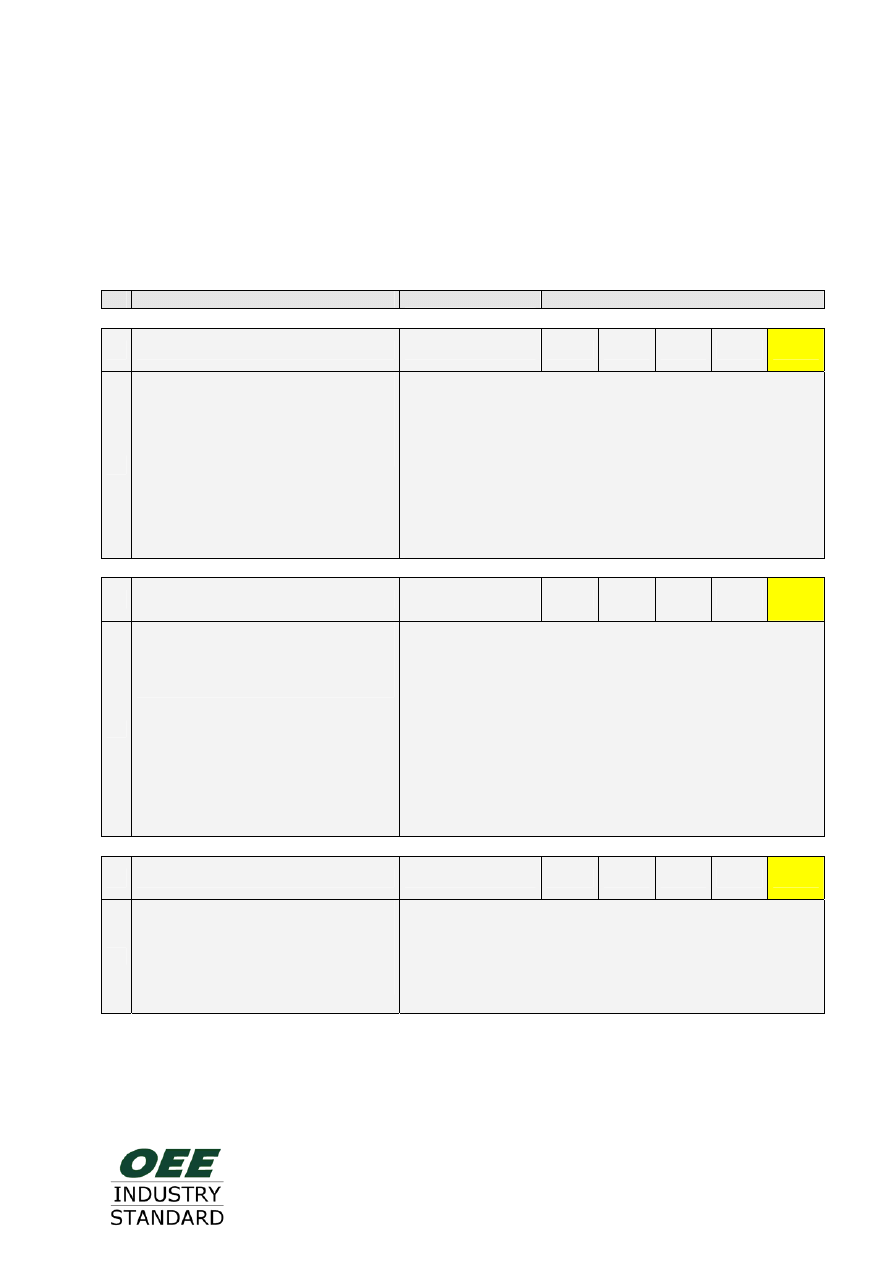
2.1.5 Unscheduled
time
During the operations time, the equipment may be unscheduled because:
•
the product is not needed (over-capacity);
•
it is not allowed to run (due to Governmental regulations or contracts);
•
‘Force Majeur’ (catastrophe’s outside of the company);
•
the equipment is ‘handed over’ to an other party (e.g. R&D).
No Time Usage
Max. recommended
Time type
60 No Orders
3
P
F
I
L
-
No Orders
Over-capacity
PM during No Orders
Cleaning during No Orders
The machine is not required to run due to a lack of
customer orders; the capacity is not needed.
(customer = the one who pays for the product!)
Beware! A warehouse will never be ‘the customer’!
Do not hide over-production!
61 No Personnel Available
1
P
F
I
L
-
No Personnel
Strike
The machine is not scheduled for production because
there is no operator present due to ‘force majeure’ like
•
Strikes
•
Massive influenza
•
Poor availability of workforce in the region.
If there is no operator available due to a lack of planning
(so the machine was supposed to run), choose ‘no
operator at machine’ or ‘wait for operator’ (both [I]dle).
62 No Resources
2
P
F
I
L
-
River Frozen
Energy Contract
Boycott
The machine is not scheduled for production because a
resource is not available due to reasons OUTSIDE of
the company, including energy; thus reasons other then
lack of planning or handling (in such cases: Waiting).

21 / 30
No Time Usage
Max. recommended
Time type
63 Test Production
1
P
F
I
L
-
R&D
Test Run
The machine is not scheduled for production to make it
available for product development, testing new products
or processes etc.

22 / 30
2.1.6 Idle Time registered as Unscheduled Time
Activities that normally would have been performed during loading time, can sometimes be
scheduled outside loading time. In a two-shift operation, the machine might be setup or
cleaned during the night or in the weekend, in absence of the regular crew. Preventive
Maintenance could be carried out at a moment no production was scheduled. In a 3 shift
operation from Monday to Friday, the PM could be scheduled in the weekend, thus not
affecting the loading time.
In this way OEE may be increased by using non-loading time for activities that normally
would affect loading time.
Doing so has some serious disadvantages:
•
The activity is necessary to perform the scheduled production thus can not be skipped:
This means the OEE is artificially high. When Loading Time needs to be extended (e.g.
more capacity is needed) and 2 shift becomes 3 shift, or 3 becomes 5 shift, those
activities automatically will fall into the loading time, thus dropping the OEE!
•
Usually, outside the loading time, there is no pressure to get the machine up and running;
this might result in a less effective performance of the activity scheduled outside of the
loading time.
It is advised to register ALL machine related activities, necessary to perform the operation,
WITHIN the loading time, regardless of the normal shift-time. Thus PM on Saturday would be
Idle time and decreases the OEE!
However, if you choose not to do so, make sure to register ALL the time the machine is being
touched or activated outside normal loading time. In this way the potential loss can be
identified and made visible.

23 / 30
No Time Usage
Max. recommended
Time type
70
Preventive Maintenance outside
Loading Time
2
P
F
I
L
-
Planned PM Outside Loading Time
(Annual) Overhaul
Unplanned PM Outside Loading
Time
PM necessary to maintain a high availability of the
equipment, being performed outside of the normal
Loading Time. In a 3 shift operation from Monday to
Friday, the PM could be scheduled in the weekend, thus
not affecting the regular loading time.
Overhaul is a specific form of preventive maintenance. If
the machine is unscheduled for a longer period of time
to be completely overhauled, it should be considered
[PM during loading time] thus (I)dle. Only if the overhaul
is performed at a moment the equipment would anyway
not be running (e.g. because the facility is closed) it
belongs in this block. If it is done in a period where there
are no orders, [No Orders] is the reason for stopping the
machine, and not the overhaul. Thus [No Orders] is
registered! To identify PM during No Orders, make a
separate category: [PM during No Orders].
PM outside loading time can take longer than originally
planned; this can be made visible here.
If PM in Loading Time takes more time than planned
and is being continued outside Loading Time it becomes
[Unplanned PM Outside Loading Time].
71
Activities performed outside
Loading Time
3
P
F
I
L
-
Cleaning Outside Loading Time
Setup Outside Loading Time
Loading Outside Loading Time
Activities that normally would have been performed
during loading time, performed outside loading time. In a
two-shift operation, the machine might be setup or
cleaned during the night or in the weekend, in absence
of the regular crew.
M
M
a
a
x
x
i
i
m
m
u
u
m
m
T
T
i
i
m
m
e
e
c
c
a
a
t
t
e
e
g
g
o
o
r
r
i
i
e
e
s
s
p
p
e
e
r
r
m
m
a
a
c
c
h
h
i
i
n
n
e
e
+
+
/
/
-
-
2
2
0
0
;
;
A
A
l
l
l
l
c
c
a
a
t
t
e
e
g
g
o
o
r
r
i
i
e
e
s
s
s
s
h
h
o
o
u
u
l
l
d
d
f
f
i
i
t
t
o
o
n
n
o
o
n
n
e
e
s
s
i
i
d
d
e
e
o
o
f
f
t
t
h
h
e
e
O
O
E
E
E
E
r
r
e
e
g
g
i
i
s
s
t
t
r
r
a
a
t
t
i
i
o
o
n
n
f
f
o
o
r
r
m
m
!
!

24 / 30
Section 3: Speed definitions
To calculate the performance rate, the theoretical maximum speed is related to the actual
speed.
3.1
Time versus Quantity
The maximum speed can be calculated in time or in number of product;
i.e.
-
maximum speed is 10 seconds per product
-
maximum speed is 6 products per minute
Nevertheless since OEE is primarily a shopfloor tool, and people on the shopfloor rather talk
about ‘units being produced’ than ‘seconds it has taken to produce a unit’, it is preferred to
register speed in units, not in time.
T
T
h
h
e
e
p
p
a
a
r
r
a
a
m
m
e
e
t
t
e
e
r
r
s
s
f
f
o
o
r
r
P
P
e
e
r
r
f
f
o
o
r
r
m
m
a
a
n
n
c
c
e
e
c
c
a
a
n
n
b
b
e
e
e
e
x
x
p
p
r
r
e
e
s
s
s
s
e
e
d
d
i
i
n
n
e
e
i
i
t
t
h
h
e
e
r
r
T
T
I
I
M
M
E
E
o
o
r
r
Q
Q
U
U
A
A
N
N
T
T
I
I
T
T
Y
Y
,
,
b
b
u
u
t
t
Q
Q
U
U
A
A
N
N
T
T
I
I
T
T
Y
Y
i
i
s
s
p
p
r
r
e
e
f
f
e
e
r
r
r
r
e
e
d
d
3.2
Maximum speed of what?
The maximum speed can be determined from the NPC, the Name Plate Capacity (Design
speed). However, mostly there are several product(groups) on a machine with their own
derived maximum speed. In such cases, special care has to be taken not to include hidden
losses in the maximum speed due to ‘difficult products’ which might refer to ‘products which
we don’t control the process for’
3.3
Name Plate Capacity (NPC)
The NPC should not be taken granted for. More than once it was discovered to include all
kind of hidden losses. The manufacturer might have chosen a low NPC for reasons of liability
or to ‘fit’ the equipment with other equipment in a line.
25 / 30
3.4 The
Standard
T
T
h
h
e
e
s
s
t
t
a
a
n
n
d
d
a
a
r
r
d
d
i
i
s
s
t
t
h
h
e
e
t
t
h
h
e
e
o
o
r
r
e
e
t
t
i
i
c
c
a
a
l
l
m
m
a
a
x
x
i
i
m
m
u
u
m
m
s
s
p
p
e
e
e
e
d
d
f
f
o
o
r
r
a
a
p
p
r
r
o
o
d
d
u
u
c
c
t
t
(
(
g
g
r
r
o
o
u
u
p
p
)
)
o
o
n
n
t
t
h
h
e
e
m
m
a
a
c
c
h
h
i
i
n
n
e
e
;
;
t
t
h
h
u
u
s
s
t
t
h
h
e
e
p
p
e
e
r
r
f
f
o
o
r
r
m
m
a
a
n
n
c
c
e
e
r
r
a
a
t
t
e
e
n
n
e
e
v
v
e
e
r
r
e
e
x
x
c
c
e
e
e
e
d
d
s
s
1
1
0
0
0
0
%
%
The derivation of different maximum speeds for different products should be done in a
mathematical manner.
Example:
An extruder is designed (and checked for!) extruding max. 500 kg plastic per hour.
Product A consists of 250 grams plastic, product B consists of 500 grams.
Thus, the theoretical maximum speed for A is 500kg/250gram= 2000 pcs per hour.
The theoretical maximum speed for B is 500kg/500gram= 1000 pcs per hour.
The theoretical maximum speed for a product-machine combination is called ‘The Standard’.
It is specifically not called Norm, since this word has negative associations related to piece
work for many people in different countries.
A
A
t
t
w
w
e
e
l
l
l
l
c
c
h
h
o
o
s
s
e
e
n
n
S
S
t
t
a
a
n
n
d
d
a
a
r
r
d
d
s
s
,
,
t
t
h
h
e
e
p
p
e
e
r
r
f
f
o
o
r
r
m
m
a
a
n
n
c
c
e
e
r
r
a
a
t
t
e
e
w
w
i
i
l
l
l
l
n
n
e
e
v
v
e
e
r
r
e
e
x
x
c
c
e
e
e
e
d
d
1
1
0
0
0
0
%
%
,
,
u
u
n
n
l
l
e
e
s
s
s
s
t
t
h
h
e
e
p
p
r
r
o
o
d
d
u
u
c
c
t
t
o
o
r
r
t
t
h
h
e
e
m
m
a
a
c
c
h
h
i
i
n
n
e
e
f
f
u
u
n
n
d
d
a
a
m
m
e
e
n
n
t
t
a
a
l
l
l
l
y
y
c
c
h
h
a
a
n
n
g
g
e
e
s
s

26 / 30
3.5 How maximum is maximum speed?
1
1
0
0
0
0
%
%
O
O
E
E
E
E
=
=
T
T
h
h
e
e
t
t
h
h
e
e
o
o
r
r
e
e
t
t
i
i
c
c
a
a
l
l
m
m
a
a
x
x
i
i
m
m
u
u
m
m
c
c
a
a
p
p
a
a
c
c
i
i
t
t
y
y
o
o
f
f
t
t
h
h
e
e
e
e
q
q
u
u
i
i
p
p
m
m
e
e
n
n
t
t
This statement should be taken serious. If not done so, situations may (and do) occur where
the shopfloor is filled with scrap, the machine is suffering one breakdown after the other and
still accounts for 80% or more OEE. How?
70% Availability, 80 % Quality, 143% Performance = 80% OEE !
As soon as the performance rate goes over 100% (indicating the standard is chosen too
low!) the beautiful balance of the OEE parameters is broken, and the focus may be taken
away from what it is all about: identifying and reducing losses.
In cases where the maximum speed has to be determined based upon a Best Of Best
analysis, it should be considered that this BOB is achieved under the former and current
circumstances, including current losses.
Since in the end even standards are broken by product- and equipment improvement, the
BOB should not be considered too easily as maximum value. As a rule of thumb the BOB
value should be raised with at least 10 to 25% to serve as Standard.
A
A
w
w
e
e
l
l
l
l
c
c
h
h
o
o
s
s
e
e
n
n
S
S
t
t
a
a
n
n
d
d
a
a
r
r
d
d
w
w
i
i
l
l
l
l
o
o
n
n
l
l
y
y
c
c
h
h
a
a
n
n
g
g
e
e
w
w
h
h
e
e
n
n
t
t
h
h
e
e
p
p
r
r
o
o
d
d
u
u
c
c
t
t
o
o
r
r
t
t
h
h
e
e
m
m
a
a
c
c
h
h
i
i
n
n
e
e
f
f
u
u
n
n
d
d
a
a
m
m
e
e
n
n
t
t
a
a
l
l
l
l
y
y
c
c
h
h
a
a
n
n
g
g
e
e
s
s

27 / 30
Section 4: Quality definitions
Producing ‘quality’ means producing a product that meets its specification, not by trying
more than once but First Time Right.
Products not meeting its full spec, but still useful and possible to sell (i.e. as B product, or in
a different market) are not first time right and thus should be considered ‘scrap’.
If a product does not meet its spec, but can be reworked, in terms of OEE it is to be
considered as ‘scrap’, but can be identified as a special form of scrap, by labelling it as
‘rework’.
I
I
n
n
t
t
e
e
r
r
m
m
s
s
o
o
f
f
O
O
E
E
E
E
,
,
S
S
c
c
r
r
a
a
p
p
,
,
r
r
e
e
w
w
o
o
r
r
k
k
a
a
n
n
d
d
s
s
u
u
b
b
-
-
s
s
p
p
e
e
c
c
a
a
r
r
e
e
t
t
h
h
e
e
s
s
a
a
m
m
e
e
:
:
I
I
t
t
w
w
a
a
s
s
‘
‘
n
n
o
o
t
t
f
f
i
i
r
r
s
s
t
t
t
t
i
i
m
m
e
e
r
r
i
i
g
g
h
h
t
t
’
’
;
;
t
t
h
h
e
e
r
r
e
e
f
f
o
o
r
r
e
e
i
i
t
t
i
i
s
s
a
a
l
l
o
o
s
s
s
s
•
Defining scrap-product may reveal poor specifications or poorly testable specifications!
•
Good specifications always refer to the needs of the customer!
28 / 30
Section 5: Discussion issues
Q:
Why do you include breaks in the OEE? We have a legal right to have a break!
A:
This approach assumes the machine can not run while you are having your coffee or lunch.
The reason to include it in the OEE is to make the production team aware of this potential
loss. Is there really no way to let the machine run 15 or 30 minutes without operator
interference? Would it be possible to have an other operator at the machine? Could an other
operator watch your machine while you go away?
Q:
We feel cleaning and maintenance should not be included in OEE. This is necessary to
keep the machine running well!
A:
Exactly! So Maintaining a machine is not meant to reduce its effectiveness… No, we clean
and maintain to RAISE its effectiveness. By taking this time out of the OEE, we will never see
if the effort we spent to clean and maintain is bringing us a higher effectiveness at the bottom
line!
Q:
Ok, but at least you should take out Preventive Maintenance. I, the operator, do not
have any influence on preventive maintenance!
A:
You, the operator, are part of a production
team. Together with your maintenance and
engineering colleagues you are responsible for
the effectiveness of the equipment. If you, the
operator, can prove with facts and figures that
you are suffering severe losses due to
repeated breakdowns and too little (preventive)
maintenance, or due to too frequent PM, it
serves a mutual interest if you bring this up in
your production team meeting!
Here too: If PM reduces your effectiveness:
stop it, otherwise: do it!
Q:
You want us to track a maximum of 10 failure categories, but I want to define 85. How
else can I ever know what bold is breaking?
A:
At first glance that seams to make sense. But OEE is not a breakdown registration system, but
a loss detection system.
Let me explain the consequences: Imagine after 3 months registering OEE data, it shows the
main loss is in availability. So now you want to know what you need to do to get your
availability up. So you take one of the seven tools and draw a pareto diagram of all your time-
events. Lets assume each of the 85 breakdown items occurred at least once. What you will
see is a pareto with an immense long tail, not giving a clear clue where the main losses are
located.
In the other approach where you would have registered failures on, lets say, 5 process parts of
the equipment (like ‘incoming conveyer, pre-heater, moulder, compressor, outgoing conveyer’)
it would show what part of the equipment is restraining the process most. Then you start
temporarily to focus on that part. A simple registration card (maybe even showing the 85
breakdown items) for some weeks will give detailed insight what’s going on. Sometimes it is a
matter of simple maintenance, sometimes a Small Group Activity can solve the problem for
once and forever. By this circle of focused improvement the equipment will become better and
better. This example also shows another disadvantage of the ‘breakdown registration

29 / 30
approach’; if you handle each breakdown in the best way, thus eliminating it forever (either by
reengineering or taking it into PM), it will not reoccur, while other breakdowns may start to
occur. So after a while the breakdown registration system will not reflect the reality anymore.
In the other approach this is less likely to happen.
Q:
If we have no raw material, or we wait for a technician, we start to clean. What do we
register?
A:
The reason why the equipment stopped running is not the cleaning but the ‘waiting for
technician’ or the raw material. Always register the true reason why the machine is stopped,
not how you spent that time.
If you would like to add a discussion item, please let us know: info@oeetoolkit.com.

30 / 30
About the company
What we do
FullFact helps facilitate change in manufacturing companies. We have developed
productivity solutions that are used by manufacturing companies to support and accelerate
improvement processes.
How we work
FullFact develops productivity solutions for the manufacturing team, the people on the shop
floor. We give them the tools that enable them to see what is really going on. This gives
everyone a sense of involvement and provides the information that enables them to make
the right decisions.
Result
The right information is delivered clearly, uniformly and visually. This helps focus attention at
all levels of the organisation. The focus and involvement created in this way makes real
change possible.
Our History
FullFact and Blom Consultancy are both subsidiaries of the Blom Group. FullFact originates
from Blom Consultancy and is established in December 2004. Blom Consultancy specialises
in helping businesses become world class. In 14 years of providing manufacturing
companies with training, coaching and advice, Blom Consultancy has transformed numerous
ideas into fully-fledged products. Up to the end of 2004, these products were developed and
marketed by Blom Consultancy. To provide our existing and new customers with even better
service and to be able to respond even better to market needs, Productivity Solution
products are offered by FullFact.
Our Mission
FullFact - Your Partner in Productivity
FullFact collaborates with various partners worldwide who help manufacturing companies
improve their productivity with our productivity solutions. All FullFact productivity solutions
offer:
1. Relevant
FACTS
2. Clear
VISUALISATION
3. Loss
AWARENESS
4. Shopfloor
OWNERSHIP
By managing your company with the four FullFact key success factors, you can create flow in
the change process, root out resistance and improve productivity.
For more information about the OEE Tookit Software: www.oeetoolkit.com.
FullFact bv
Heuvel 11
5737 BX Lieshout
The Netherlands
tel. +31-499-42-3872
fax. +31-499-42-3976
@
info@oeetoolkit.com
L
www.oeetoolkit.com
Wyszukiwarka
Podobne podstrony:
standard HL7
Metodologia SPSS Zastosowanie komputerów Golański Standaryzacja
standaryzacja w geomatyce
Wykł 1 Omówienie standardów
Złote standardy w diagnostyce chorób układowych 3
Wyklad 2 zmiennosc standaryzacja 5 III 2014 b
01 standaryzacja IIIrokid 2944 ppt
Wyk 2 standardy pomiarów
cw standard C EPiFM
catalyst standard obligacji euro
Applications and opportunities for ultrasound assisted extraction in the food industry — A review
Normy i standardy z zakresu bezpieczenstwa informacyjnego i teleinformatycznego
Zad 4, UEK, FiR II SEMESTR, Standardy Sprawozdawczości Finansowej
System industrialny Saint-simona, Współczesne Idee Polityczne
więcej podobnych podstron