
Evaluation of SMOTE for high-dimensional
class-imbalanced microarray data
Rok Blagus
Institute for Biostatistics and medical informatics
University of Ljubljana
Ljubljana, Slovenia
rok.blagus@mf.uni-lj.si
Lara Lusa
Institute for Biostatistics and medical informatics
University of Ljubljana
Ljubljana, Slovenia
lara.lusa@mf.uni-lj.si
Abstract—Synthetic
Minority
Oversampling
TEchnique
(SMOTE) is a popular oversampling method that was proposed
to improve random oversampling but its behavior on high-
dimensional data has not been thoroughly investigated. In
this paper we evaluate the performance of SMOTE on
high-dimensional data, using gene expression microarray data.
We observe that SMOTE does not attenuate the bias towards
the classification in the majority class for most classifiers, and it is
less effective than random undersampling. SMOTE is beneficial
for k-NN classifiers based on the Euclidean distance if the number
of variables is reduced performing some type of variable selection
and the benefit is larger if more neighbors are used. If the
variable selection is not performed than the k-NN classification is
counter intuitively biased towards the minority class, so SMOTE
for k-NN without variable selection should not be used in
practice.
Index
Terms—SMOTE;
high-dimensional
data;
class-
imbalance; class prediction
I. I
NTRODUCTION
In class prediction we would like to develop a classifier, that
is based on a group of samples with known class membership
and use it to predict the class membership for new samples.
The number of samples from each class is often different
(class-imbalanced data) and nowadays increasingly often the
number of variables (features) is very large and greatly exceeds
the number of samples (high-dimensional data). Many papers
attempted to develop classifiers using high-dimensional gene
expression data that were class-imbalanced [1], [2], [3]. The
presence of class-imbalance has important consequences on
the classification results, usually producing classifiers that have
poor predictive accuracy for the minority class [4] and the
problem is exacerbated when data are high-dimensional [5].
Some of the solutions for the class-imbalance problem pro-
posed in the literature are effective with high-dimensional data,
while others are not. Generally undersampling techniques,
aimed at producing a class-balanced training set of smaller
size, are helpful, while simple oversampling is not [5]. The
Synthetic Minority Over-sampling TEchnique (SMOTE [6])
is an oversampling approach that creates synthetic minority
class samples. It potentially performs better than simple over-
sampling and it is widely used. It was experimentally observed
using low-dimensional data that simple undersampling tends
to outperform SMOTE [7]. This result was further confirmed
using SMOTE with SVM as a base classifier [8], extending
the observation also to high-dimensional data: SMOTE with
SVM seems beneficial but less effective than simple under-
sampling for low-dimensional data, while it performs very
similarly to uncorrected SVM and generally much worse than
undersampling for high-dimensional data. To our knowledge
the performance of SMOTE on high-dimensional data was not
thoroughly investigated for classifiers other than SVM.
In this article we investigate the performance of SMOTE,
using gene expression data sets. We consider two-class classifi-
cation problems, and limit our attention to k-NN with
𝑘 = 1, 3
and
5, linear discriminant analysis methods (diagonal - DLDA,
and quadratic - DQDA), random forests (RF), support vector
machine (SVM), prediction analysis for microarrays (PAM),
Classification and Regression Trees (CART) and penalized
logistic regression (PLR) with a quadratic penalty.
The rest of the article is organized as follows. In the
Methods Section we briefly describe SMOTE, simple under-
sampling and the breast cancer gene expression data sets. In
the Results Section we present the experimental results. In
the Conclusion Section we summarize and discuss the most
important results of our study.
II. M
ETHODS
SMOTE and simple undersampling
SMOTE [6] generates synthetic samples from the minority
class using the information available in the data. For each
sample from the minority class (x)
5 samples from the minority
class with the smallest Euclidean distance from the original
sample were identified (nearest neighbors), and one of them
was randomly chosen (x
𝑁𝑁
). The new synthetic SMOTE
sample was defined as
x
𝑆𝑀𝑂𝑇 𝐸
= x + 𝑢 ⋅ (x
𝑁𝑁
− x),
(1)
where
𝑢 was randomly chosen from 𝑈(0, 1). 𝑢 was the same
for all variables, but differed for each SMOTE sample; this
guarantees that the SMOTE sample lies on the line joining the
two original samples used to generate it [4], [6]. By SMOTE-
augmenting the minority class we obtained a class-balanced
training set, as suggested in [7].
2012 11th International Conference on Machine Learning and Applications
978-0-7695-4913-2/12 $26.00 © 2012 IEEE
DOI 10.1109/ICMLA.2012.183
89
2012 11th International Conference on Machine Learning and Applications
978-0-7695-4913-2/12 $26.00 © 2012 IEEE
DOI 10.1109/ICMLA.2012.183
89

Simple undersampling (down-sizing) consists of obtaining a
class-balanced training set by removing a subset of randomly
selected samples from the larger class [4].
Performance measures
The classifiers were evaluated using five performance mea-
sures: (i) overall predictive accuracy (PA, the number of cor-
rectly classified samples divided by the total number of sam-
ples), (ii) predictive accuracy of Class 1 (PA
1
, PA evaluated
using only samples from class 1), (iii) predictive accuracy of
Class 2 (PA
2
, PA evaluated using only samples from class 2),
(iv) Area Under the Receiver-Characteristic-Operating Curve
(AUC [9]) and (v) G-mean (
√
PA
1
⋅ PA
2
). If Class 1 is defined
as a positive class, than PA
1
is sensitivity of the classifier and
PA
2
is its specificity.
Experimental data sets
We considered three breast cancer gene expression data
sets [10], [11], [12] and two classification tasks for each of
them: prediction of estrogen receptor status (ER+ or ER-) and
prediction of grade of tumors (grade 1 and 2 or grade 3). Data
were pre-processed as described in the original publications.
The number of variables varied from
7, 650 to 22, 283, the
number of samples from
99 to 249, and the proportion of
minority class samples from
0.14 to 0.45 (Table I).
TABLE I
Experimental data sets. N
UMBER OF SAMPLES
,
NUMBER OF SAMPLES IN
THE MINORITY CLASS
(
𝑛
𝑚𝑖𝑛
),
LEVEL OF CLASS
-
IMBALANCE
(
𝑘
𝑚𝑖𝑛
)
AND
NUMBER OF FEATURES FOR THE ANALYZED GENE EXPRESSION DATA
SETS
.
Data set
Prediction
task
Number of
features
Number of
samples
𝑛
𝑚𝑖𝑛
𝑘
𝑚𝑖𝑛
Sotiriou
ER
7,650
99
34
0.34
Grade
7,650
99
45
0.45
Pittman
ER
12,625
158
48
0.30
Grade
12,625
158
63
0.40
Miller
ER
22,283
247
34
0.14
Grade
22,283
249
54
0.22
The classifiers were trained with all variables or with 40
variables with the largest values of a
𝑡 statistic, using SMOTE,
simple undersampling or the uncorrected classifiers. Their
performance was assessed with leave-one-out cross validation.
To take the sampling variability into account, each classifier
was trained using
50 different SMOTE-augmented or under-
sampled training sets. Overall, 10,878 classifiers were trained,
and their performance was assessed training about one million
classifiers on cross-validated training sets. We used Friedman
test to compare the uncorrected classifiers, SMOTE corrected
classifiers and classifiers trained on the undersampled training
set and Nemenyi test for the post-hoc comparisons [13].
Additionally, to isolate the effect of class-imbalance, we
used the Sotiriou data and obtained different levels of class-
imbalance in the training set by including a randomly chosen
subset of the samples in the analyses. The training sets
contained a fixed number of samples in the minority class (
5
or
10 ER- or grade 3 samples), while the number of samples
in the majority class varied; the class-imbalance of the training
sets ranged from
𝑘
1
= 0.50 to 0.90 at most, while the test sets
were class-balanced. The analysis was replicated
500 times for
each level of class-imbalance; 40 variables were selected at
each iteration. The results were presented as average overall
and class-specific PA.
III. R
ESULTS
Results for the prediction of the ER status and Grade of the
tumor are shown in figures 1 and 2; the results of the statistical
significance of the differences are reported in table II. Most
uncorrected classifiers were sensitive to class-imbalance, even
when the class-imbalance was moderate. ER status was easier
to predict than grade: for example, the average AUC for ER
(grade) using uncorrected classifiers on Sotiriou’s data was
0.89 (0.69). With few exceptions, the majority class had a
better class-specific PA (most notably for k-NN, RF, PLR
and CART); larger differences were seen when the class-
imbalance was large (Miller’s and Pittman’s data) and for
harder classification tasks. The class-specific PA of DLDA
and DQDA were about the same for all the classification
tasks; together with PAM, these classifiers had the largest AUC
and G-mean values and seemed the least sensitive to class-
imbalance. SMOTE and undersampling had little or no effect
on their classification results.
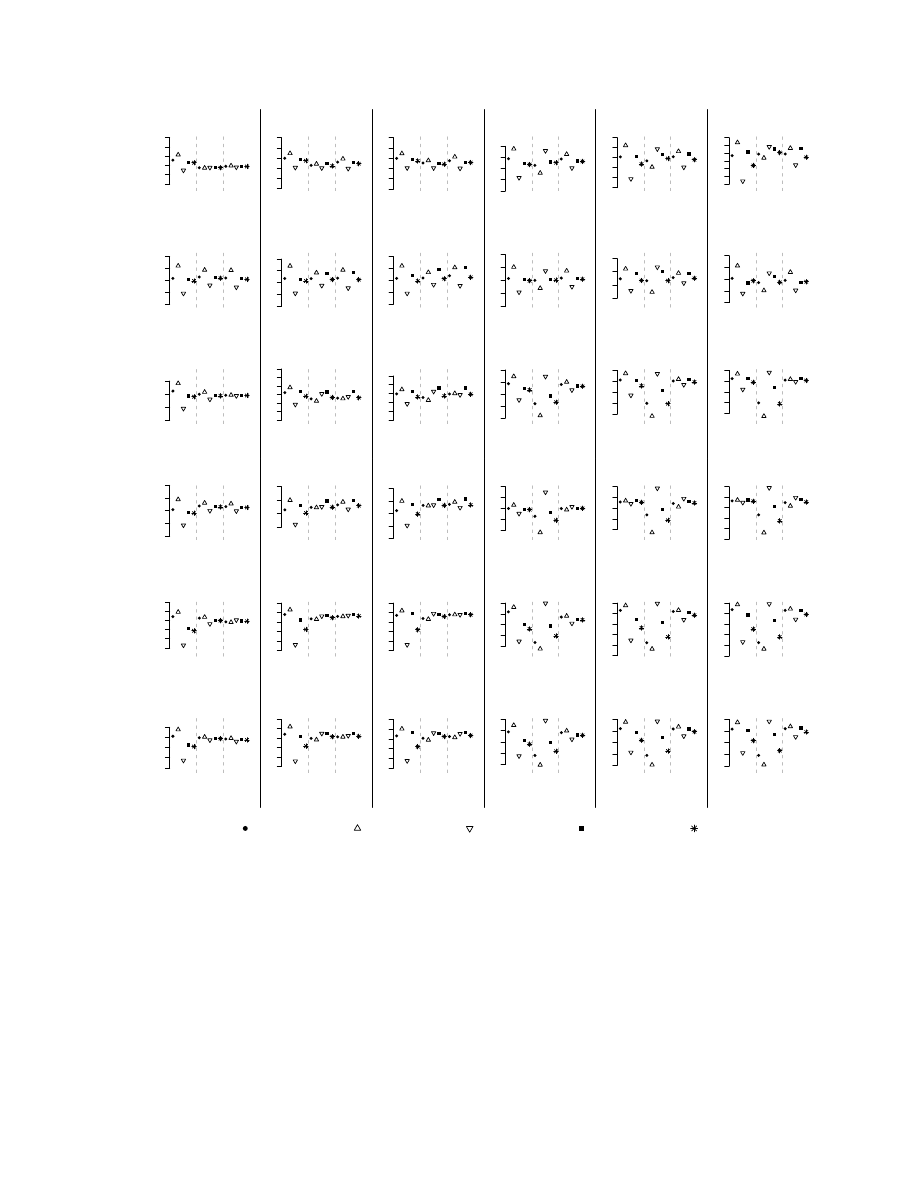
SMOTE with variable selection had the most dramatic effect
on k-NN classifiers, substantially reducing the discrepancy
between the class-specific PA, generally increasing the G-
mean and the AUC values (see Miller’s data); in this case
SMOTE performed similarly, but not better, than undersam-
pling. On the other hand, when variable selection was not
performed SMOTE worsened the performance of k-NN: most
samples were classified in the minority class and the AUC
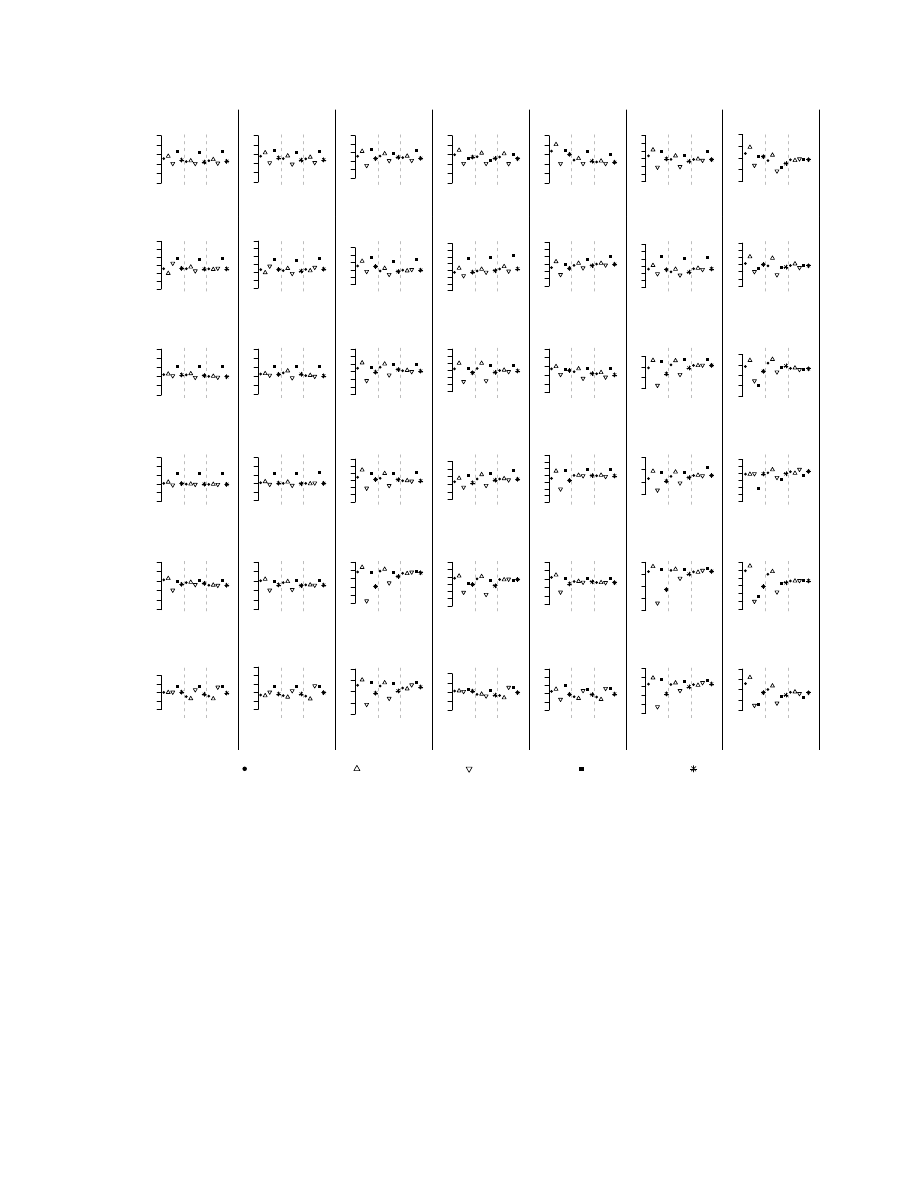
and G-mean values substantially decreased. SMOTE reduced
the discrepancy in class-specific PA for the other classifiers
(RF, SVM, PAM, PLR and CART), but simple undersampling
performed very similarly (PAM) or better (RF, SVM, PLR and
CART).
No significant differences between SMOTE, undersampling
and uncorrected classifiers were observed (
𝑝 > 0.05, table
II). The only exception were the k-NN classifiers without
performing variable selection where SMOTE achieved signif-
icantly lower overall predictive accuracy and G-mean as the
uncorrected classifiers, while the comparison between SMOTE
and undersampling and undersampling and the uncorrected
classifiers showed no significant differences.
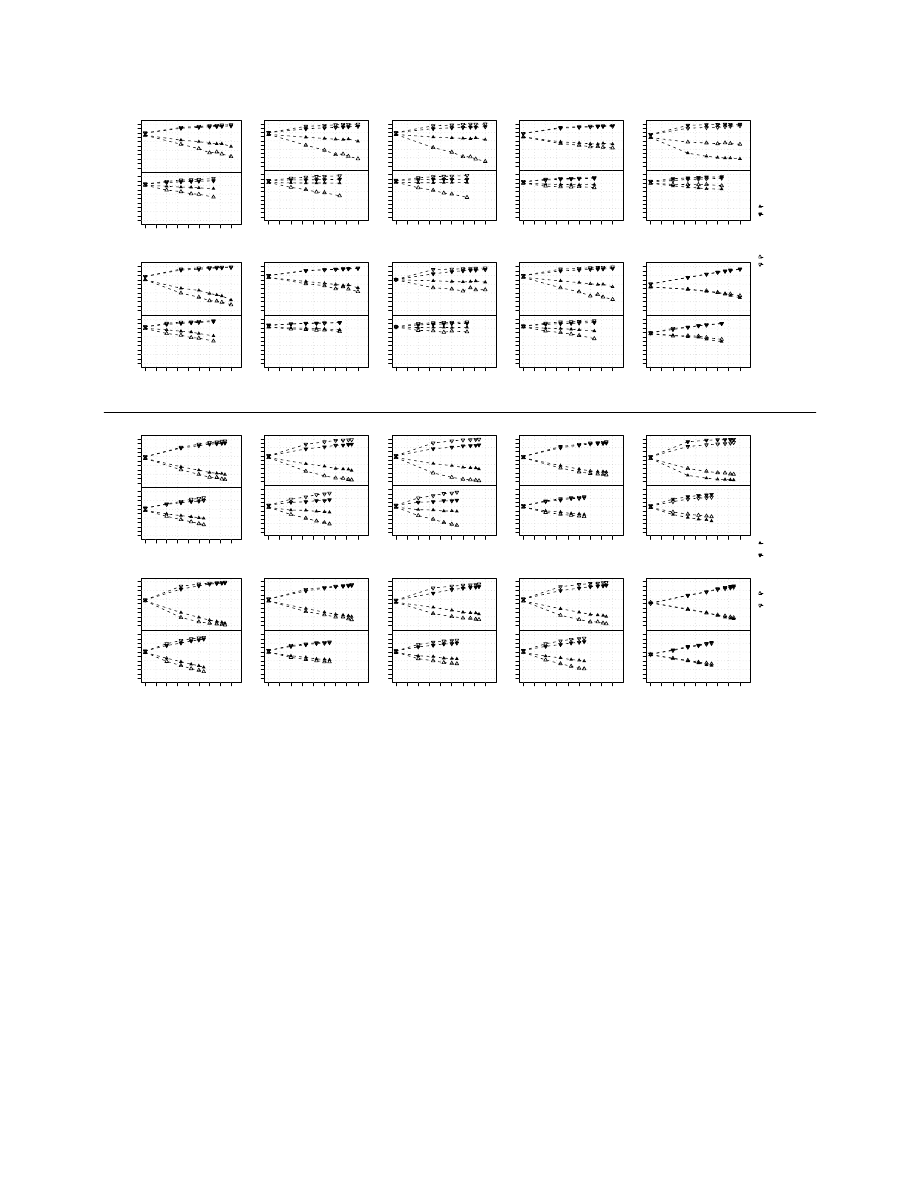
To get a better insight into the class-imbalance problem,
we obtained different levels of class-imbalance on Sotiriou’s
data set. Figure 3 displays the average class-specific PA for
ER classification (left panel) and grade (right panel); the
leftmost points of each graph show the results for simple
undersampling (
𝑘
1
= 0.5). Note that the total sample size
increases with class-imbalance. For the uncorrected classifiers
the PA of the minority class markedly decreased as the class-
imbalance increased, despite of the fact that the sample size of
90
90
1−NN
0.75
0.90
NC
SMOTE
UNDER
3−NN
0.75
0.90
NC
SMOTE
UNDER
5−NN
0.75
0.85
0.95
NC
SMOTE
UNDER
1−NN (nfs)
0.5
0.7
0.9
NC
SMOTE
UNDER
3−NN (nfs)
0.5
0.7
0.9
NC
SMOTE
UNDER
5−NN (nfs)
0.4
0.7
1.0
NC
SMOTE
UNDER
1−NN
0.4
0.6
0.8
NC
SMOTE
UNDER
3−NN
0.4
0.6
0.8
NC
SMOTE
UNDER
5−NN
0.4
0.6
0.8
NC
SMOTE
UNDER
1−NN (nfs)
0.4
0.6
0.8
NC
SMOTE
UNDER
3−NN (nfs)
0.5
0.7
NC
SMOTE
UNDER
5−NN (nfs)
0.5
0.7
0.9
NC
SMOTE
UNDER
1−NN
0.6
0.8
NC
SMOTE
UNDER
3−NN
0.70
0.85
1.00
NC
SMOTE
UNDER
5−NN
0.70
0.85
NC
SMOTE
UNDER
1−NN (nfs)
0.2
0.6
1.0
NC
SMOTE
UNDER
3−NN (nfs)
0.2
0.6
1.0
NC
SMOTE
UNDER
5−NN (nfs)
0.2
0.6
1.0
NC
SMOTE
UNDER
1−NN
0.5
0.7
0.9
NC
SMOTE
UNDER
3−NN
0.6
0.8
NC
SMOTE
UNDER
5−NN
0.5
0.7
0.9
NC
SMOTE
UNDER
1−NN (nfs)
0.2
0.6
1.0
NC
SMOTE
UNDER
3−NN (nfs)
0.2
0.6
1.0
NC
SMOTE
UNDER
5−NN (nfs)
0.0
0.4
0.8
NC
SMOTE
UNDER
1−NN
0.5
0.7
0.9
NC
SMOTE
UNDER
3−NN
0.5
0.7
0.9
NC
SMOTE
UNDER
5−NN
0.5
0.7
0.9
NC
SMOTE
UNDER
1−NN (nfs)
0.2
0.6
1.0
NC
SMOTE
UNDER
3−NN (nfs)
0.0
0.4
0.8
NC
SMOTE
UNDER
5−NN (nfs)
0.0
0.4
0.8
NC
SMOTE
UNDER
1−NN
0.5
0.7
0.9
NC
SMOTE
UNDER
3−NN
0.5
0.7
0.9
NC
SMOTE
UNDER
5−NN
0.5
0.7
0.9
NC
SMOTE
UNDER
1−NN (nfs)
0.2
0.6
1.0
NC
SMOTE
UNDER
3−NN (nfs)
0.2
0.6
1.0
NC
SMOTE
UNDER
5−NN (nfs)
0.2
0.6
1.0
NC
SMOTE
UNDER
Sotiriou
ER
Sotiriou
Grade
Pittman
ER
Pittman
Grade
Miller
ER
Miller
Grade
PA
PA
1
PA
2
AUC
G−means
Fig. 1.
Performance of the classifiers on gene expression data sets. The figure shows various accuracy measures obtained by training k-NN classification
algorithms with or without (nfs) feature selection on different data sets and classification tasks. The classification algorithms were trained on original data
(NC), on SMOTE-augmented balanced training sets (SMOTE) or undersampled balanced training sets (UNDER).
the training set was larger. This effect was more pronounced
when the differences between classes were smaller (grade
classification) or for smaller sample sizes.
For most classifiers SMOTE improved the PA of the minor-
ity class, compared to the uncorrected analyses. The classifiers
that benefited the most from the use of SMOTE were the k-
NN classifiers, especially 5-NN (note that variable selection
was performed); SMOTE was somehow beneficial also for
PAM and PLR, while the minority class PA improved only
moderately for DLDA, RF, SVM and CART, and decreased for
DQDA. However, SMOTE did not remove the class-imbalance
problem and, even if it was beneficial it generally performed
worse than undersampling. The exceptions were PAM and 5-
NN for ER classification (but not for grade), where the drop
in the PA of the minority class was very moderate.
91
91
DLDA
0.75
0.85
0.95
NC
SMOTE UNDER
DQDA
0.75
0.90
NC
SMOTE UNDER
RF
0.75
0.90
NC
SMOTE UNDER
SVM
0.75
0.85
0.95
NC
SMOTE UNDER
PAM
0.75
0.85
0.95
NC
SMOTE UNDER
PLR
0.70
0.85
1.00
NC
SMOTE UNDER
CART
0.6
0.8
1.0
NC
SMOTE UNDER
DLDA
0.55
0.70
0.85
NC
SMOTE UNDER
DQDA
0.55
0.70
0.85
NC
SMOTE UNDER
RF
0.60
0.75
NC
SMOTE UNDER
SVM
0.50
0.65
0.80
NC
SMOTE UNDER
PAM
0.50
0.65
0.80
NC
SMOTE UNDER
PLR
0.55
0.70
0.85
NC
SMOTE UNDER
CART
0.50
0.65
0.80
NC
SMOTE UNDER
DLDA
0.75
0.90
NC
SMOTE UNDER
DQDA
0.75
0.90
NC
SMOTE UNDER
RF
0.70
0.85
1.00
NC
SMOTE UNDER
SVM
0.70
0.85
1.00
NC
SMOTE UNDER
PAM
0.75
0.90
NC
SMOTE UNDER
PLR
0.6
0.8
NC
SMOTE UNDER
CART
0.5
0.7
0.9
NC
SMOTE UNDER
DLDA
0.70
0.85
NC
SMOTE UNDER
DQDA
0.70
0.85
NC
SMOTE UNDER
RF
0.65
0.80
0.95
NC
SMOTE UNDER
SVM
0.65
0.80
NC
SMOTE UNDER
PAM
0.60
0.75
0.90
NC
SMOTE UNDER
PLR
0.6
0.8
NC
SMOTE UNDER
CART
0.50
0.65
0.80
NC
SMOTE UNDER
DLDA
0.75
0.85
0.95
NC
SMOTE UNDER
DQDA
0.75
0.85
0.95
NC
SMOTE UNDER
RF
0.5
0.7
0.9
NC
SMOTE UNDER
SVM
0.70
0.85
1.00
NC
SMOTE UNDER
PAM
0.75
0.90
NC
SMOTE UNDER
PLR
0.2
0.6
1.0
NC
SMOTE UNDER
CART
0.4
0.6
0.8
1.0
NC
SMOTE UNDER
DLDA
0.75
0.90
NC
SMOTE UNDER
DQDA
0.75
0.90
NC
SMOTE UNDER
RF
0.6
0.8
1.0
NC
SMOTE UNDER
SVM
0.75
0.90
NC
SMOTE UNDER
PAM
0.75
0.90
NC
SMOTE UNDER
PLR
0.5
0.7
0.9
NC
SMOTE UNDER
CART
0.6
0.8
1.0
NC
SMOTE UNDER
Sotiriou
ER
Sotiriou
Grade
Pittman
ER
Pittman
Grade
Miller
ER
Miller
Grade
PA
PA
1
PA
2
AUC
G−means
Fig. 2. Performance of the classifiers on gene expression data sets. The figure shows various accuracy measures obtained by training different classification
algorithms on different data sets and classification tasks. The classification algorithms were trained on original data (NC), on SMOTE-augmented balanced
training sets (SMOTE) or undersampled balanced training sets (UNDER).
IV. C
ONCLUSION
In our reanalysis of the breast cancer data sets only k-
NN classifiers seem to benefit substantially from the use of
SMOTE, provided that variable selection is performed before
SMOTE; the benefit is larger if more neighbors are considered.
SMOTE for k-NN without variable selection should not be
used, because it biases the classification towards the minority
class.
PLR and RF benefit from SMOTE in some circumstances,
but the improvements in the predictive accuracy of the minor-
ity class are moderate when compared to the results obtained
using the uncorrected classifiers. The benefit of SMOTE
for PAM is limited to situations where variable selection is
performed before using PAM, which is not a normally used
procedure, and can be explained as the effect of removing the
PAM-embedded class-imbalance correction, which increases
the probability of classification in the majority class.
For RF, SVM, PLR, CART and DQDA simple undersam-
pling seems to be more useful than SMOTE in improving
the predictive accuracy of the minority class without greatly
sacrificing the predictive accuracy of the majority class. The
performance of SMOTE and undersampling seems very simi-
92
92
1−NN
PA for ER−
and ER+ class (%)
5 ER−
samples
10 ER−
samples
0
3
06
09
0
0
3
06
09
0
50
60
70
80
90
3−NN
0
30
60
90
0
30
60
90
50
60
70
80
90
5−NN
0
30
60
90
0
30
60
90
50
60
70
80
90
DLDA
0
30
60
90
0
30
60
90
50
60
70
80
90
DQDA
0
30
60
90
0
30
60
90
50
60
70
80
90
RF
ER+ in training (%)
PA for ER−
and ER+ class (%)
5 ER−
samples
10 ER−
samples
0
3
06
09
0
0
3
06
09
0
50
60
70
80
90
SVM
ER+ in training (%)
0
3
06
09
0
0
3
06
09
0
50
60
70
80
90
PAM
ER+ in training (%)
0
3
06
09
0
0
3
06
09
0
50
60
70
80
90
PLR
ER+ in training (%)
0
3
06
09
0
0
3
06
09
0
50
60
70
80
90
CART
ER+ in training (%)
0
3
06
09
0
0
3
06
09
0
50
60
70
80
90
1−NN
PA for Grade 3
and Grade 1 or 2
class (%)
5 Grade 3
samples
10 Grade 3
samples
0
3
06
09
0
0
3
06
09
0
50
60
70
80
90
3−NN
0
3
06
09
0
0
3
06
09
0
50
60
70
80
90
5−NN
0
3
06
09
0
0
3
06
09
0
50
60
70
80
90
DLDA
0
3
06
09
0
0
3
06
09
0
50
60
70
80
90
DQDA
0
3
06
09
0
0
3
06
09
0
50
60
70
80
90
RF
Grade 1 or 2 in training (%)
PA for Grade 3
and Grade 1 or 2
class (%)
5 Grade 3
samples
10 Grade 3
samples
0
3
06
09
0
0
3
06
09
0
50
60
70
80
90
SVM
Grade 1 or 2 training (%)
0
3
06
09
0
0
3
06
09
0
50
60
70
80
90
PAM
Grade 1 or 2 training (%)
0
3
06
09
0
0
3
06
09
0
50
60
70
80
90
PLR
Grade 1 or 2 training (%)
0
3
06
09
0
0
3
06
09
0
50
60
70
80
90
CART
Grade 1 or 2 training (%)
0
3
06
09
0
0
3
06
09
0
50
60
70
80
90
SMOTE
PA for ER−
PA for ER+
No correction
PA for ER−
PA for ER+
SMOTE
PA for Grade 3
PA for Grade 1 or
Grade 2
No correction
PA for Grade 3
PA for Grade 1 or
Grade 2
Fig. 3.
Performance of the classifiers on the Sotiriou data set obtained by varying the level of class-imbalance in the training set. The classifiers
were trained on original data (white triangles) or on SMOTE-augmented balanced training sets (black triangles).
lar when PAM (with variable selection) and DLDA are used,
while sometimes SMOTE performs better than undersampling
for k-NN (with variable selection). These results might seem
surprising, as simple undersampling uses only a small subset
of the data while SMOTE uses all the available data but similar
results were obtained also for low-dimensional data [7].
Our results are in agreement with the finding that SMOTE
had little or no effect on SVM when data were high-
dimensional [8]; it was also shown that bagged undersampling
techniques outperformed SMOTE for SVM. We previously ob-
served that also for the other classifiers considered in this paper
bagging techniques that use multiple undersampled training
sets outperform simple undersampling for high-dimensional
data [5].
Variable
selection
is
generally
advisable
for
high-
dimensional data, as it removes some of the noise from the
data [14]. SMOTE does not affect the ranking of variables if
the variable selection method is based on class-specific means
and variances. For example, when variable selection is based
on a two-sample
𝑡-test and a fixed number of variables are
selected the same results are obtained if variable selection
is performed before or after using SMOTE. However, the
results obtained by performing variable selection on SMOTE-
augmented data must be interpreted with great care as the p-
values are underestimated and should not be interpreted other
than for ranking purposes.
We considered only a limited number of simple classifica-
tion methods, which are known to perform well in the high-
dimensional setting, where the use of simple classifiers is
generally recommended [14]. It is possible that SMOTE might
93
93

TABLE II
A
NALYSIS OF SIGNIFICANCE OF THE DIFFERENCES BETWEEN UNCORRECTED CLASSIFIERS
(NC), SMOTE
CORRECTED CLASSIFIERS
(SMOTE)
AND CLASSIFIERS TRAINED ON UNDERSAMPLED TRAINING SET
(UNDER). I
N THE TABLE WE REPORT P
-
VALUES OBTAINED WITH
N
EMENYI
POST
-
HOC TEST FOR THE PAIRWISE COMPARISON OF THE CLASSIFIERS
.
1-NN
3-NN
5-NN
DLDA
DQDA
RF
SVM
PAM
PLR
CART
1-NN
a
3-NN
a
5-NN
a
PA
SMOTE-NC
0.9506
0.5969
0.8412
0.9037
0.9552
0.9974
0.9810
0.8749
0.9974
0.8476
0.0085
0.0105
0.0135
UNDER-NC
0.6415
0.8734
0.9837
0.8126
0.8501
0.6713
0.8720
0.5953
0.9599
0.3366
0.7896
0.9728
0.9547
UNDER-SMOTE
0.8133
0.8734
0.7525
0.9796
0.9552
0.6373
0.9377
0.8749
0.9728
0.6618
0.0781
0.0241
0.0357
PA
1
SMOTE-NC
0.4362
0.1740
0.2321
0.9813
0.9816
0.6985
0.9598
0.5525
0.6724
0.7917
0.0002
0.0002
0.0002
UNDER-NC
0.1542
0.5023
0.6949
0.8737
0.7891
0.0790
0.7213
0.2768
0.1939
0.1685
0.5622
0.4608
0.5636
UNDER-SMOTE
0.8281
0.8000
0.6949
0.9390
0.8738
0.4030
0.8689
0.8799
0.6724
0.4951
0.0421
0.0677
0.0413
PA
2
SMOTE-NC
0.2816
0.1334
0.1021
0.9209
0.9797
0.6654
0.9997
0.6626
0.2874
0.9725
0.0001
0.0001
0.0001
UNDER-NC
0.1883
0.4603
0.4272
0.8183
0.8269
0.0362
0.4853
0.6273
0.0034
0.0592
0.1328
0.1173
0.2330
UNDER-SMOTE
0.9727
0.7614
0.7275
0.9721
0.7193
0.2833
0.4693
0.9985
0.3291
0.1051
0.1328
0.1692
0.1185
AUC
SMOTE-NC
0.4854
0.9660
0.9672
0.9996
0.9997
0.9346
0.8672
0.9975
0.7525
0.3098
0.3756
0.3969
0.5937
UNDER-NC
0.6180
0.7026
0.9143
0.9951
0.9134
0.9040
0.2879
0.9352
0.9842
0.1170
0.7238
0.4945
0.5937
UNDER-SMOTE
0.9728
0.8399
0.7978
0.9951
0.9134
0.7196
0.5850
0.9521
0.6540
0.8740
0.0770
0.0295
0.1163
G-mean
SMOTE-NC
0.4954
0.7624
0.6955
0.8971
0.8910
0.8265
0.8798
0.9727
0.5647
0.9985
0.5953
0.4627
0.5613
UNDER-NC
0.5974
0.6287
0.3966
0.8504
0.9796
0.6198
0.9429
0.9568
0.1337
0.8489
0.3115
0.3687
0.2830
UNDER-SMOTE
0.9812
0.9716
0.8719
0.9895
0.9609
0.9336
0.7052
0.9987
0.6651
0.8187
0.0302
0.0199
0.0199
a
Results obtained by including all available genes (no feature selection)
be more beneficial for some classifiers that were not included
in our study.
R
EFERENCES
[1] S. Ramaswamy, K. N. Ross, E. S. Lander, and T. R. Golub, “A molecular
signature of metastasis in primary solid tumors,” Nature Genetics,
vol. 33, no. 1, pp. 49–54, January 2003.
[2] M. A. Shipp, K. N. Ross, P. Tamayo, A. P. Weng, J. L. Kutok, R. C.
Aguiar, M. Gaasenbeek, M. Angelo, M. Reich, G. S. Pinkus, T. S. Ray,
M. A. Koval, K. W. Last, A. Norton, T. A. Lister, J. Mesirov, D. S.
Neuberg, E. S. Lander, and J. C. Aster, “Diffuse large b-cell lymphoma
outcome prediction by gene-expression profiling and supervised machine
learning.” Nature Medicine, vol. 8, no. 1, p. 68, 2002.
[3] N. Iizuka, M. Oka, H. Yamada-Okabe, M. Nishida, Y. Maeda,
N. Mori, T. Takao, T. Tamesa, A. Tangoku, H. Tabuchi, K. Hamada,
H. Nakayama, H. Ishitsuka, T. Miyamoto, A. Hirabayashi, S. Uchimura,
and Y. Hamamoto, “Oligonucleotide microarray for prediction of early
intrahepatic recurrence of hepatocellular carcinoma after curative resec-
tion,” The Lancet, vol. 361, no. 9361, pp. 923 – 929, 2003.
[4] H. He and E. A. Garcia, “Learning from imbalanced data,” IEEE
Transactions on Knowledge and Data Engineering, vol. 21, no. 9, pp.
1263–1284, 2009.
[5] R. Blagus and L. Lusa, “Class prediction for high-dimensional class-
imbalanced data,” BMC Bioinformatics, vol. 11, no. 1, p. 523, 2010.
[6] N. V. Chawla, K. W. Bowyer, L. O. Hall, and W. P. Kegelmeyer,
“SMOTE: synthetic minority over-sampling technique,” Journal of Ar-
tificial Intelligence Research, vol. 16, pp. 341–378, 2002.
[7] J. V. Hulse, T. M. Khoshgoftaar, and A. Napolitano, “Experimental
perspectives on learning from imbalanced data,” in Proceedings of the
Twenty-Fourth International Conference (ICML), 2007, pp. 935–942.
[8] B. Wallace, K. Small, C. Brodley, and T. Trikalinos, “Class imbalance,
redux,” in Data Mining (ICDM), 2011 IEEE 11th International Confer-
ence on, dec. 2011, pp. 754 –763.
[9] T. Fawcett, “An introduction to ROC analysis,” Pattern Recognition
Letters, vol. 27, no. 8, pp. 861 – 874, 2006.
[10] C. Sotiriou, S.-Y. Neo, L. M. McShane, E. L. Korn, P. M. Long,
A. Jazaeri, P. Martiat, S. B. Fox, A. L. Harris, and E. T. Liu, “Breast
cancer classification and prognosis based on gene expression profiles
from a population-based study,” Proceedings of the National Academy
of Science USA, vol. 100, no. 18, pp. 10 393–10 398, September 2003.
[11] J. Pittman, E. Huang, H. Dressman, C. Horng, S. Cheng, M. Tsou,
C. Chen, A. Bild, E. Iversen, A. Huang, J. Nevins, and M. West,
“Integrated modeling of clinical and gene expression information for
personalized prediction of disease outcomes.” Proceedings of National
Academy of Science USA, vol. 101, no. 22, pp. 8431–6, 2004.
[12] L. D. Miller, J. Smeds, J. George, V. B. Vega, L. Vergara, A. Ploner,
Y. Pawitan, P. Hall, S. Klaar, E. T. Liu, and et al., “An expression
signature for p53 status in human breast cancer predicts mutation status,
transcriptional effects, and patient survival.” Proceedings of the National
Academy of Sciences of the United States of America, vol. 102, no. 38,
pp. 13 550–13 555, 2005.
[13] J. Demˇsar, “Statistical comparisons of classifiers over multiple data sets,”
Journal of Machine Learning Research, vol. 7, pp. 1–30, Dec. 2006.
[14] S. Dudoit, J. Fridlyand, and T. P. Speed, “Comparison of discrimination
methods for the classification of tumors using gene expression data,”
Journal of the American Statistical Association, vol. 97, no. 457, pp.
77–87, 2002.
94
94
Wyszukiwarka
Podobne podstrony:
Gor±czka o nieznanej etiologii
02 VIC 10 Days Cumulative A D O Nieznany (2)
Abolicja podatkowa id 50334 Nieznany (2)
45 sekundowa prezentacja w 4 ro Nieznany (2)
4 LIDER MENEDZER id 37733 Nieznany (2)
Mechanika Plynow Lab, Sitka Pro Nieznany
katechezy MB id 233498 Nieznany
2012 styczen OPEXid 27724 Nieznany
metro sciaga id 296943 Nieznany
Mazowieckie Studia Humanistyczn Nieznany (11)
cw 16 odpowiedzi do pytan id 1 Nieznany
perf id 354744 Nieznany
DO TEL! 5= Genetyka nadci nieni Nieznany
Opracowanie FINAL miniaturka id Nieznany
3 Podstawy fizyki polprzewodnik Nieznany (2)
interbase id 92028 Nieznany
Mbaku id 289860 Nieznany
Probiotyki antybiotyki id 66316 Nieznany
więcej podobnych podstron