1
2000, QualityToolBox.com, LLC, all rights
reserved
A STRATEGY FOR
PERFORMANCE
EXCELLENCE
2
2000, QualityToolBox.com, LLC, all rights
reserved
Executive
Overview
Participant
manual
Tools
Workbook
Knowledge
Breakthrou
gh
Lecture
notes
Lecture
notes
Performance Excellence
Series
Training Module Elements
3
2000, QualityToolBox.com, LLC, all rights
reserved
Session 1.0
Introduction…….……...…………………….
3
Session 2.0
Waste Management ………………………..
14
Session 3.0
5S Implementation………………………….
20
Element 3.1
Systematic
Organization…………………... 31
Element 3.1.1 Red Tag
System……………………………. 47
Element 3.2
Sorting Visual
Placement………………….. 33
Element 3.2.1 Visual Sign
System………………………….. 66
Element 3.2.2 Visual Color
System………………………... 76
Element 3.3
Scrubbing
Clean……………………………. 40
Element 3.4
Standardizing
Control……………………... 45
Element 3.5
Self Discipline
Control……………………... 48
4
2000, QualityToolBox.com, LLC, all rights
reserved
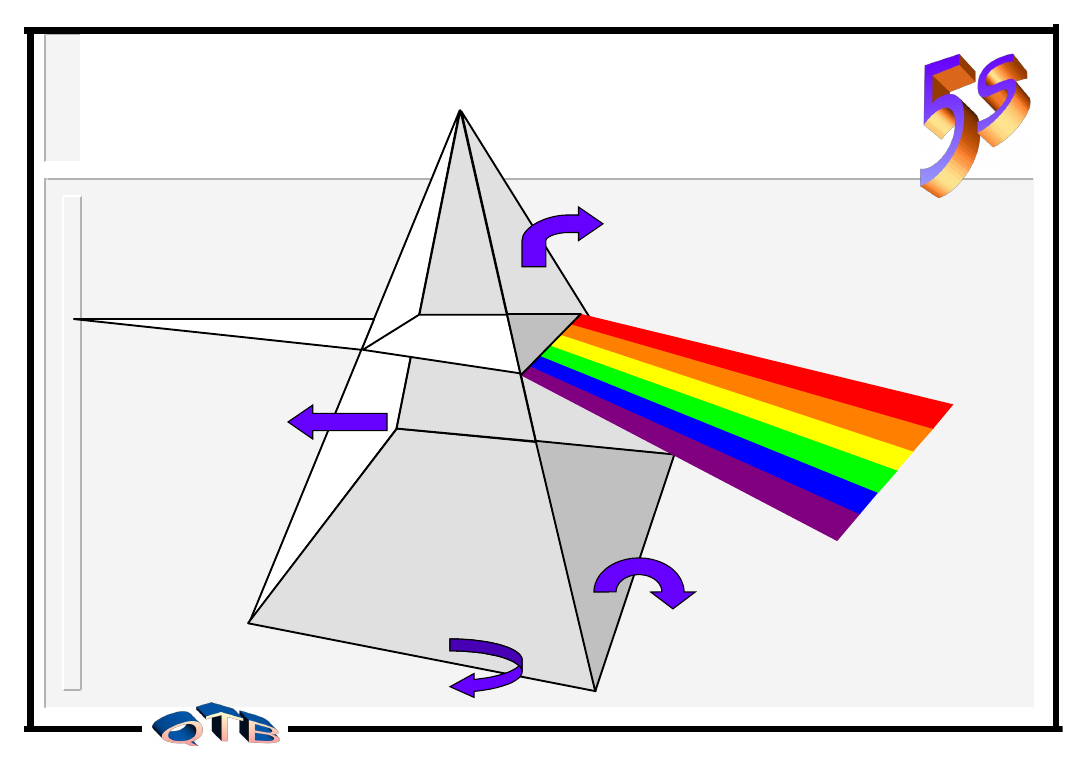
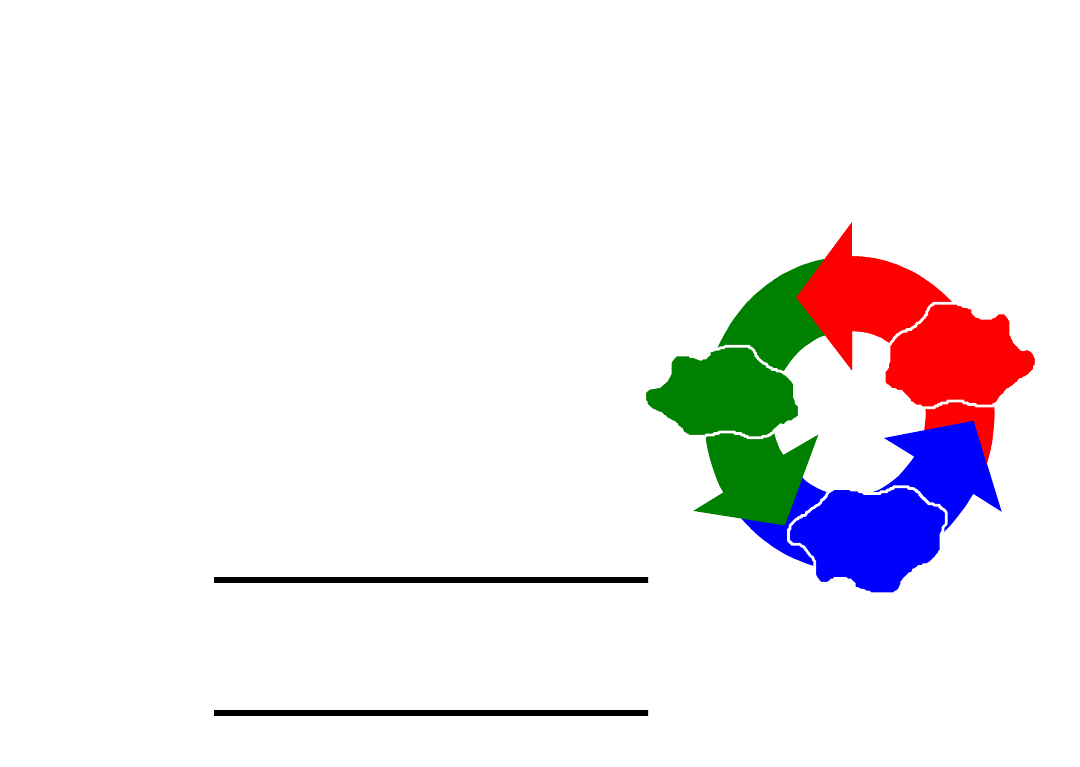
What is 5S ?
An essential step required for Waste
Elimination
An integral step in Kaizen
A required element to achieve Lean-site
Manufacturing.
Systematic
Organizatio
n
“Seiri”
Orderliness
“Seiton”
Cleanliness
“Seiso”
Cleanup
“Seiketsu”
Cleanup
“Seiketsu”
Standardization/Perseveranc
e
“Shitsuke”
5
2000, QualityToolBox.com, LLC, all rights
reserved
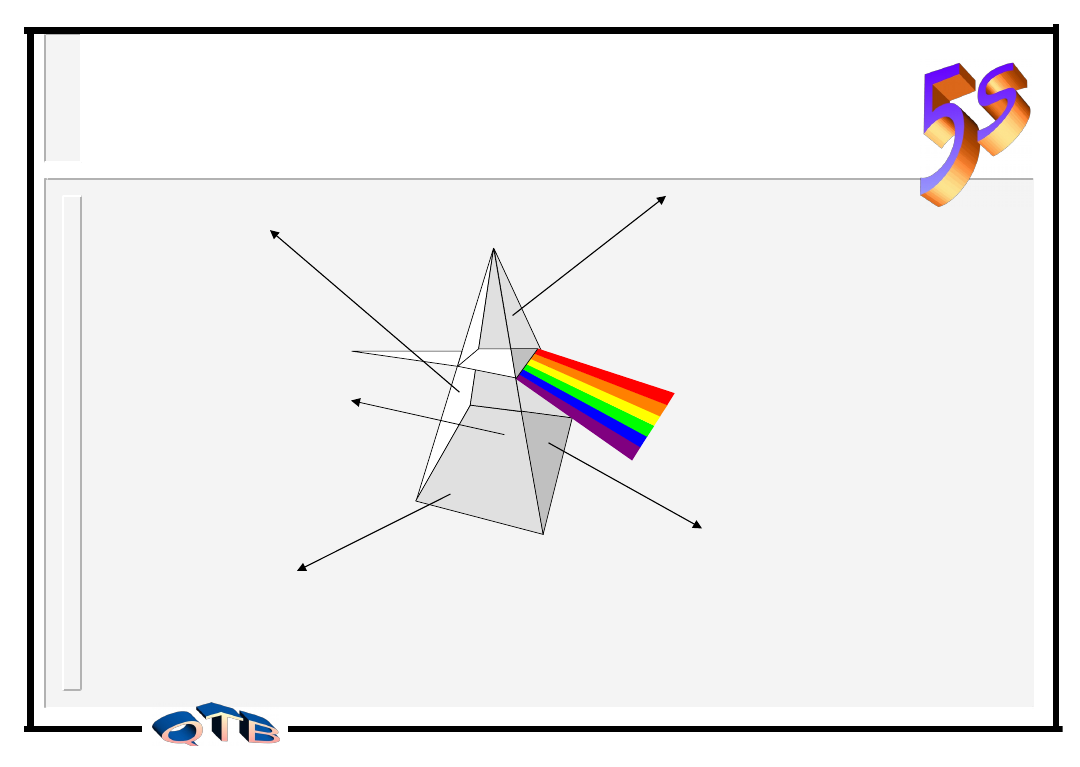
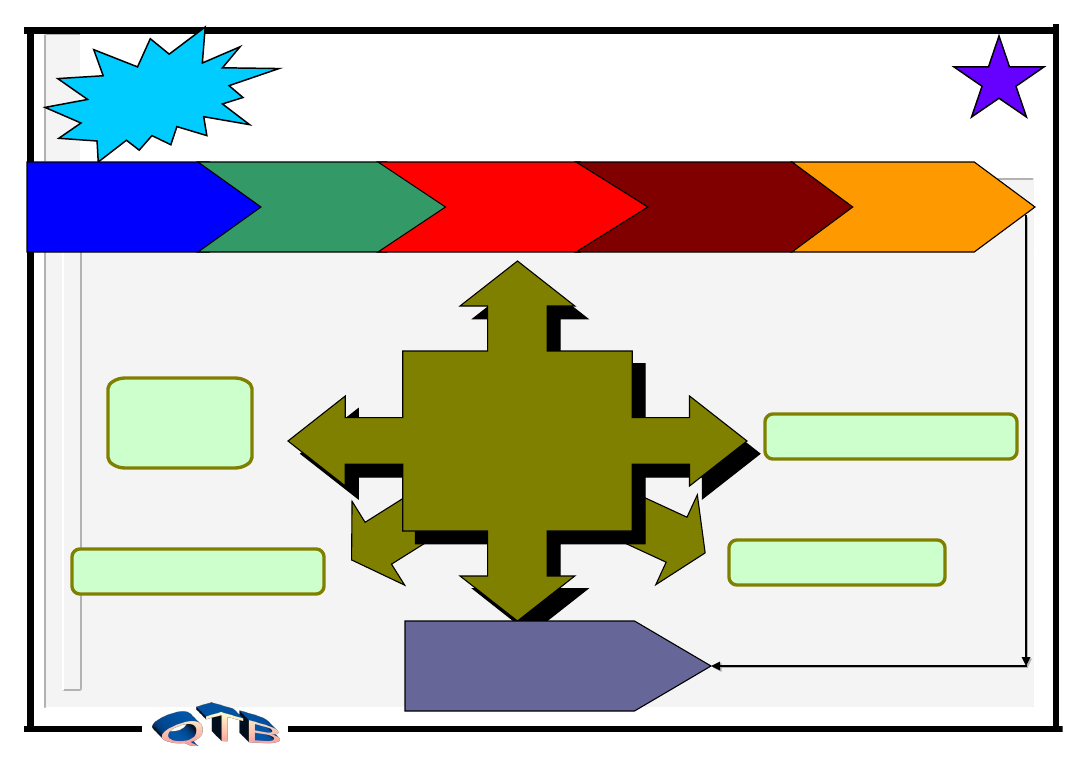
5S Performance Excellence
Model
Systematic-
Systematic
Organization
Scrubbing
clean
Self-
Discipline-
Control
Customer
Expectations
Sorting Visual
Placement
Standardizin
g Control
Improved Quality
Improved Safety
Reduced costs
Consistent Deliveries
Improved Product/
Service Options
6
2000, QualityToolBox.com, LLC, all rights
reserved
The Five Elements of 5S
Systematic Systematic
Organization-
Identifying what items
are required and which
are not.
Sorting Visual
Placement- Items
should be easily
retrievable, easy to get,
and visual-easy to see.
Self-
Discipline/Control-
Ensuring that
Systematic
Organization, Visual
Placement &
Cleanliness are
maintained.
Scrubbing Clean-Keep the area free
from debris, dirt, oil, items not needed.
Standardizing
Control- Maintain
and continually
improve the previous
improvements.
7
2000, QualityToolBox.com, LLC, all rights
reserved
Major
CPI
Tools
(6
) Kaizen Lean
Description
Cp/Cpk
Process capability assessment
DOE
Design of experiments
SPC
Process control based on statistics and data analysis
FMEA
Risk assessment tool
Regression
Correlate effect one variable has on another
Process Map
Map process steps to communicate and identify opportunities
5 whys /2 hows Determination methods for root cause
discovery
Pareto
Column chart ranking items highest to lowest
Fishbone
Cause / Effect Diagram
5S
Elimination waste
Visual Mgmt
Emphasis on visual techniques to manage process
Poka-Yoke
Error proofing techniques
Spagetti Chart
Kanban
Material storage technique used to control process
Takt Time
Determine pace or beat of a process
Std Work
Evaluate tasks done during a process
SMED
Single minute exchange of dies - Quick machine set up
TPM
Integrate maintenance strategy with process
Cellular Flow
Reduce inventory & cycle time thru process layout and pull
production techniques
Expand Process Improvement Program to Utilize Kaizen Tool Kit
Expand Process Improvement Program to Utilize Kaizen Tool Kit
Tool Kit Comparison
8
2000, QualityToolBox.com, LLC, all rights
reserved
6 Sigma
• Disciplined Methodology
• Technical Approach
(Quantitative)
• Data Driven - Statistical
• Customer Focus
• Reduce Variation
• Focus on Large Impact
• Larger/Longer Projects
Kaizen
• Philosophical
Approach
• Common Sense
Approach
(Qualitative)
• Data Driven -
Observation
• Operational Focus
•
Waste Elimination
5S
• Incremental Change
• Smaller/Shorter
Projects
Complimentary Tools Driving Continuous Improvement
Complimentary Tools Driving Continuous Improvement
Expanding the Strategy
Performance
Excellence
9
2000, QualityToolBox.com, LLC, all rights
reserved
Comparative Analysis
Improvement Methodologies
• Similar in Structure
• Improvements measured against
established process
• Team oriented
• Similar improvement tools
• Measure effectiveness of
improvements
• Maintain new performance level
• Standardize & Proceduralize
Results
• More Efficient Processes
Comparison
• Both are Effective Improvement
Mechanisms
• CPI/6s best applied to large complex
problems
• Kaizen/Lean best applied to achieve
incremental changes and eliminate
wastes.
Measure
- Data Collection
- Determine Process Potential / Goals
Evaluate
- Root Cause / Vital Few
- Statistical Analysis
Improve & Verify
- Implement Improvement
- Validate Improvement
Standardize
- Standardize / Leverage
- SPC
- Update Procedures
Evaluate
- Baseline Process Performance
- Establish Target
Decide
-Compare solutions
- Choose
Act
-Communicate
- Implement improvement
- Control
Measure
- Validate improvement
- Standardize
- Update Procedures
Focus
- Reduce Process Variation
- Identify Critical Cause and Focus
Resources for Maximum Impact
Focus
-
Eliminate Waste 5S
- Seek Incremental Process Changes
Kaizen/Lean
6
Summary
- Technical Approach based on
Statistical Analysis
- Requires Significant Data Collection
- Best applied to Manufacturing
Processes
- Typical Projects 1-3 Months
Summary
- Common Sense Approach based on
Observation
- Applicable to all types of processes
- Defined improvement strategy
- Typical Projects 1 week
10
2000, QualityToolBox.com, LLC, all rights
reserved
Why 5S
•To eliminate the wastes that result from
“uncontrolled” processes.
• To gain control on equipment, material & inventory
placement and position.
• Apply Control Techniques to Eliminate Erosion of
Improvements.
• Standardize Improvements for Maintenance of
Critical Process Parameters.
Look
Familiar
?
11
2000, QualityToolBox.com, LLC, all rights
reserved
Overproduction
Delays (waiting time)
Transportation
Process
Inventories
Motions
Defective products
Untapped Resources
Mis-used Resources
9
Waste
s
The Nine types of
wastes.
12
2000, QualityToolBox.com, LLC, all rights
reserved
Overproduction ______________________________
Delays (waiting time)__________________________
Transportation _______________________________
Process_____________________________________
Inventories__________________________________
Motions ____________________________________
Defective products ____________________________
Untapped Resources __________________________
Mis-used Resources ___________________________
9
Waste
s
Give an example of each type of
waste.
The Nine types of wastes
Think Break
13
2000, QualityToolBox.com, LLC, all rights
reserved
5 S Element
Waste/ Improvement Item
Deliverable
Systematic
Organization
Elimination of finding.
Reduction of part selection errors.
Reduced Costs
Improved Quality
Increased Product Options
Sorting-Visual
Placement
Elimination of finding.
Elimination of nonconformances.
Elimination of motion.
Reduction of part selection errors.
Reduced Costs
Increased Safety
Improved Quality
Increased Product Options.
Scrubbing Clean
Increased safety.
Preventive maintenance.
Increased equipment knowledge.
Increased Safety
Improved Quality
Standardization
Control
Increased equipment life.
Higher morale.
Clean environment.
Increased visibility of nonconformances.
Improved Quality
Consistent Delivery
Improved Safety
Elimination of Waste
14
2000, QualityToolBox.com, LLC, all rights
reserved
Systematic
Organization
Cleanliness
Visual Placement
Standardization
5 S
Implementation
Plan
Progressive
Enhancement
s
Step 1
Establish 5 S
Implementation Team
Step 2
Develop Specific
Implementation Plan
Step 3
Develop Communication
Plan
Step 4
Develop 5 S Training Plan
Step 5
Implement 5 S
Step 6
Verification of Effectiveness
15
2000, QualityToolBox.com, LLC, all rights
reserved
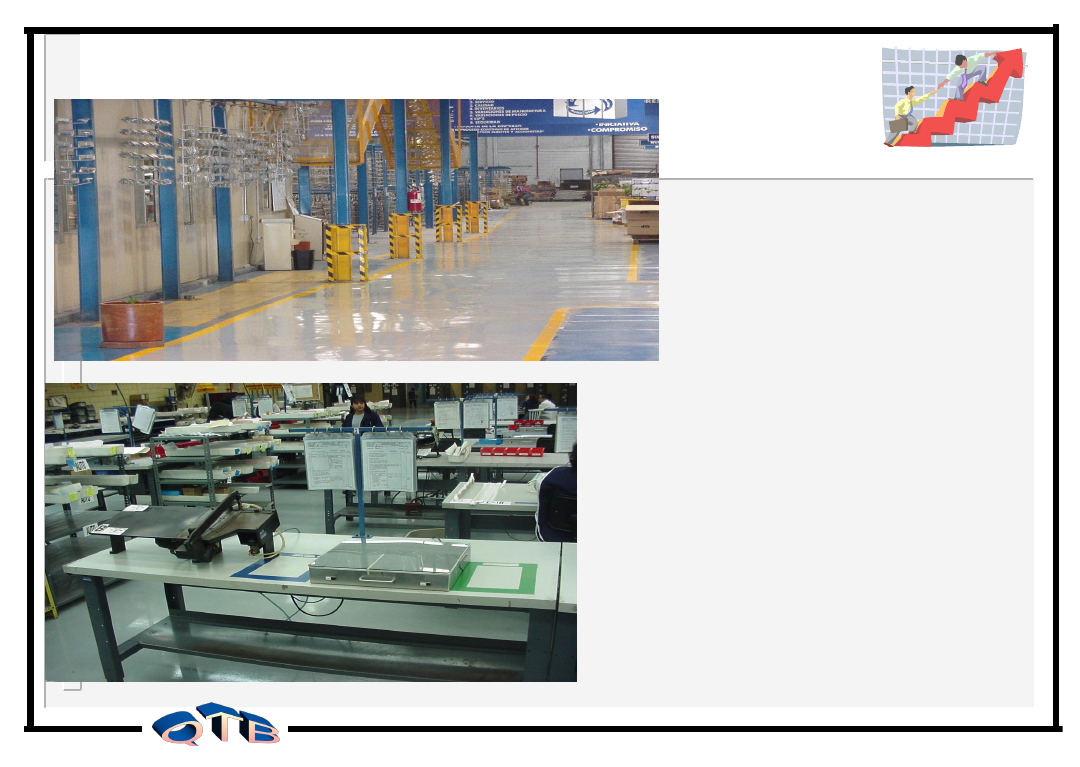
Removing “
Red Tagged
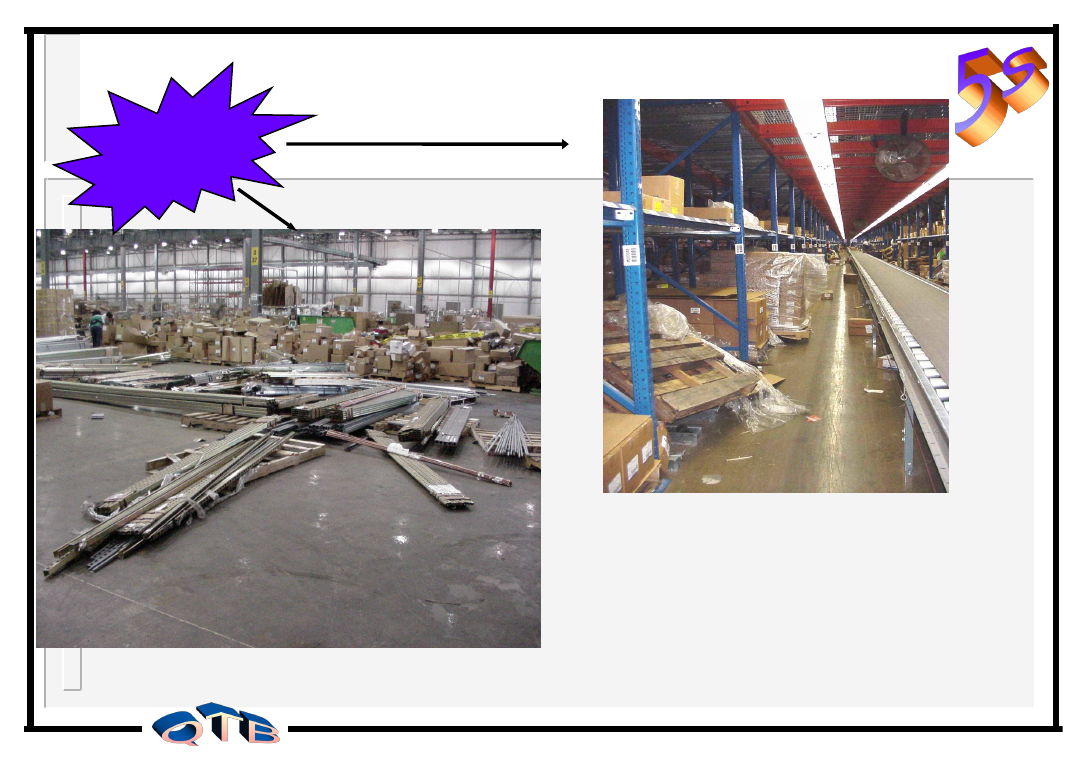
” stuf
What Stuf would you “Red Tag” in these
pictures
?
Picture
A__________________________________________________________
Picture B
_________________________________________________________
Think
Break
16
2000, QualityToolBox.com, LLC, all rights
reserved
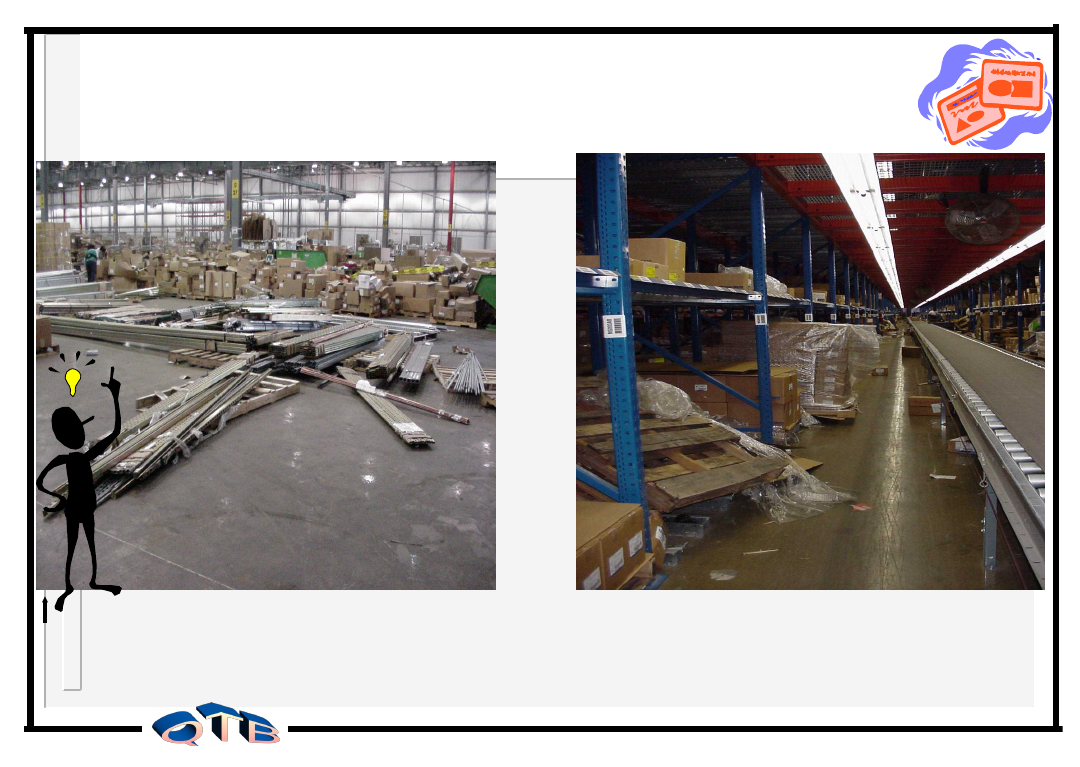
In the following pictures, identify some of the “finding wastes “
( assume you work in a distribution center and you have to fill an
order with product located in the following pictures).
___________________
___________________
_________________
___________________
___________________
_________________
___________________
___________________
_________________
___________________
___________________
_________________
Everything
has a
useable place
Think Break
Finding Wastes
17
2000, QualityToolBox.com, LLC, all rights
reserved
Some evidence of standardized work
areas
•Clear, shiny aisle
ways
•Color coded areas
•Slogans, banners
•No work-in-process ( WIP
)
•One-Piece Flow
•Standardized Work
Sheets
18
2000, QualityToolBox.com, LLC, all rights
reserved
Visual Color System Implementation
• Develop a map identifying the “access ways”(aisles,
entrances, walkways etc.) and the “action” areas.
• Perform any necessary realignment of walkways, isles,
entrances.
• Assign an address to each of the major action areas.
• Mark of the Walkways, Aisles & entrances from the action
areas Table 1.0
• Apply flow-direction arrows to aisles & walkways Table 1.0
• Perform any necessary realignment of action areas.
• Mark-of the inventory locations Table 1.0.
• Mark-of equipment/machine locations Table 1.0
• Mark-of storage locations( Cabinets,shelves,tables) Table
1.0
• Color-code the floors and respective action areas per Table
1.0.
19
2000, QualityToolBox.com, LLC, all rights
reserved
Cleanliness involves cleaning
every aspect of the Organization
and the removal of dirt, dust,oil,
scraps on the floor, & garbage.
Key Deliverables
A
clean
Systematic Organization results in
increased safety
and
eficiency
.
Increas
ed
Safety
Increas
ed
Eficien
cy
20
2000, QualityToolBox.com, LLC, all rights
reserved
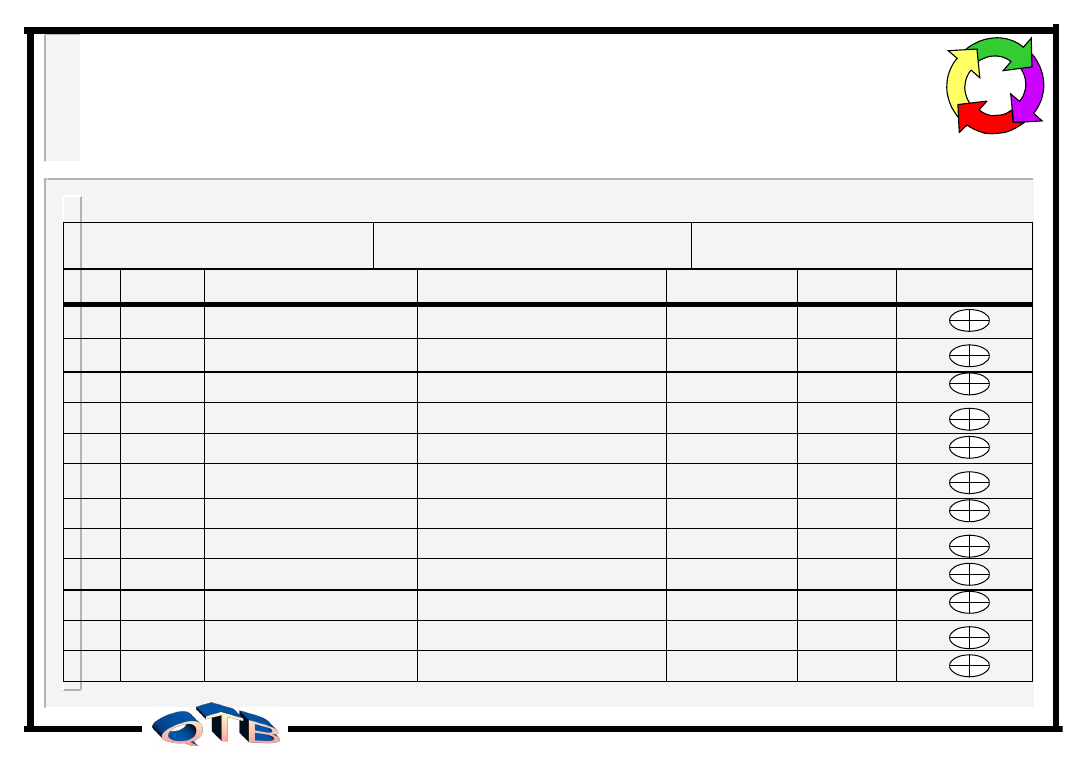
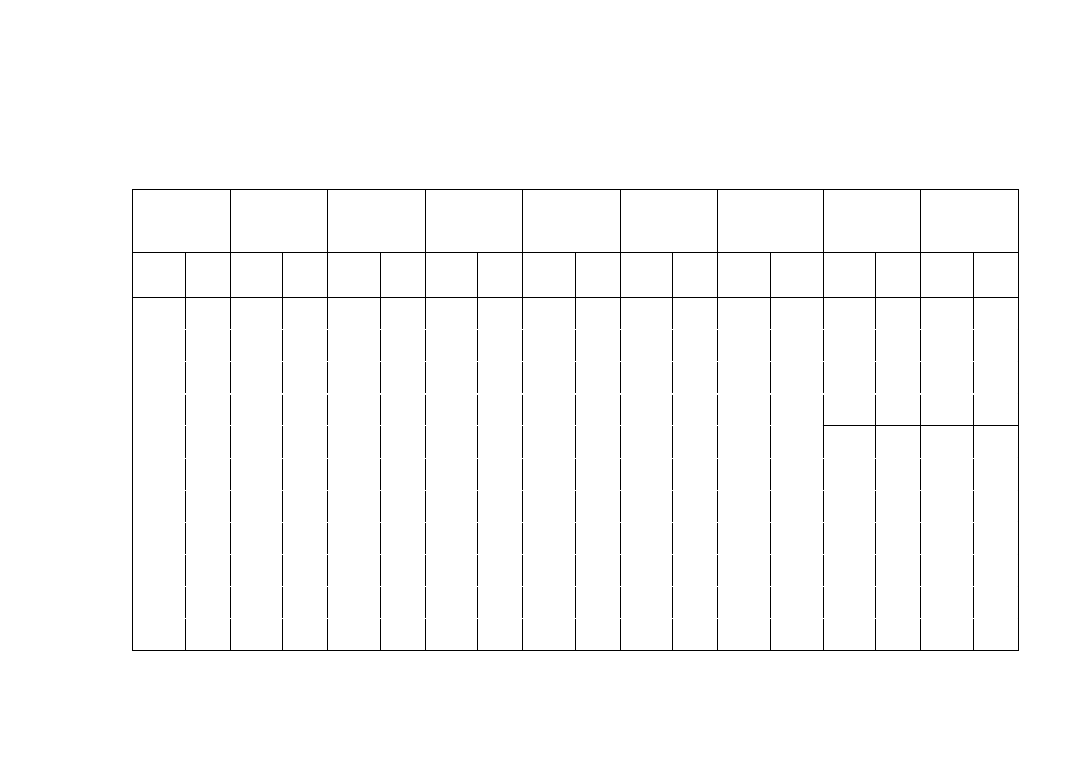
Step 2:
Allocation:
Assign resources to the specific tasks required to make
3S a
habit.
5S “To Do” Plan
Date:
Page of
5S Team Members
Company/Division Name:
Person Preparing This
Sheet
Item
#
Date
Started
5S element
5S Task - Action
Person
Responsible
Location/
Department
Percent
Complete
100
25
75
50
100
25
75
50
100
25
75
50
100
25
75
50
100
25
75
50
100
25
75
50
100
25
75
50
100
25
75
50
100
25
75
50
100
25
75
50
100
25
75
50
100
25
75
50

5S for the Workplace
Training and
Sourcebook
for
5S Worksheets
How to Use This Manual
The continuous improvement tools that are presented in Sections
1-10 of this manual are shown in order of use. These forms
MUST be completed in the order presented in this manual. Each
section contains a brief description of the tool, its purpose, when
to use it, who should use it, how to use it, and the expected
results.
Remember to focus on the elimination of waste.
Strive to maximize yields and obtain cost reductions
from existing machinery and equipment before
“buying solutions”. Improve current systems and
techniques before automation. Automating a system
or practices without first having an understanding of
the process will not solve underlying process
problems.
Perhaps the most important point to remember is that
we must understand a process before we make any
attempt in changing it. “No Tampering” is the first rule
of continuous improvement. We can not tamper with
a process without understanding it.
By using these tools, we will all share a common and
systematic approach for questioning, analyzing,
proposing solutions, experimenting, and finally,
implementing proven changes.
“The problems that exist in the world
today
cannot be solved by the same level of
thinking
that created them.”
Im
p
rove
m
e
n
t
Id
e
n
tify
w
aste
M
e
a
su
re
m
e
n
t
5
S
Te
m
p
la
te
Table of Contents
Section 1
Development of 5S “To Do” Plan: Establishment of the 5S team focused on
the development, training, and implementation of the company’s 5S program.
Deliverable includes action plan and associated tasks with the 5S
implementation. …………………………………………………………………………
4
Section 2
Waste Identification Map: Identification of the 9 wastes associated with
production of products and services. A detailed map of each major work area is
developed describing the major types of wastes in each area. These wastes are
the improvement opportunities that exist prior to
5S………………………………...
The overall wastes is calculated for all the work areas and identified on the 9
Waste Radar Chart
7
Section 3
5S Action sheet: Establishing baseline key performance metrics in terms of
key deliverables, photographs, and current conditions of the “before” 5S
implementation phase. Deliverable includes the 5S action
sheet………………….
11
Red Tag Strategy: The utilization of “Red Tags” to visually identify items which
are not needed or used infrequently…………………………………………………..
14
Section 5
Visual Color Sheets: Utilization of colors to identify specific work actions,
inventory locations, access areas within the work environment. Initialization
begins with development of Visual Color
Sheets…………………………………….
17
Section 6
Visual Sign Sheets: Utilization of signs to identify machine, equipment, tooling,
inventory, safety, hazard and work center locations. Sample Sign
Sheets……….
20
Section 7
Standard Cleaning Work Sheet: A cleaning matrix identifying the work area
responsibilities, supplies, and schedules for cleaning. ……………………………..
23
Section 8
Cleaning “To Do List”: A action list identifying specific cleaning tasks for each
work area identified on the Standard Cleaning Work Sheet………………………..
27
Section 9
5S Status Report: A report identifying implementation effectiveness of each 5S
steps applied. A variable metric ranging from 0-5 is established for each step
implemented……………………………………………………………………………..
30
Section 10
Waste Identification Map: Identification of the 9 wastes associated with
production of products and services. A detailed map of each major work area is
developed describing the major types of wastes in each area. These wastes are
the improvement opportunities that exist prior to 5S……………………………
9 Wastes Radar Chart: After the completion of 5S, the results of the waste reduction
is recorded, charted and compared to the initial 9 Waste Radar Chart.
33

Section 2
Waste Identification Map
Manager or Team Leader
(Section A)
Area or Process Name
(Section B)
Person Preparing This Sheet
(Section C)
Over production
Delays
Transportation
Process
Inventory
Motion
Defective Product
Defective
Untapped
Resources
Mis-used
Resources
Waste Identification
Map
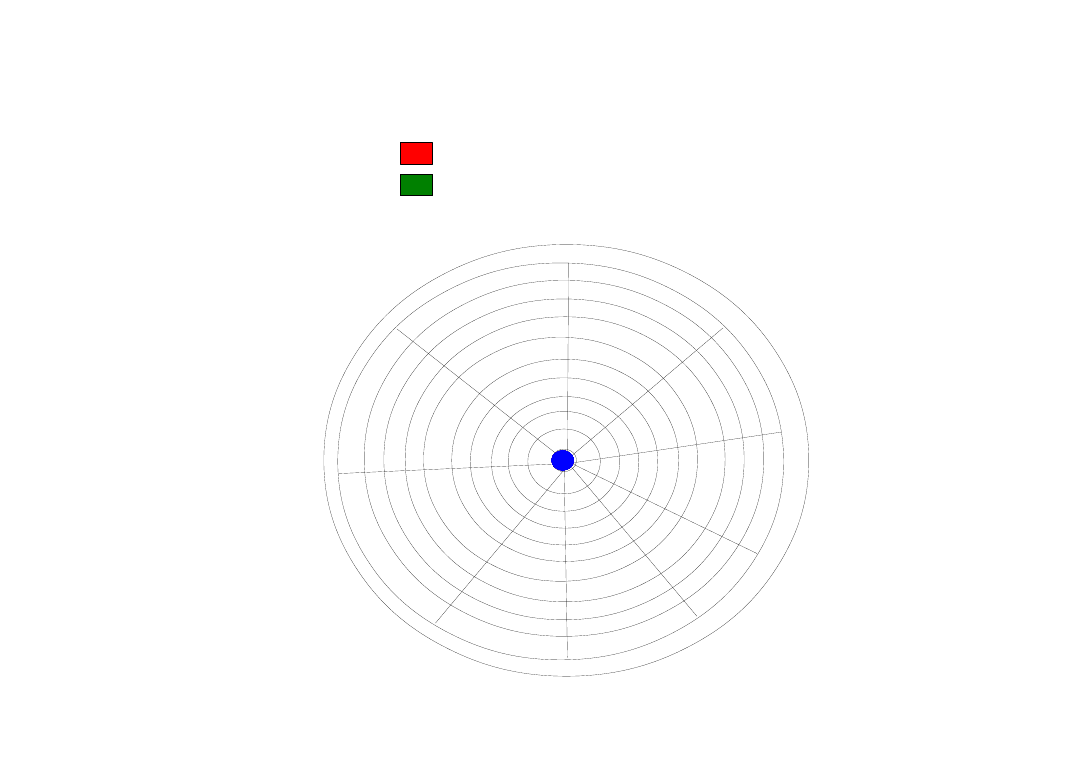
9 Waste Radar Chart
% of Waste Before 5S
% of Waste After 5S
0
Defective Product
Transportation
Delays
Resources
Mis-used
Process
10
Motion
Inventory
Untapped
Resources
90
70
20
30
40
50
60
80
100
Over production
Overproduction
Delays
Transportation
Inventory
Motion
Processes
Defective
Products
Untapped
Resources
Mis- Used
Resources
Before
After
Before
After
Before
After
Before
After
Before
After
Before
After
Before
After
Before
After
Before
After
100
90
80
70
60
50
40
30
20
10
%
o
f W
as
te
0
The Nine
Wastes
P
e
rc
e
n
ta
g
e
o
f
W
a
st
e

Waste Identification Map
Purpose
Used to create a visual picture of a work area to assess waste in work place
organization, office/cell layout and crewing. Shows the type of each waste in
section/division of the organization. Also utilized to indicate equipment type,
size, and distances within each work area.
When To Use
The Waste Identification Map should be used after the 5S “To Do” plan is
completed. A map should be developed for each department or focus area
of the 5S program. Do not attempt to develop a single Map for an entire
organization, it will become too busy to be effective.
Who Should Use It
The Waste Identification Map can be used by anyone involved in continuous
process improvement.
Expected Benefits
The Waste Identification Map will provide information about work waste in
each department, work sequence, equipment layout and distances. The
Waste Identification Map not only provides actual waste, but also provides a
visual layout of the interrelationship of the waste.

How To Use It
1. Referring to the 5S “To Do” Plan, identify each respective area 5S will
be implemented. Develop a Waste Identification Map for each area or
department and complete sections A, B, C, with the necessary
information. Note you may have multiple Maps for the entire 5S
implementation program.
2. For each work department, fill in the equipment, access areas,
storage areas, inventory locations etc. on the Map. It is best to draw
these to scale.
3. Next identify the processes for each area on the Map.
4. Next, list the products and services at each applicable workstation.
5. Next, identify the product/service flow through the respective
processes & work stations.
6. Establish time trials for each major activity and when completed
document the time for each major activity within the department.
7. Document the type of waste and time associated with each waste at
each activity, process, equipment, inventory, storage, and office
location.
8. For each type of waste identified, complete the waste matrix section on
the bottom of the 9 Waste Radar Chart in the “before” column. Note:
The y-axis list % of waste, use whatever metric makes sense i.e.
time, $, labor hours, productivity etc. Remember that your goal is
to reduce these wastes as a result of the 5S Program.
Chart the % waste value for each type of waste on the Radar Chart.
Connect each of the values on the radar chart. This is extremely important,
this is your baseline metric and will be used to determine the magnitude of
your improvements.
Next Step
You are now ready to move to the next step, the Action Sheet.


Document Outline
- Slide 1
- Slide 2
- Slide 3
- What is 5S ?
- 5S Performance Excellence Model
- The Five Elements of 5S
- Tool Kit Comparison
- Expanding the Strategy
- Comparative Analysis
- Why 5S
- Slide 11
- Slide 12
- Slide 13
- Slide 14
- Slide 15
- Slide 16
- Slide 17
- Slide 18
- Slide 19
- Slide 20
- Slide 21
- Slide 22
- Slide 23
- Slide 24
- Slide 25
- Slide 26
- Slide 27
- Slide 28
- Slide 29
- Slide 30
- Slide 31
- Slide 32
Wyszukiwarka
Podobne podstrony:
Wykład 4 , 5S
O praktykach 5S ponownie
Wdrażanie systemu zarządzania jakością11, Jakość, zarządznianie, 5S, FEMEA itp
Tematy do opracowania Metrologia BP 5s
ZASADA 5S
5S opis
LinearAlgebra 3(5s)
5s rach współrz
Metoda 5S
TQM, referat QFD i 5S
5s
Teoria 5s, Zarządzanie zasobami ludzkimi
5S Eng
5s
Kontrola jakości, Jakość, zarządznianie, 5S, FEMEA itp
5S, żart czy poważna metoda
5s
więcej podobnych podstron