
July 30, 2002
Dr. Edward Yardeni
(212) 778-2646
ed_yardeni@prusec.com
Amalia F. Quintana
(212) 778-3201
mali_quintana@prusec.com
Asset Valuation & Allocation
Models
R e s e a r c h

Page 2 / Ju
ly 30, 2002 / Prudential Securities Asset Valuation & Allocation Models
-
Introduction
-
I. Fed’s Stock Valuation Model
How can we judge whether stock prices are too high, too low, or just right? The purpose
of this weekly report is to track a stock valuation model that attempts to answer this
question. While the model is very simple, it has been quite accurate and can also be used
as a stocks-versus-bonds asset allocation tool. I started to study the model in 1997, after
reading that the folks at the Federal Reserve have been using it. If it is good enough for
them, it’s good enough for me. I dubbed it the Fed’s Stock Valuation Model (FSVM),
though no one at the Fed ever officially endorsed it.
On December 5, 1996, Alan Greenspan, Chairman of the Federal Reserve Board,
famously worried out loud for the first time about “irrational exuberance” in the stock
market. He didn’t actually say that stock prices were too high. Rather he asked the
question: “But how do we know when irrational exuberance has unduly escalated asset
values, which then become subject to unexpected and prolonged contractions….”
1
He did
it again on February 26, 1997.
2
2
He probably instructed his staff to devise a stock market
valuation model to help him evaluate the extent of the market’s exuberance. Apparently,
they did so and it was made public, though buried, in the Fed’s Monetary Policy Report
to the Congress, which accompanied Mr. Greenspan’s Humphrey-Hawkins testimony on
July 22, 1997.
3
The Fed model was summed up in one paragraph and one chart on page 24 of the 25-
page document (see following table). The chart shows a strong correlation between the
S&P 500 forward earnings yield (FEY)—i.e., the ratio of expected operating earnings (E)
to the price index for the S&P 500 companies (P), using 12- month-ahead consensus
earnings estimates compiled by Thomson Financial First Call.—and the 10-year Treasury
bond yield (TBY). The average spread between the forward earnings yield and the
Treasury yield (i.e., FEY-TBY) is 29 basis points since 1979. This near-zero average
implies that the market is fairly valued when the two are identical:
1) FEY = TBY
Of course, in the investment community, we tend to follow the price-to-earnings ratio
more than the earnings yield. The ratio of the S&P 500 price index to expected earnings
(P/E) is highly correlated with the reciprocal of the 10-year bond yield, and on average
the two have been nearly identical. In other words, the “fair value” price for the S&P 500
(FVP) is equal to expected earnings divided by the bond yield in the Fed’s valuation
model:
2) FVP = E/TBY
1
http://www.federalreserve.gov/boarddocs/speeches/1996/19961205.htm
2
“We have not been able, as yet, to provide a satisfying answer to this question, but there are reasons in the
current environment to keep this question on the table.”
http://www.federalreserve.gov/boarddocs/hh/1997/february/testimony.htm
3
http://www.federalreserve.gov/boarddocs/hh/1997/july/ReportSection2.htm

Prudential Securities Asset Valuation & Allocation Models / Ju
ly 30, 2002 / Page 3
The ratio of the actual S&P 500 price index to the fair value price shows the degree of
overvaluation or undervaluation. History shows that markets can stay overvalued and
become even more overvalued for a while. But eventually, overvaluation is corrected in
three ways: 1) falling interest rates, 2) higher earnings expectations, and of course, 3)
falling stock prices—the old fashioned way to decrease values. Undervaluation can be
corrected by rising yields, lower earnings expectations, or higher stock prices.
The Fed’s Stock Valuation Model worked quite well in the past. It identified when stock
prices were excessively overvalued or undervalued, and likely to fall or rise:
1) The market was extremely undervalued from 1979 through 1982, setting the stage
for a powerful rally that lasted through the summer of 1987.
2) Stock prices crashed after the market rose to a record 34% overvaluation peak during
September 1987.
3) Then the market was undervalued in the late 1980s, and stock prices rose.
4) In the early 1990s, it was moderately overvalued and stock values advanced at a
lackluster pace.
5) Stock prices were mostly undervalued during the mid-1990s, and a great bull market
started in late 1994.
6) Ironically, the market was actually fairly valued during December 1996 when the
Fed Chairman worried out loud about irrational exuberance.
E
xcerpt from Fed’s July 1997 Monetary Policy Report:
The run-up in stock prices in the spring was bolstered by unexpectedly strong
corporate profits for the first quarter. Still, the ratio of prices in the S&P 500 to
consensus estimates of earnings over the coming twelve months has risen
further from levels that were already unusually high. Changes in this ratio have
often been inversely related to changes in long-term Treasury yields, but this
year’s stock price gains were not matched by a significant net decline in interest
rates. As a result, the yield on ten-year Treasury notes now exceeds the ratio of
twelve-month-ahead earnings to prices by the largest amount since 1991, when
earnings were depressed by the economic slowdown. One important factor
behind the increase in stock prices this year appears to be a further rise in
analysts’ reported expectations of earnings growth over the next three to five
years. The average of these expectations has risen fairly steadily since early
1995 and currently stands at a level not seen since the steep recession of the
early 1980s, when earnings were expected to bounce back from levels that were
quite low.

Page 4 / Ju
ly 30, 2002 / Prudential Securities Asset Valuation & Allocation Models
7) During both the summers of 1997 and 1998, overvaluation conditions were corrected
by a sharp drop in prices.
8) Then a two- month undervaluation condition during September and October 1998
was quickly reversed as stock prices soared to a remarkable record 70%
overvaluation reading during January 2000. This bubble was led by the Nasdaq and
technology stocks, which crashed over the rest of the year, bringing the market closer
to fair value
II. New Improved Model
The FSVM is missing a variable reflecting that the forward earnings yield is riskier than
the government bond yield. How should we measure risk in the model? An obvious
choice is to use the spread between corporate bond yields and Treasury bond yields. This
spread measures the market’s assessment of the risk that some corporations might be
forced to default on their bonds. Of course, such events are very unusual, especially for
companies included in the S&P 500. However, the spread is only likely to widen during
periods of economic distress, when bond investors tend to worry that profits won’t be
sufficient to meet the debt-servicing obligations of some companies. Most companies
won’t have this problem, but their earnings would most likely be depressed during such
periods. The FSVM is also missing a variable for long-term earnings growth. My New
Improved Model includes these variables as follows:
3) FEY = CBY – b · · LTEG
where CBY is Moody’s A-rated corporate bond yield. LTEG is long-term expected
earnings growth, which is measured using consensus five- year earnings growth
projections. I/B/E/S International compiles these monthly. The “b” coefficient is the
weight that the market gives to long-term earnings projections. It can be derived as -
[FEY-CBY]/LTEG. Since the start of the data in 1985, this “earnings growth coefficient”
averaged 0.1.
Equation 3 can be rearranged to produce the following:
4) FVP = E ¸ ¸ [CBY – b · · LTEG]
FVP is the fair value price of the S&P 500 index. Exhibit 10 shows three fair value price
series using the actual data for E, CBY, and LTEG with b = 0.1, b = 0.2, and b = 0.25.
The market was fairly valued during 1999 and the first half of 2000 based on the
consensus forecast that earnings could grow more than 16% per year over the next five
years and that this variable should be weighted by 0.25, or two and a half times more than
the average historical weight.
III. Back To Basics
With the benefit of hindsight, it seems that these assumptions were too optimistic. But,

Prudential Securities Asset Valuation & Allocation Models / Ju
ly 30, 2002 / Page 5
this is exactly the added value of the New Improved FSVM. It can be used to make
explicit the implicit assumptions in the stock market about the weight given to long-term
earnings growth. The simple version has worked so well historically because the long-
term growth component has been offset on average by the risk variable in the corporate
bond market.
IV. Stocks Versus Bonds
The FSVM is a very simple stock valuation model. It should be used along with other
stock valuation tools, including the New Improved version of the model. Of course, there
are numerous other more sophisticated and complex models. The Fed model is not a
market-timing tool. As noted above, an overvalued (undervalued) market can become
even more overvalued (undervalued). However, the Fed model does have a good track
record of showing whether stocks are cheap or expensive. Investors are likely to earn
below (above) average returns over the next 12-24 months when the market is overvalued
(undervalued).
The next logical step is to convert the FSVM into a simple asset allocation model
(Exhibit 1). I’ve done so by subjectively associating the “right” stock/bond asset mixes
with the degree of over/under valuation as shown in the table below. For example,
whenever stocks are 10% to 20% overvalued, I would recommend that a moderately
aggressive investor should have a mix of 60% in stocks and 40% in bonds in their
portfolio.
Bonds/Stocks Asset Allocation Model
More than 30% overvalued
70% bonds, 30% stocks
20% to 30% overvalued
50% bonds, 50% stocks
10% to 20% overvalued
40% bonds, 60% stocks
10% undervalued to 10% overvalued
30% bonds, 70% stocks
10% to 15% undervalued
20% bonds, 80% stocks
More than 15% undervalued
10% bonds, 90% stocks
79 80 81 82 83 84 85 86 87 88 89 90 91 92 93 94 95 96 97 98 99 00 01 02 03 04 05 06 07 08
-40
-30
-20
-10
0
10
20
30
40
50
60
70
80
-40
-30
-20
-10
0
10
20
30
40
50
60
70
80
7/26
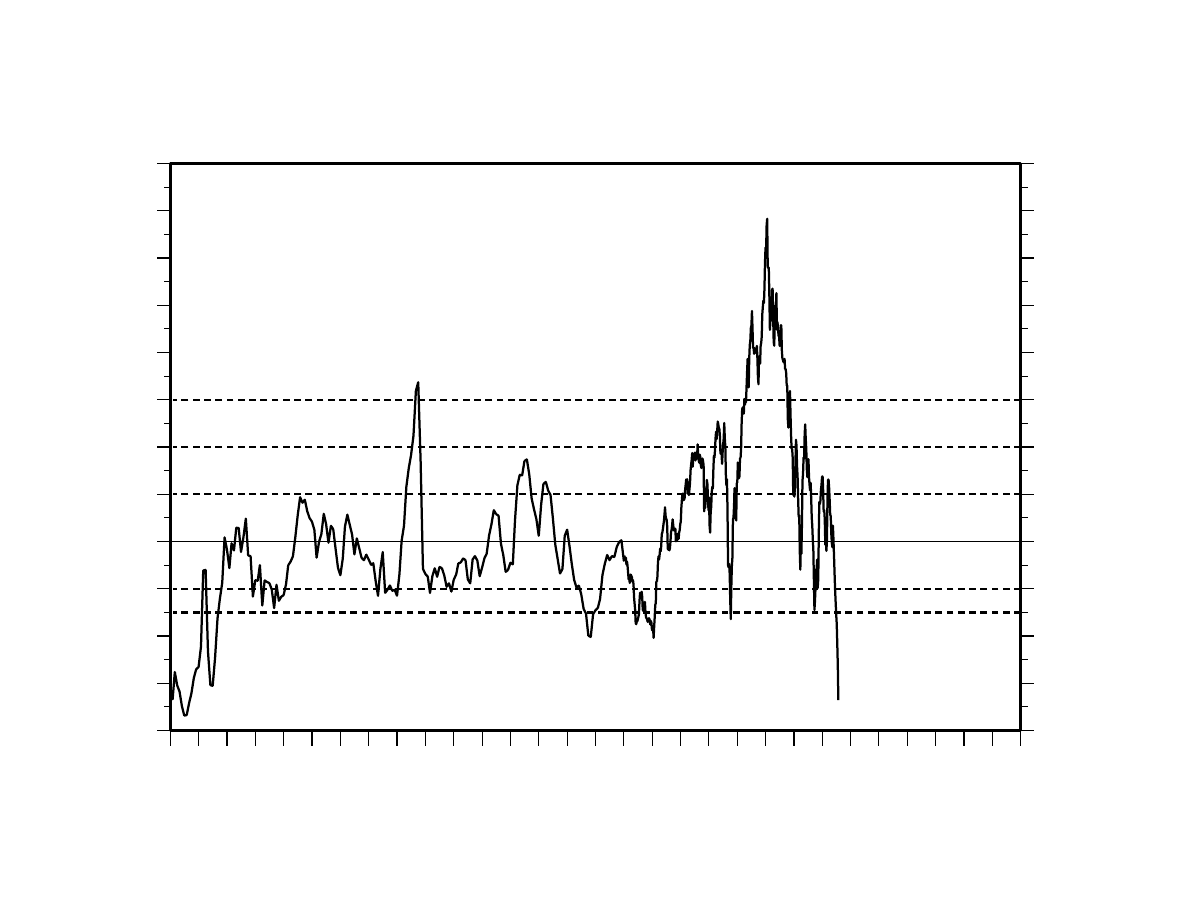
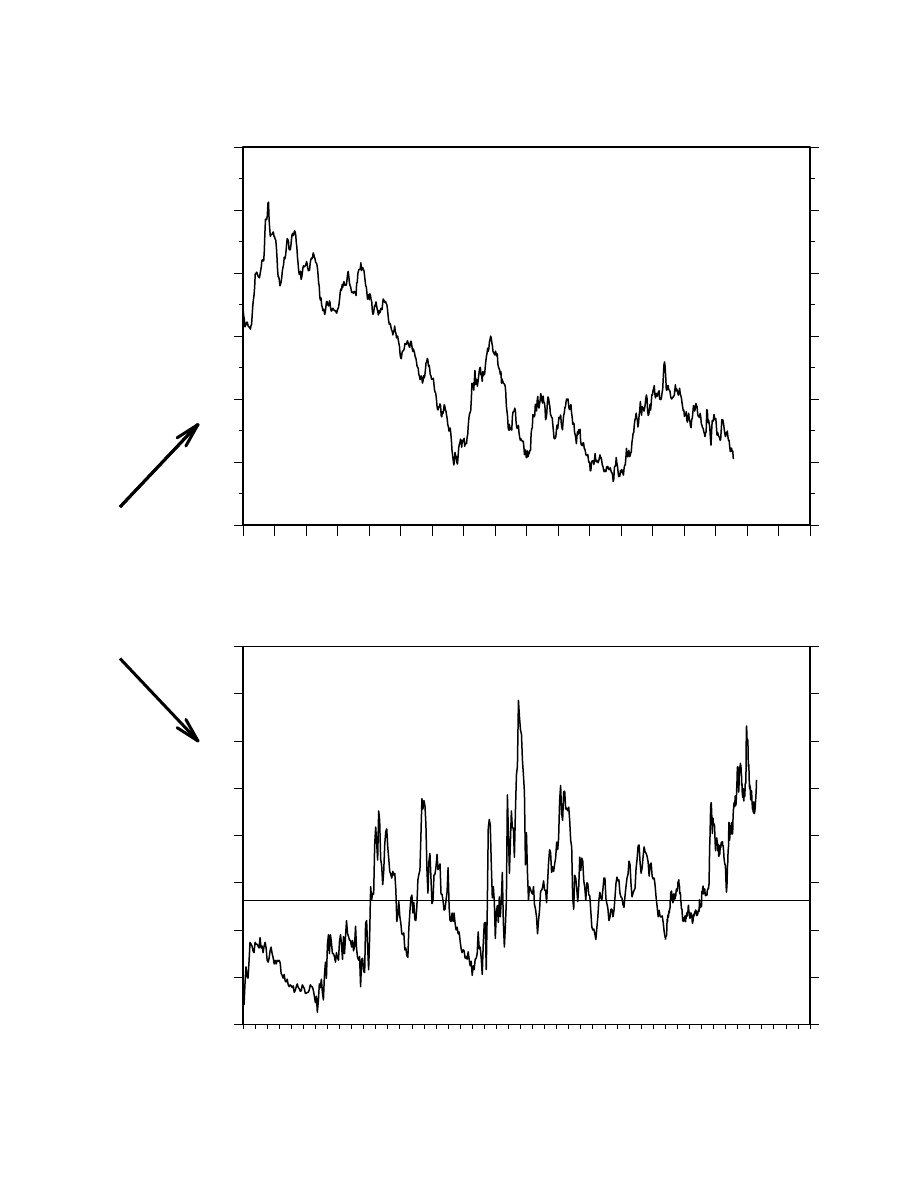
ED YARDENI’S ASSET ALLOCATION MODEL: BONDS/STOCKS*
(for Moderately Aggressive Investor)
Stocks overvalued when greater than zero
Stocks undervalued when less than zero
70/30
50/50
40/60
30/70
30/70
20/80
10/90
* Ratio of S&P 500 index to its fair value (12-month forward consensus expected operating earnings per share
divided by the ten-year U.S. Treasury bond yield) minus 100. Monthly through March 1994, weekly after.
Source: Thomson Financial.
Yardeni
- Asset Allocation -
Page 6 /
July 30, 2002
/ Prudential Securities
Asset Valuation & Allocation Models
79 80 81 82 83 84 85 86 87 88 89 90 91 92 93 94 95 96 97 98 99 00 01 02 03 04
75
225
375
525
675
825
975
1125
1275
1425
1575
1725
75
225
375
525
675
825
975
1125
1275
1425
1575
1725
7/26
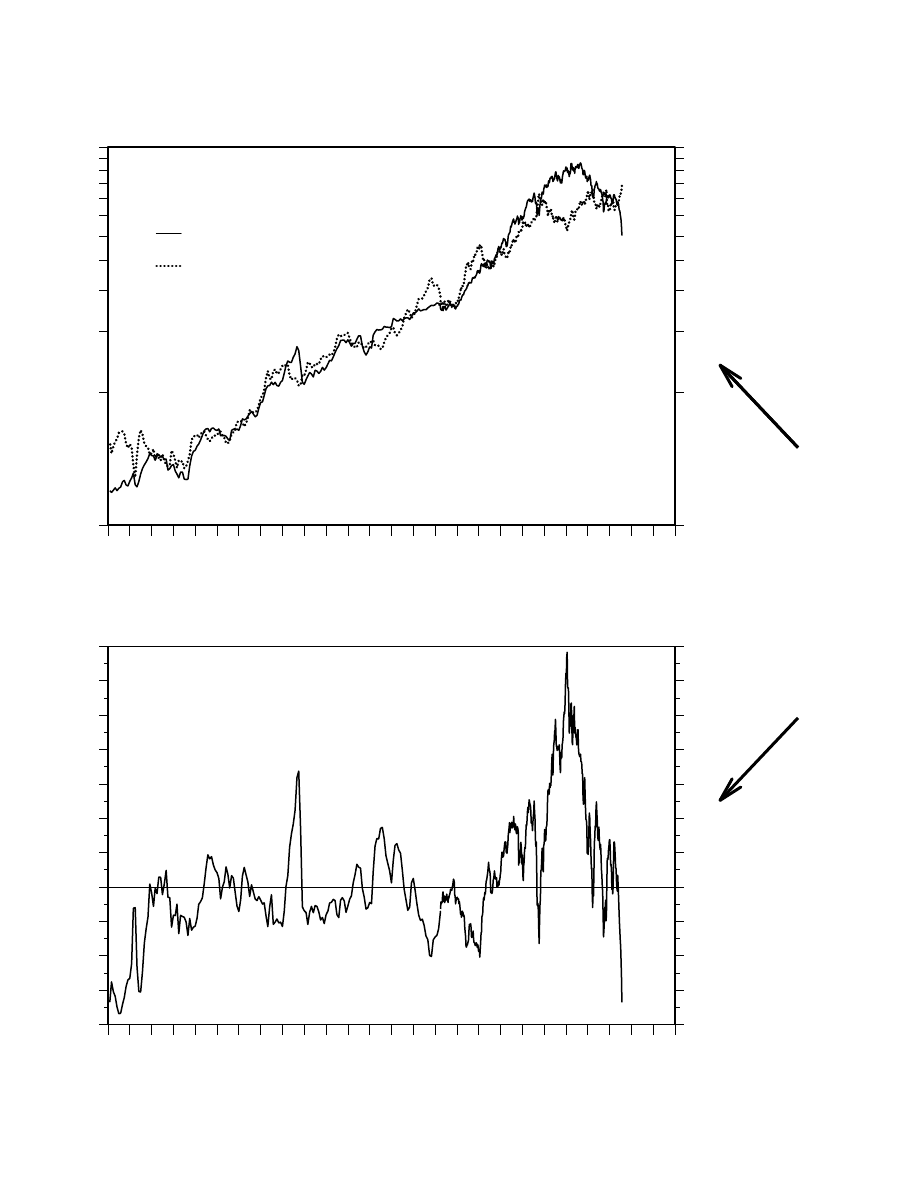
FED’S STOCK VALUATION MODEL (FSVM-1)
(ratio scale)
Fair-Value Price*
S&P 500 Price Index
* 52-week forward consensus expected S&P 500 operating earnings per share divided by 10-year US Treasury
bond yield. Monthly through March 1994, weekly after.
Source: Thomson Financial.
Yardeni
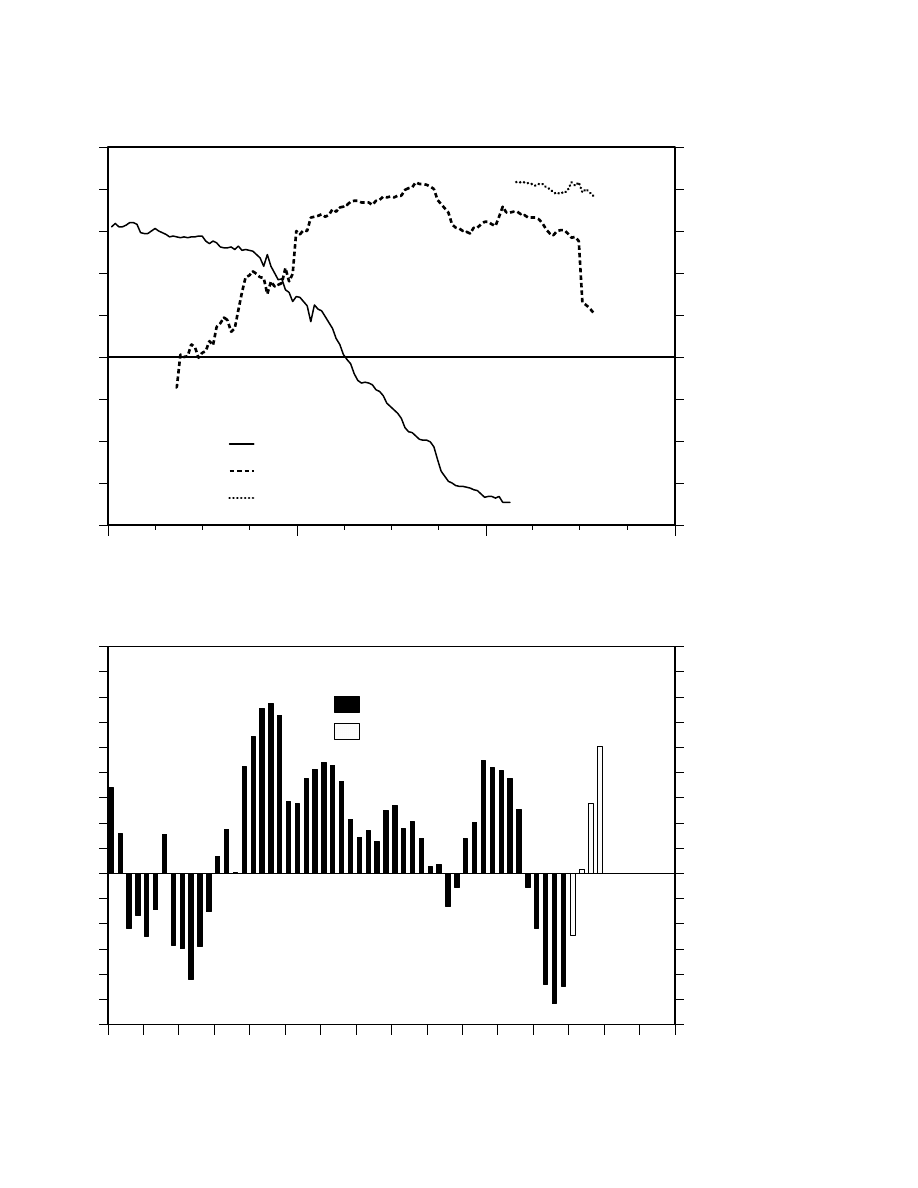
Figure 2.
According to the Fed
model, when stock
prices are overpriced,
returns from stocks
are likely to be subpar
over the next 12-24
months.
Better-than-average
returns tend to come
from underpriced
markets.
79 80 81 82 83 84 85 86 87 88 89 90 91 92 93 94 95 96 97 98 99 00 01 02 03 04
-40
-30
-20
-10
0
10
20
30
40
50
60
70
-40
-30
-20
-10
0
10
20
30
40
50
60
70
7/26
FED’S STOCK VALUATION MODEL (FSVM-1)*
(percent)
Overvalued
Undervalued
* Ratio of S&P 500 Index to its Fair-Value (52-week forward consensus expected S&P 500 operating earnings
per share divided by the 10-year US Treasury bond yield) minus 100. Monthly through April 1994, weekly
thereafter.
Source: Thomson Financial.
Yardeni
Figure 3.
Figure 3.
- Valuation Model -
Prudential Securities Asset Valuation & Allocation Models / July 30, 2002 / Page 7
79 80 81 82 83 84 85 86 87 88 89 90 91 92 93 94 95 96 97 98 99 00 01 02 03 04
2
3
4
5
6
7
8
9
10
11
12
13
14
15
16
17
18
2
3
4
5
6
7
8
9
10
11
12
13
14
15
16
17
18
7/26
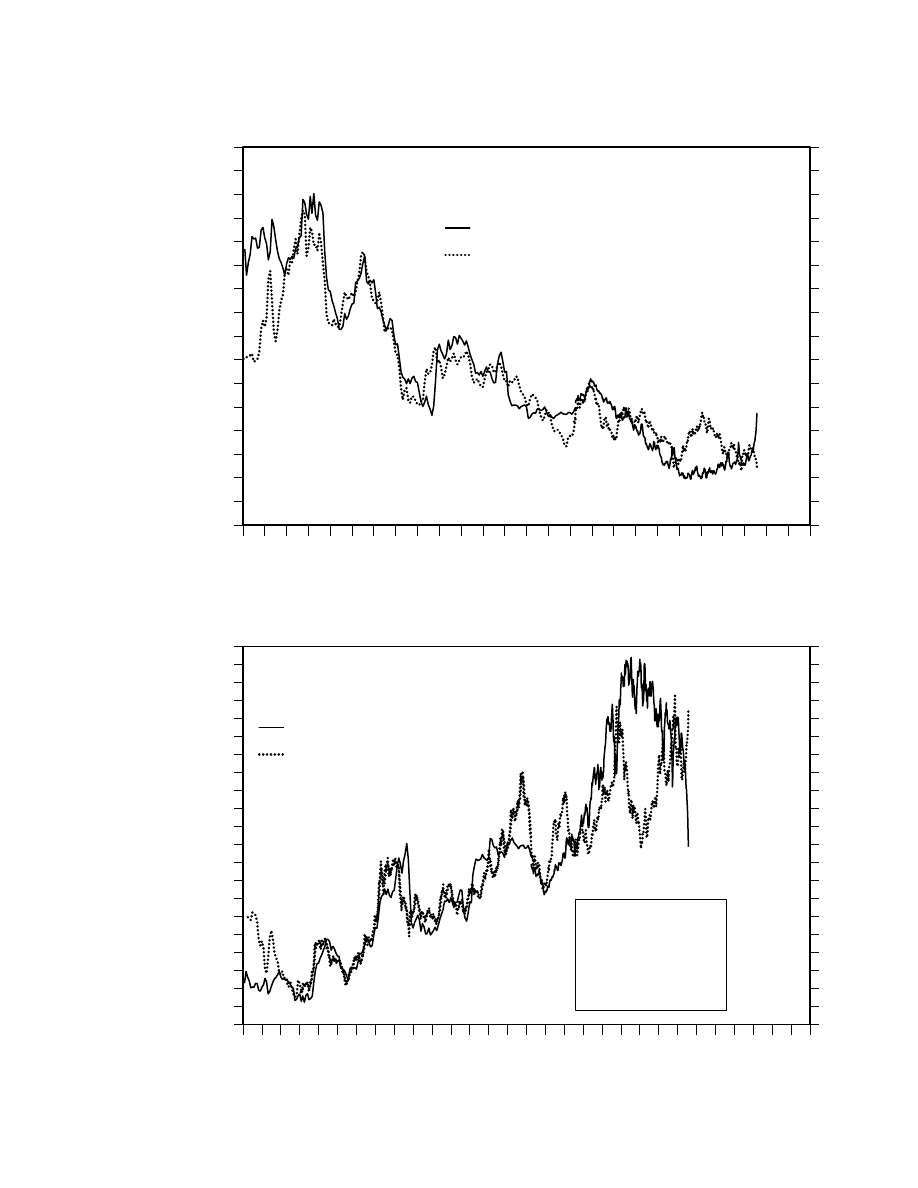
S&P 500 EARNINGS YIELD & BOND YIELD
10-Year US Treasury
Bond Yield
Forward Earnings Yield*
* 52-week forward consensus expected S&P 500 operating earnings per share divided by S&P 500 Index.
Monthly through March 1994, weekly after.
Source: Thomson Financial.
Yardeni
Figure 4.
This chart appeared in
the Fed’s July 1997
Monetary Policy
Report to the
Congress. It shows a
very close correlation
between the earnings
yield of the stock
market and the bond
yield. Another, more
familiar way to look at
it follows.
79 80 81 82 83 84 85 86 87 88 89 90 91 92 93 94 95 96 97 98 99 00 01 02 03 04 05 06 07 08
5
6
7
8
9
10
11
12
13
14
15
16
17
18
19
20
21
22
23
24
25
26
5
6
7
8
9
10
11
12
13
14
15
16
17
18
19
20
21
22
23
24
25
26
Actual Fair
Jun 14 18.1 20.1
Jun 21 18.1 20.7
Jun 28 17.5 20.7
Jul 5 17.1 20.7
Jul 12 16.6 21.2
Jul 19 15.8 21.4
Jul 26 14.9 22.4
7/26
FORWARD P/E & BOND YIELD
Fair-Value P/E=Reciprocal Of
Ten-Year U.S. Treasury Bond Yield
Ratio Of S&P 500 Price To Expected Earnings*
* 52-week forward consensus expected S&P 500 operating earnings per share. Monthly through March 1994,
weekly after.
Source: Thomson Financial.
Yardeni
Figure 5.
The S&P 500 P/E
(using expected
earnings) is highly
correlated with
reciprocal of the bond
yield.
- Valuation Model -
Page 8 / July 30, 2002
/ Prudential Securities Asset Valuation & Allocation Models
I
II
III
IV
I
II
III
IV
I
II
III
IV
2000
2001
2002
40
45
50
55
60
65
70
75
40
45
50
55
60
65
70
75
7/26
S&P 500 EARNINGS PER SHARE CONSENSUS FORECASTS
(analysts’ average forecasts)
For 2003
For 2002
For 2001
Forward
Earnings*
* 52-week forward consensus expected S&P 500 operating earnings per share. Time-weighted average of
current year and next year’s consensus forecasts.
Source: Thomson Financial.
Yardeni
Figure 6.
Expected forward
earnings is a
time-weighted
average of current and
the coming years’
consensus forecasts.
1985 1986 1987 1988 1989 1990 1991 1992 1993 1994 1995 1996 1997 1998 1999 2000 2001 2002 2003 2004
10
15
20
25
30
35
40
45
50
55
60
65
10
15
20
25
30
35
40
45
50
55
60
65
Q1
7/25
S&P 500 EARNINGS PER SHARE: ACTUAL & EXPECTED
S&P 500 Earnings Per Share
________________________
Operating Earnings
(4-quarter sum)
Forward Earnings*
(pushed 52-weeks ahead)
* 52-week forward consensus expected S&P 500 operating earnings per share. Monthly through March 1994,
weekly after.
Source: Thomson Financial.
Yardeni
Figure 7.
Bottom-up 52-week
forward expected
earnings tends to be a
good predicator of
actual earnings, with a
few significant misses.
- Earnings -
Prudential Securities Asset Valuation & Allocation Models / July 30, 2002 / Page 9
1990
1991
1992
1993
1994
1995
1996
1997
1998
1999
2000
2001
2002
2003
20
25
30
35
40
45
50
55
60
65
70
75
20
25
30
35
40
45
50
55
60
65
70
75
Jul
S&P 500 CONSENSUS OPERATING EARNINGS PER SHARE
(analysts’ bottom-up forecasts)
Consensus Forecasts
__________________
Annual estimates
12-month forward
Actual 4Q sum
91
92
93
94
95
96
97
98
99
00
01
02
03
Source: Thomson Financial.
Yardeni
Figure 8.
Analysts always start
out too optimistic
about the prospects
for earnings.
1978
1979
1980
1981
1982
1983
1984
1985
1986
1987
1988
1989
1990
1991
10
15
20
25
30
35
10
15
20
25
30
35
S&P 500 CONSENSUS OPERATING EARNINGS PER SHARE
(analysts’ bottom-up forecasts, ratio scale)
Consensus Forecasts
_________________
Annual estimates
12-month forward
Actual 4Q sum
80
81
82
83
84
85
86
87
88
89
90
Source: Thomson Financial.
Yardeni
Figure 9.
Figure 9.
- Earnings -
Page 10 / July 30, 2002
/ Prudential Securities Asset Valuation & Allocation Models
I
II
III
IV
I
II
III
IV
I
II
III
IV
2000
2001
2002
-20
-15
-10
-5
0
5
10
15
20
25
-20
-15
-10
-5
0
5
10
15
20
25
7/26
7/26
S&P 500 EARNINGS PER SHARE
Consensus Growth
Forecasts*
_______________
2001/2000
2002/2001
2003/2002
* Based on consensus expected S&P 500 operating earnings per share for years shown.
Source: Thomson Financial.
Yardeni
Figure 10.
The data on
consensus expected
earnings can be used
to derive consensus
earnings growth
forecasts.
1989 1990 1991 1992 1993 1994 1995 1996 1997 1998 1999 2000 2001 2002 2003 2004
-30
-25
-20
-15
-10
-5
0
5
10
15
20
25
30
35
40
45
-30
-25
-20
-15
-10
-5
0
5
10
15
20
25
30
35
40
45
Q4
S&P 500 OPERATING EARNINGS PER SHARE*
(yearly percent change)
Consensus Forecast
(Proforma)*
Actual
* S&P 500 composition is constantly changing. Actual data are not adjusted for these changes. Proforma
forecasts are same-company comparisions. Source: Thomson Financial.
Yardeni
Figure 11.
Earnings growth is
highly cyclical.
- Earnings -
Prudential Securities Asset Valuation & Allocation Models / July 30, 2002 / Page 11
1987 1988 1989 1990 1991 1992 1993 1994 1995 1996 1997 1998 1999 2000 2001 2002 2003 2004
0
200
400
600
800
1000
1200
1400
1600
1800
2000
0
200
400
600
800
1000
1200
1400
1600
1800
2000
7/26
FED’S STOCK VALUATION MODEL (FSVM-2)
5-year earnings
growth weight
_____________
.25
.20
.10
.25
.20
.10
Actual S&P 500
Fair Value S&P 500*
* Fair Value is 12-month forward consensus expected S&P 500 operating earnings per share divided by
difference between Moody’s A-rated corporate bond yield less fraction (as shown above) of 5-year
consensus expected earnings growth.
Source: Thomson Financial
Yardeni
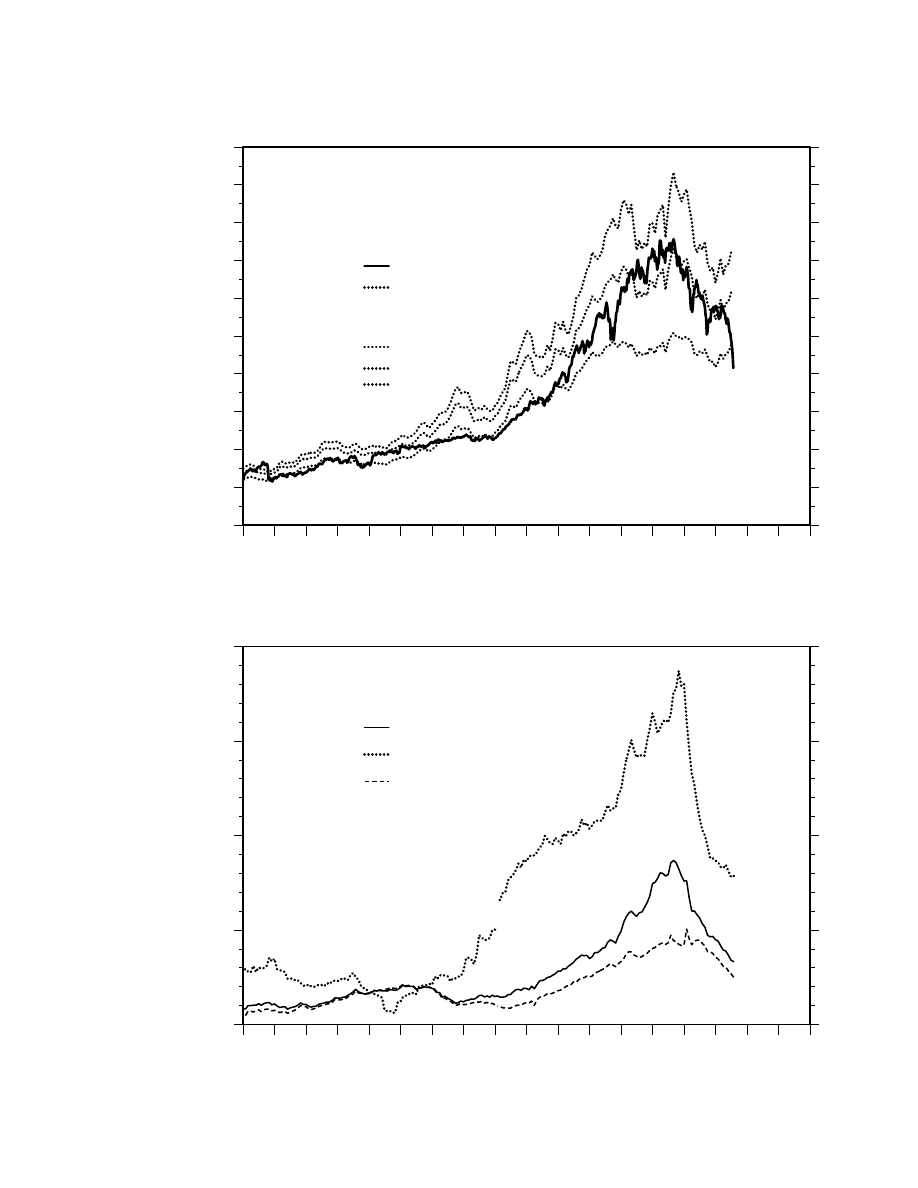
Figure 12.
This second version of
the Fed’s Stock
Valuation Model builds
on the simple one by
adding variables for
long-term expected
earnings growth and
risk.
1987 1988 1989 1990 1991 1992 1993 1994 1995 1996 1997 1998 1999 2000 2001 2002 2003 2004
10
15
20
25
30
10
15
20
25
30
Jul
LONG-TERM CONSENSUS EARNINGS GROWTH*
(annual rate, percent)
S&P 500
S&P 500 Information Technology
Ex Information Technology
* 5-year forward consensus expected S&P 500 earnings growth. Data from 1995 based on new Global Industry
Classification Standard.
Source: Thomson Financial.
Yardeni
Figure 13.
Long-term earnings
growth expectations
rose sharply during
1990s. They fell
sharply from
2000-2002.
- New Improved Model -
Page 12 / July 30, 2002
/ Prudential Securities Asset Valuation & Allocation Models
1987 1988 1989 1990 1991 1992 1993 1994 1995 1996 1997 1998 1999 2000 2001 2002 2003 2004
-5
0
5
10
15
20
25
30
35
40
-5
0
5
10
15
20
25
30
35
40
Jun
MARKET’S WEIGHT FOR 5-YEAR CONSENSUS EXPECTED EARNINGS GROWTH*
(percent)
Average = 13%
Weight market gives to long-term earnings growth
________________________________________
value > 13% = more than average weight
value < 13% = less than average weight
* Moody’s A-rated corporate bond yield less earnings yield divided by 5-year consensus expected earnings
growth.
* Source: Standard and Poor’s Corporation, Thomson Financial and Moody’s Investors Service.
Yardeni
Figure 14.
Investors have on
average over time
subtracted 13% of
their long-term
earnings growth
expectations from the
corporate bond yield
to determine earnings
yield.
1986 1987 1988 1989 1990 1991 1992 1993 1994 1995 1996 1997 1998 1999 2000 2001 2002 2003 2004
.8
.9
1.0
1.1
1.2
1.3
1.4
1.5
1.6
.8
.9
1.0
1.1
1.2
1.3
1.4
1.5
1.6
Jun
S&P 500 PEG RATIO
P/E ratio for S&P 500
divided by 5-year consensus
expected earnings growth*
Average = 1.2
* P/E using 12-month forward consensus S&P 500 expected earnings and prices at mid-month.
Source: Thomson Financial.
Yardeni
Figure 15.
Historically, S&P 500
sold at P/E of 1.2 times
long-term expected
earnings growth, on
average, with quite a
bit of volatility.
- New Improved Model -
Prudential Securities Asset Valuation & Allocation Models / July 30, 2002 / Page 13
1987 1988 1989 1990 1991 1992 1993 1994 1995 1996 1997 1998 1999 2000 2001 2002 2003 2004
6
7
8
9
10
11
12
6
7
8
9
10
11
12
7/26
CORPORATE BOND YIELD
(percent)
A-Rated
Source: Moody’s Investors Service.
Yardeni
Figure 16.
Corporate bond yield
variable in FSVM-2
captures risk that
earnings will be
weaker than expected.
60 62 64 66 68 70 72 74 76 78 80 82 84 86 88 90 92 94 96 98 00 02 04 06
0
50
100
150
200
250
300
350
400
0
50
100
150
200
250
300
350
400
7/26
CORPORATE SPREAD*
(basis points)
Moody’s A-Rated Corporate Bond Yield
Minus 10-Year US Treasury Bond Yield
Average = 131
* Monthly through 1994, weekly thereafter.
Source: Board of Governors of the Federal Reserve System and Moody’s Investor Service.
Yardeni
Figure 17.
Figure 17.
- New Improved Model -
Page 14 / July 30, 2002
/ Prudential Securities Asset Valuation & Allocation Models
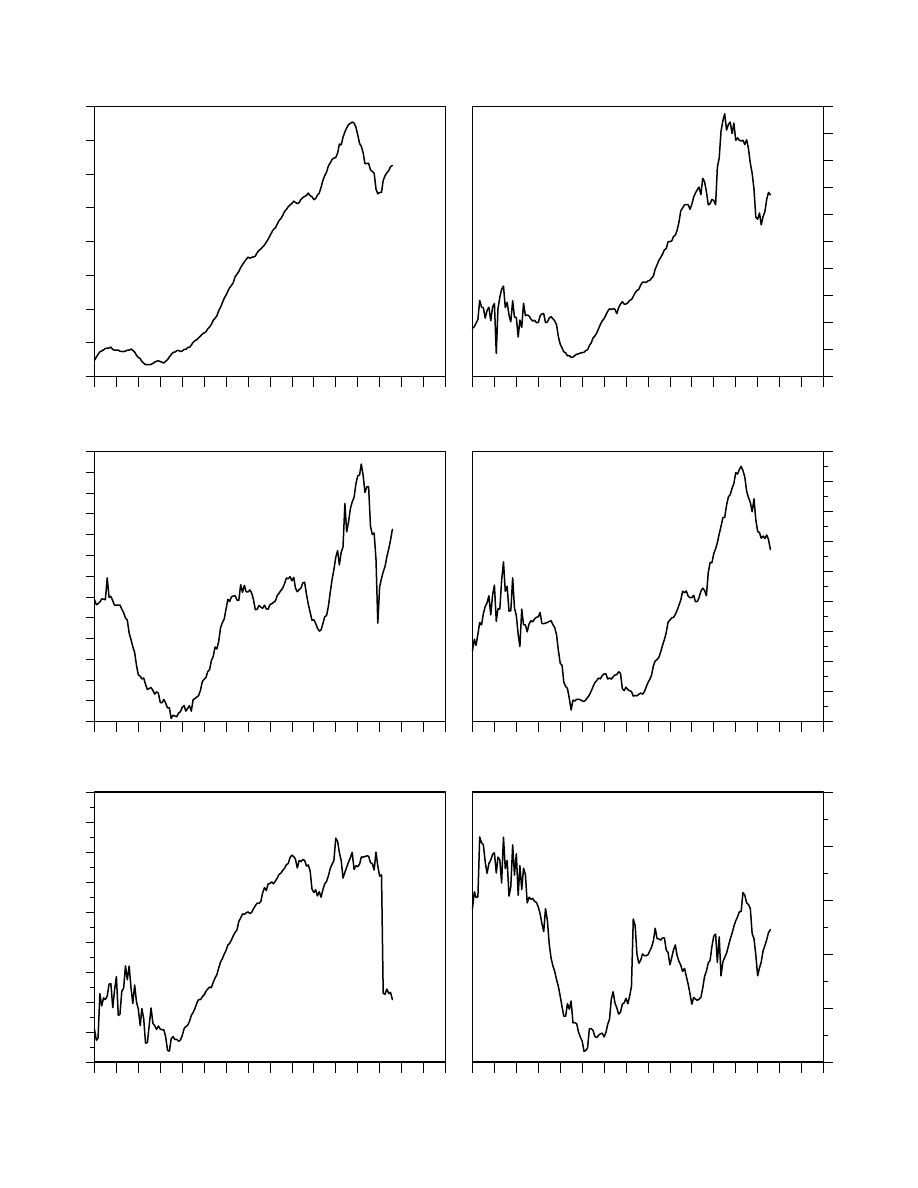
Figure 18.
89 90 91 92 93 94 95 96 97 98 99 00 01 02 03 04
25
30
35
40
45
50
55
60
65
Jul
UNITED STATES (S&P 500)
Expected EPS*
(dollars)
89 90 91 92 93 94 95 96 97 98 99 00 01 02 03 04
75
100
125
150
175
200
225
250
275
300
325
Jul
GERMANY (DAX)
Expected EPS
(euros)
89 90 91 92 93 94 95 96 97 98 99 00 01 02 03 04
225
250
275
300
325
350
375
400
425
450
475
500
525
550
Jul
CANADA (TSE 300)
Expected EPS
(Canadian dollars)
89 90 91 92 93 94 95 96 97 98 99 00 01 02 03 04
100
120
140
160
180
200
220
240
260
280
Jul
FRANCE (CAC 40)
Expected EPS
(euros)
89 90 91 92 93 94 95 96 97 98 99 00 01 02 03 04
180
200
220
240
260
280
300
320
340
360
Jul
UNITED KINGDOM (FT 100)
Expected EPS
(pounds)
* 12-month forward consensus expected operating earnings per share. Source: Thomson Financial.
89 90 91 92 93 94 95 96 97 98 99 00 01 02 03 04
20
30
40
50
60
70
Jul
JAPAN (TOPIX)
Expected EPS
(yen)
Yardeni
- Global: Expected Earnings* -
Prudential Securities Asset Valuation & Allocation Models / July 30, 2002 / Page 15
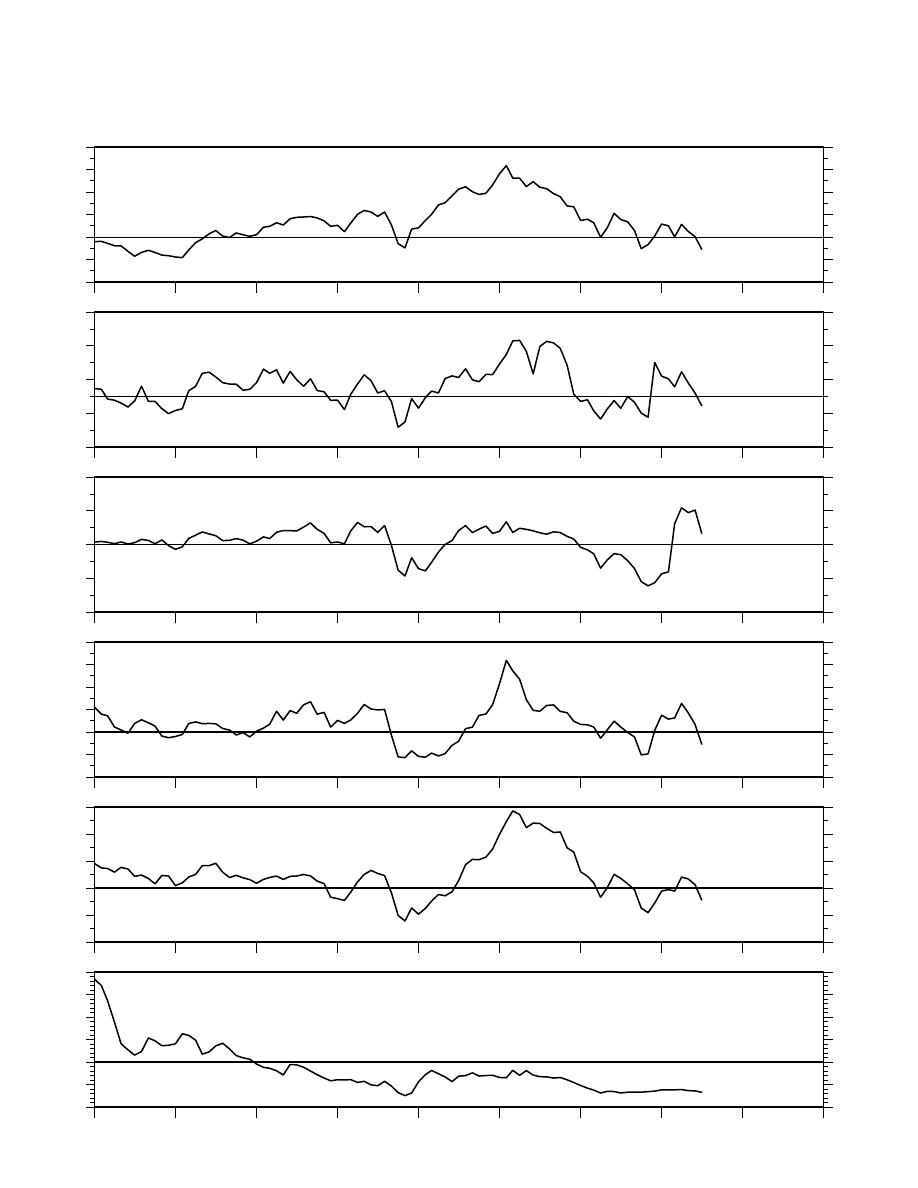
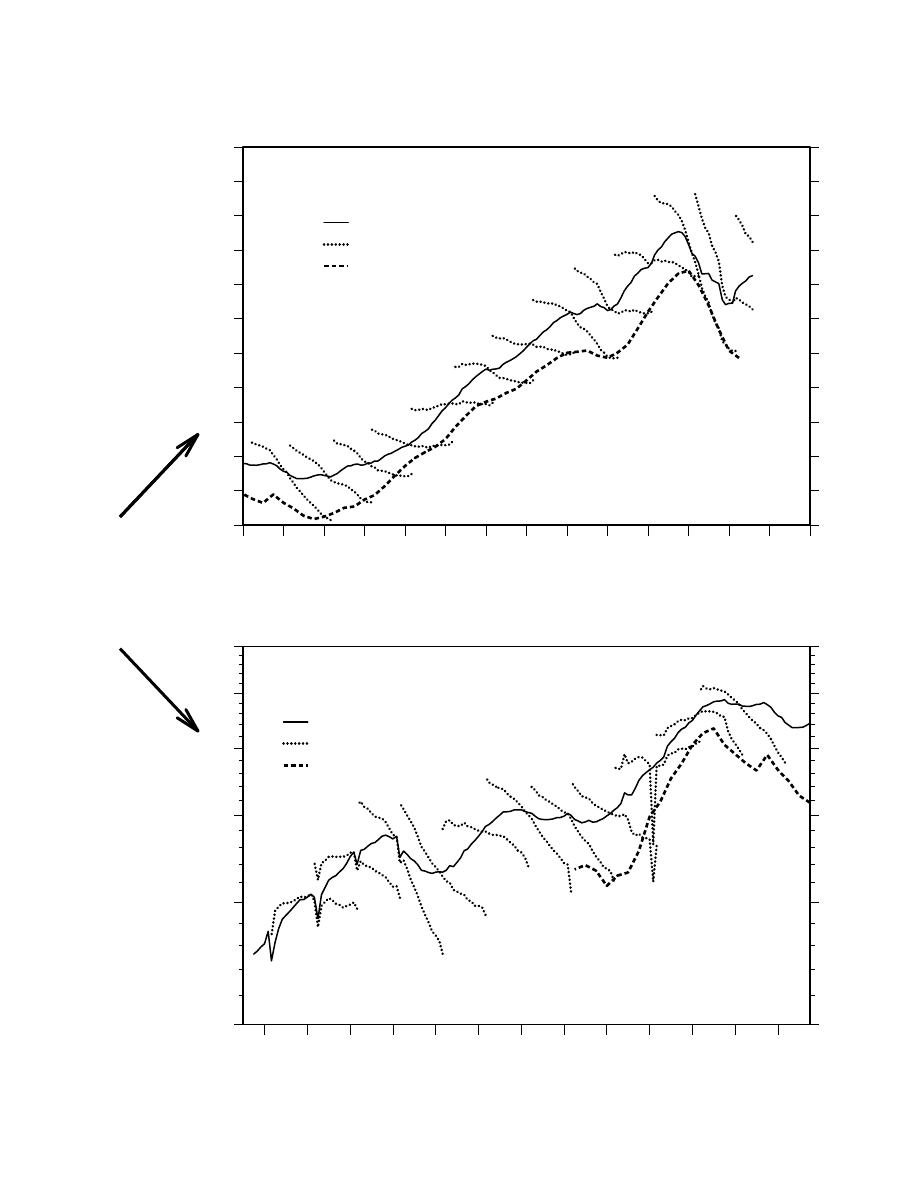
Figure 19.
1995
1996
1997
1998
1999
2000
2001
2002
2003
-40
-20
0
20
40
60
80
-40
-20
0
20
40
60
80
Jun
UNITED STATES
Overvalued
Undervalued
1995
1996
1997
1998
1999
2000
2001
2002
2003
-30
-10
10
30
50
-30
-10
10
30
50
Jun
CANADA
Overvalued
Undervalued
1995
1996
1997
1998
1999
2000
2001
2002
2003
-40
-20
0
20
40
-40
-20
0
20
40
Jun
UNITED KINGDOM
Overvalued
Undervalued
1995
1996
1997
1998
1999
2000
2001
2002
2003
-40
-20
0
20
40
60
80
-40
-20
0
20
40
60
80
Jun
GERMANY
Overvalued
Undervalued
1995
1996
1997
1998
1999
2000
2001
2002
2003
-40
-20
0
20
40
60
-40
-20
0
20
40
60
Jun
FRANCE
Overvalued
Undervalued
1995
1996
1997
1998
1999
2000
2001
2002
2003
-100
-50
0
50
100
150
200
-100
-50
0
50
100
150
200
Jun
JAPAN
Overvalued
Undervalued
Yardeni
Source: Thomson Financial.
- Global: Stock Valuation -
Page 16 / July 30, 2002
/ Prudential Securities Asset Valuation & Allocation Models
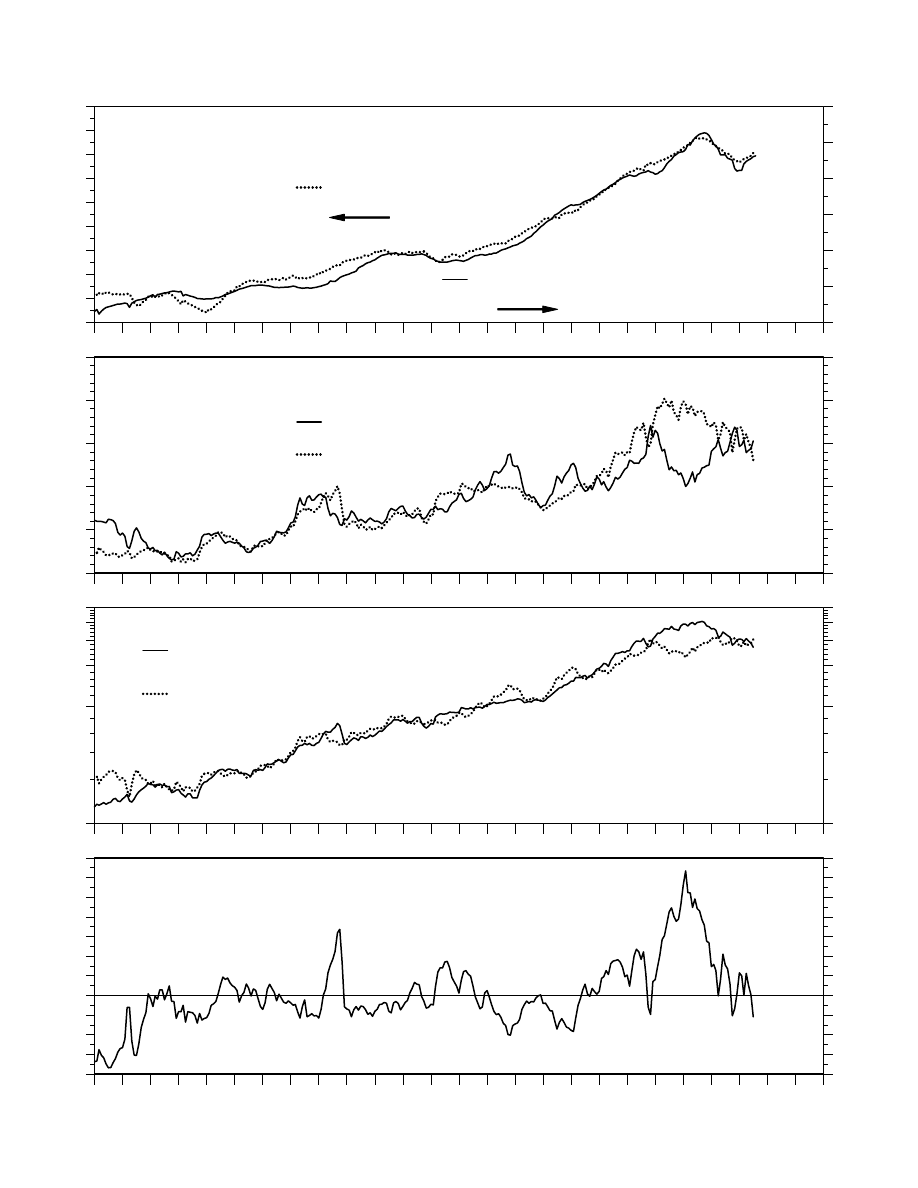
Figure 20.
79
80
81
82
83
84
85
86
87
88
89
90
91
92
93
94
95
96
97
98
99
00
01
02
03
04
10
20
30
40
50
60
70
70
80
90
100
110
120
130
140
150
160
Jul
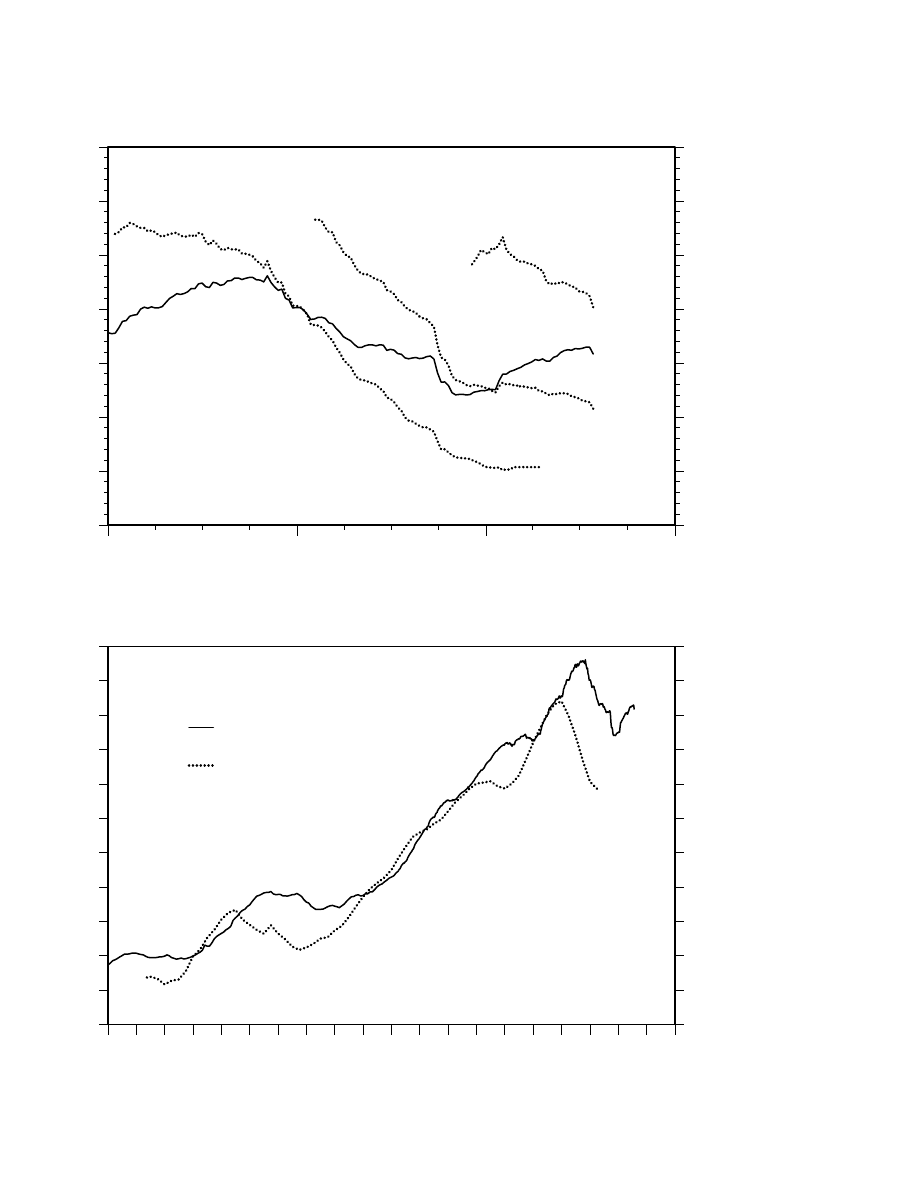
STOCK VALUATION MODEL
Industrial Production
(1987=100)
Expected Earnings Per Share*
For S&P 500 (dollars)
79
80
81
82
83
84
85
86
87
88
89
90
91
92
93
94
95
96
97
98
99
00
01
02
03
04
5
10
15
20
25
30
5
10
15
20
25
30
Jun
Fair-Value P/E
Forward P/E
79
80
81
82
83
84
85
86
87
88
89
90
91
92
93
94
95
96
97
98
99
00
01
02
03
04
75
425
775
1125
1475
1825
75
425
775
1125
1475
1825
Jun
Fair-Value Price
(ratio scale)
Stock Price Index (S&P 500)
(ratio scale)
79
80
81
82
83
84
85
86
87
88
89
90
91
92
93
94
95
96
97
98
99
00
01
02
03
04
-40
-30
-20
-10
0
10
20
30
40
50
60
70
-40
-30
-20
-10
0
10
20
30
40
50
60
70
Jun
Overvalued
Undervalued
Source: Thomson Financial.
Yardeni
- Global: United States (S&P 500) -
Prudential Securities Asset Valuation & Allocation Models / July 30, 2002 / Page 17
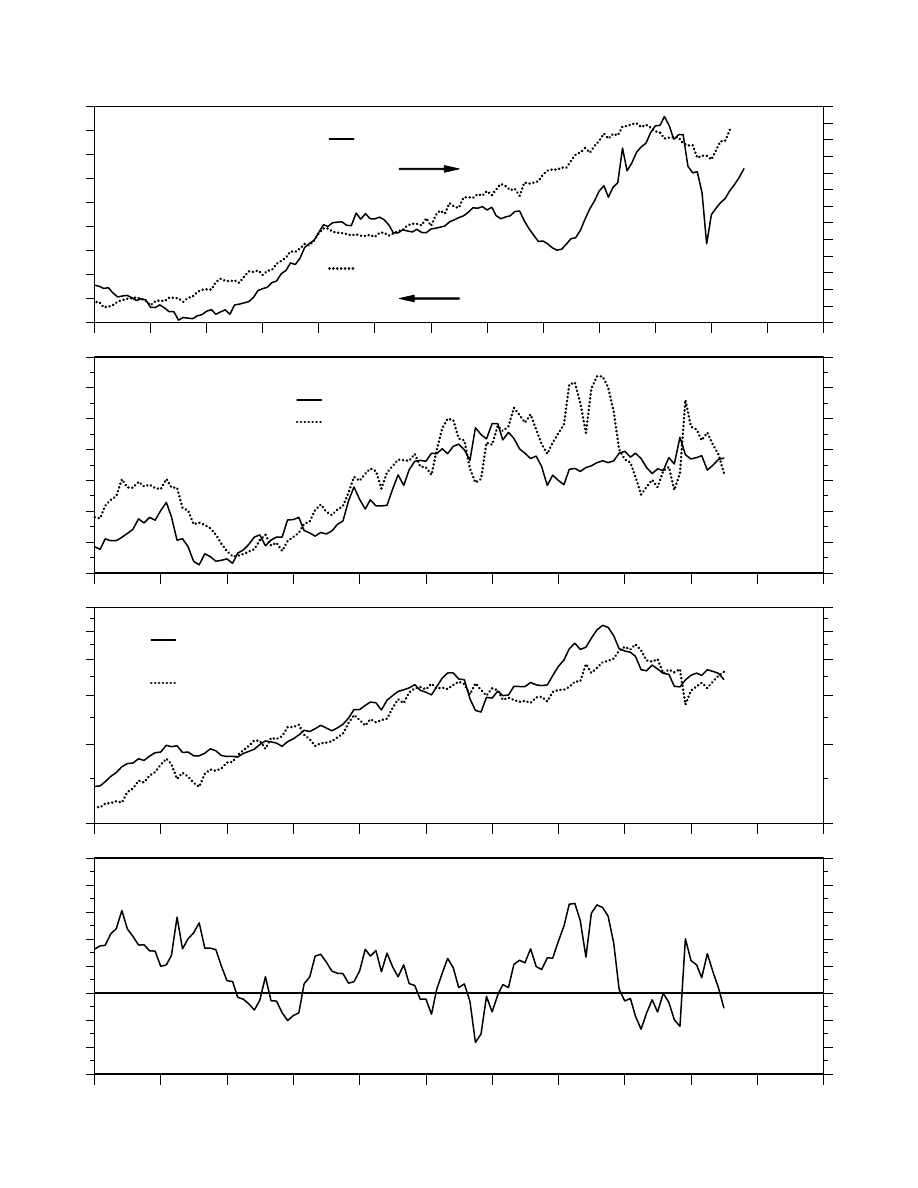
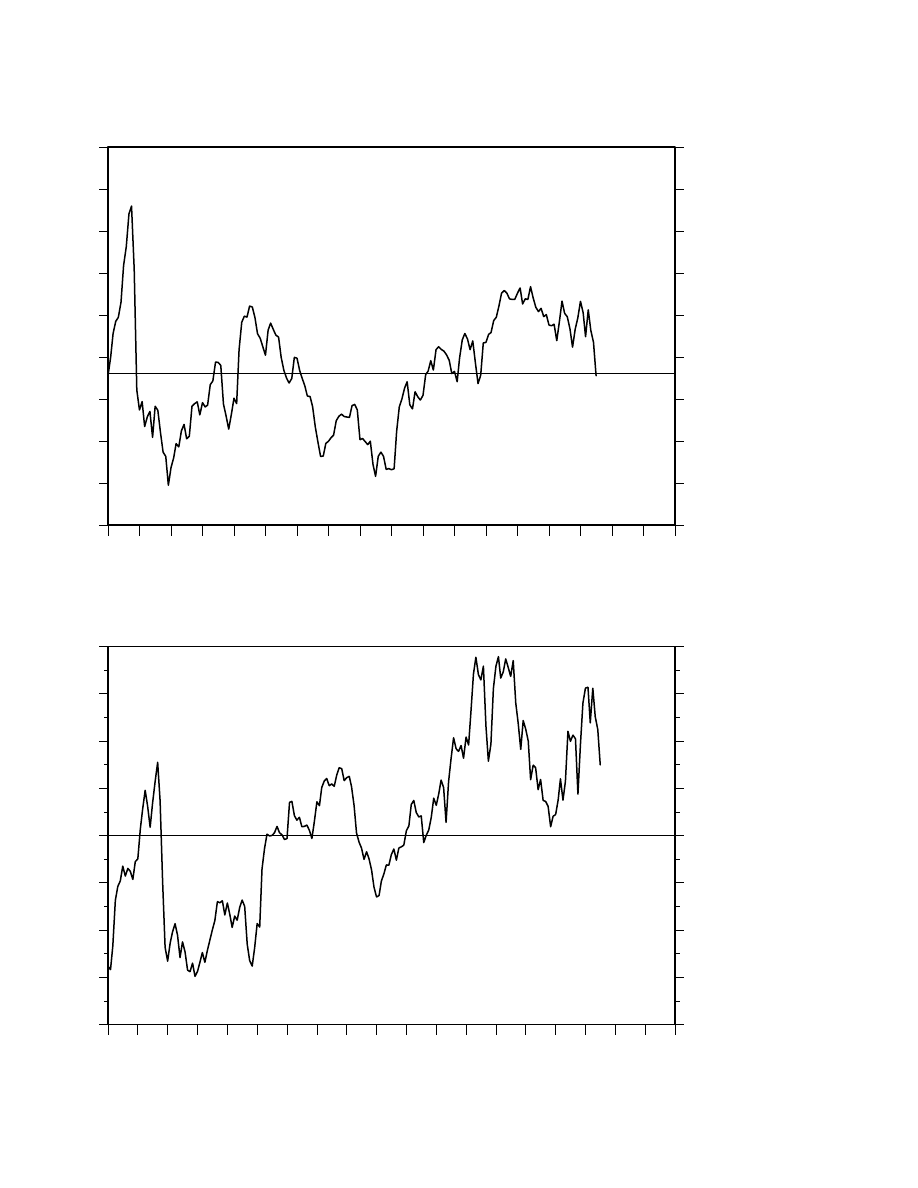
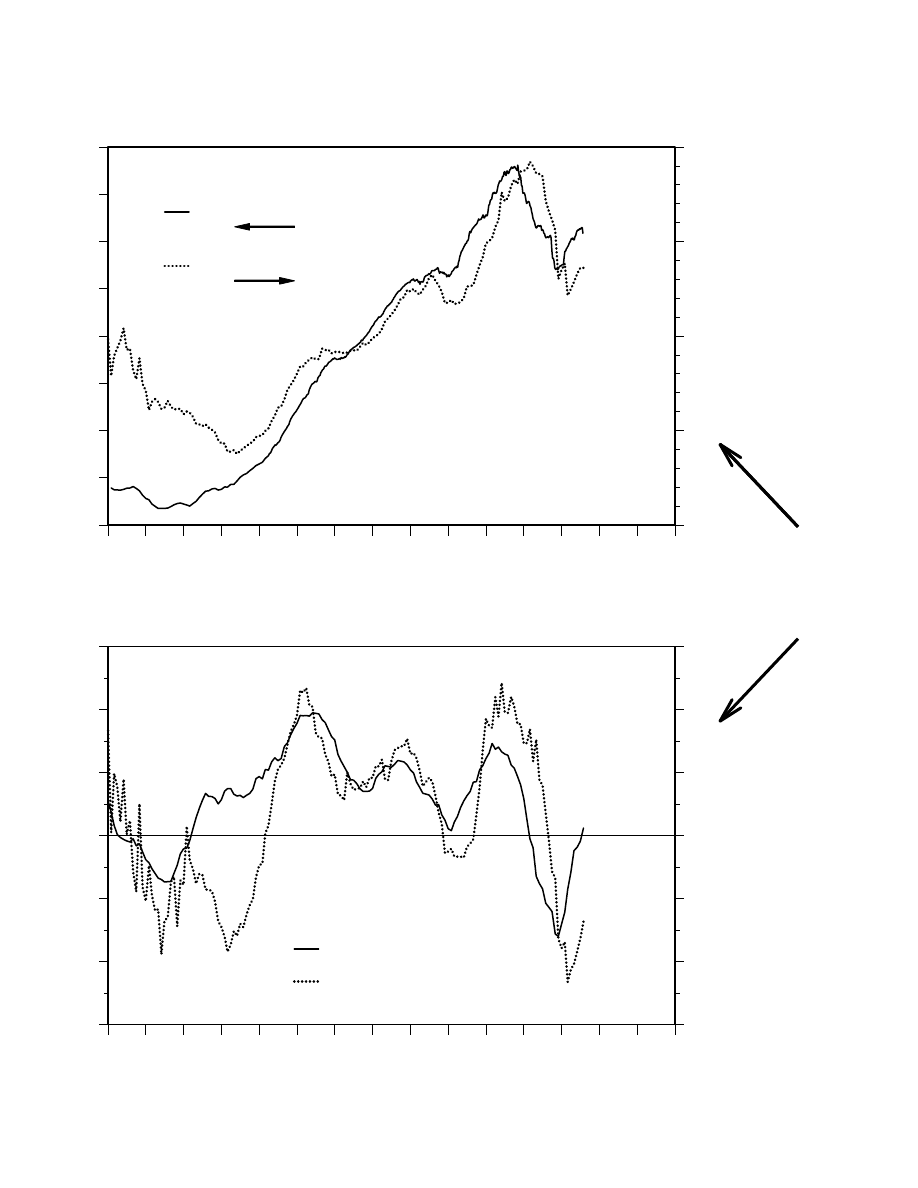
Figure 21.
1991
1992
1993
1994
1995
1996
1997
1998
1999
2000
2001
2002
2003
225
250
275
300
325
350
375
400
425
450
475
500
525
550
75
80
85
90
95
100
105
110
115
120
Apr
Jul
STOCK VALUATION MODEL
Expected Earnings Per Share
for TSE 300 (Canadian dollars)
Industrial Production
(1997=100)
1993
1994
1995
1996
1997
1998
1999
2000
2001
2002
2003
10
12
14
16
18
20
22
24
10
12
14
16
18
20
22
24
Jun
Fair-Value P/E
Forward P/E
1993
1994
1995
1996
1997
1998
1999
2000
2001
2002
2003
2500
4500
6500
8500
10500
12500
2500
4500
6500
8500
10500
12500
Jun
Stock Price Index (TSE 300)
(ratio scale)
Fair-Value
(ratio scale)
1993
1994
1995
1996
1997
1998
1999
2000
2001
2002
2003
-30
-20
-10
0
10
20
30
40
50
-30
-20
-10
0
10
20
30
40
50
Jun
Overvalued
Undervalued
Yardeni
* Source: Thomson Financial.
- Global: Canada (TSE 300) -
Page 18 / July 30, 2002
/ Prudential Securities Asset Valuation & Allocation Models
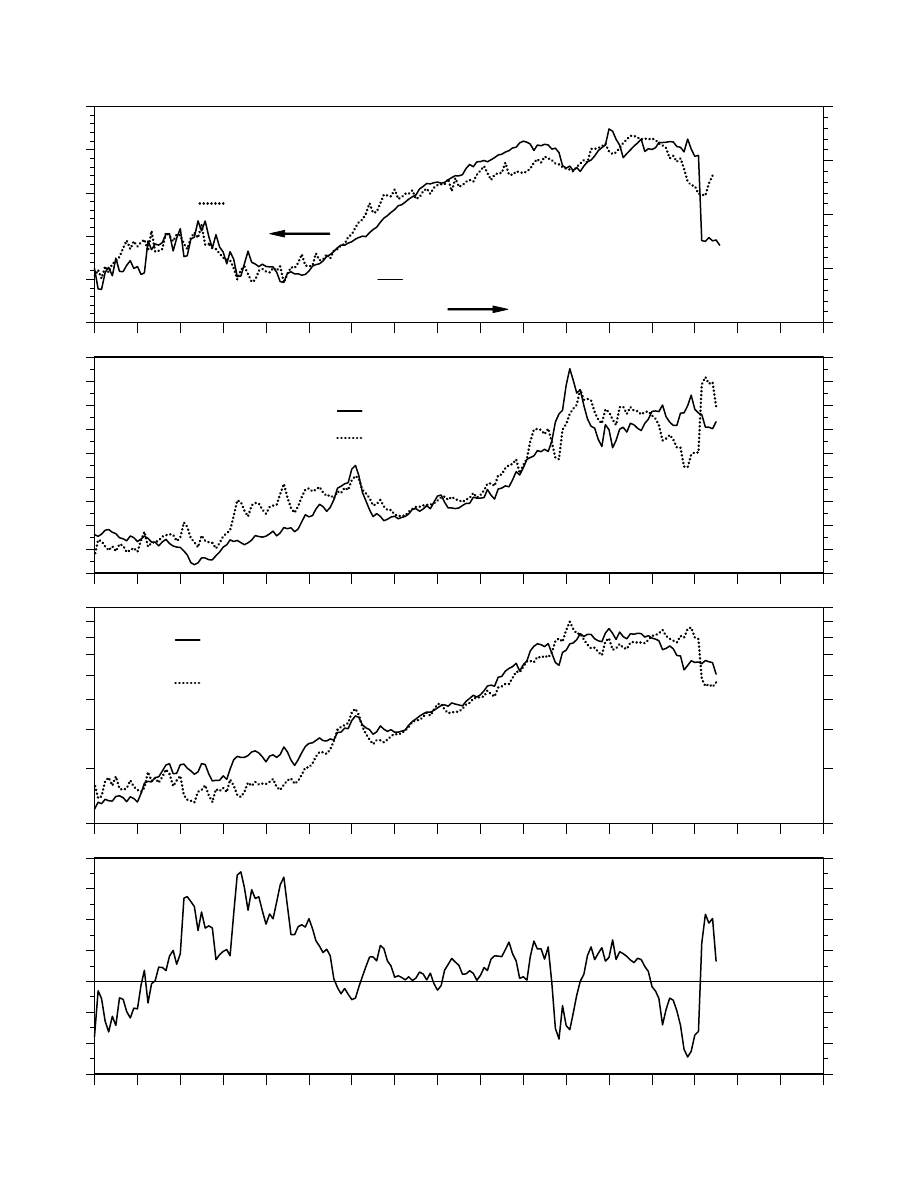
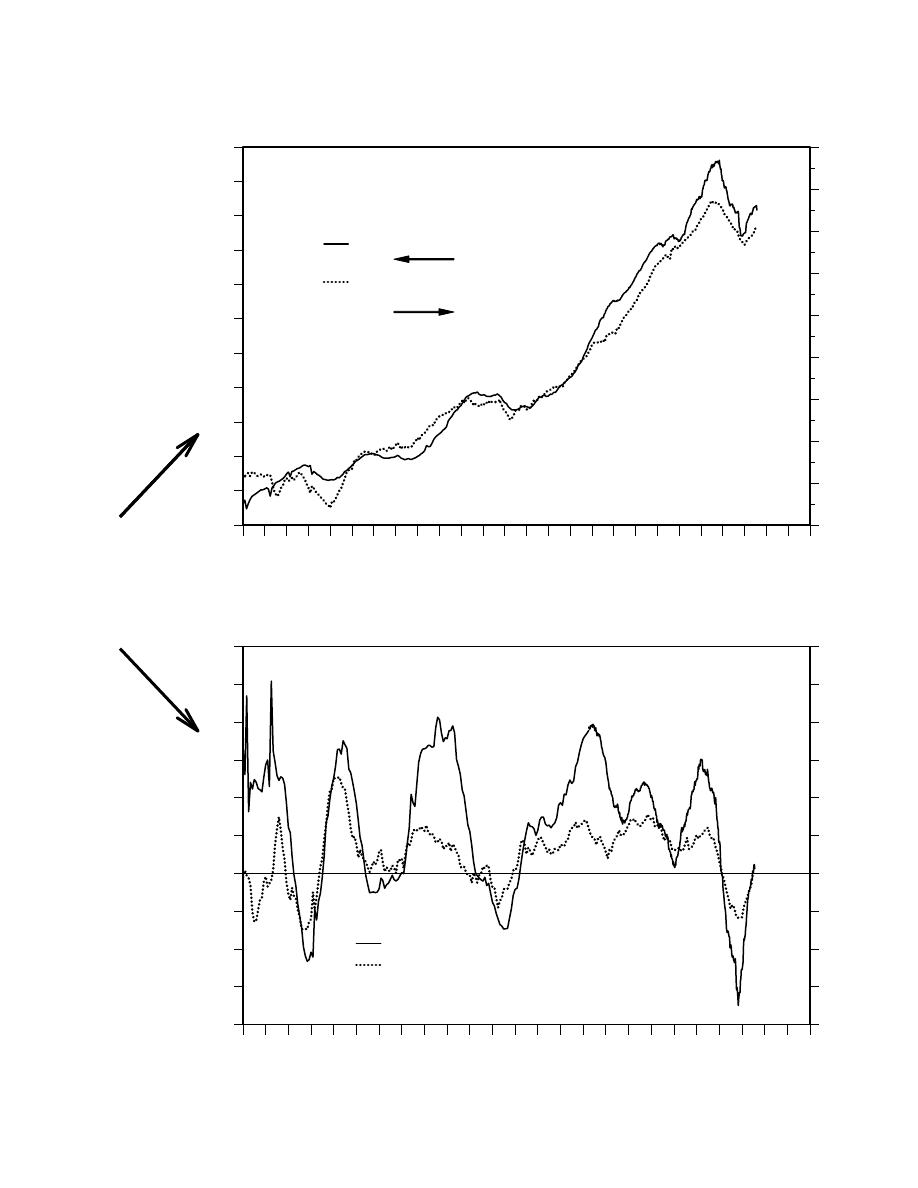
Figure 22.
1988
1989
1990
1991
1992
1993
1994
1995
1996
1997
1998
1999
2000
2001
2002
2003
2004
150
200
250
300
350
85
90
95
100
105
110
Jul
STOCK VALUATION MODEL
Expected Earnings Per Share
for FT 100 (pounds)
Industrial Production
(1995=100)
1988
1989
1990
1991
1992
1993
1994
1995
1996
1997
1998
1999
2000
2001
2002
2003
2004
7
9
11
13
15
17
19
21
23
25
7
9
11
13
15
17
19
21
23
25
Jun
Fair-Value P/E
Forward P/E
1988
1989
1990
1991
1992
1993
1994
1995
1996
1997
1998
1999
2000
2001
2002
2003
2004
1500
2300
3100
3900
4700
5500
6300
7100
7900
1500
2300
3100
3900
4700
5500
6300
7100
7900
Jun
Stock Price Index (FT 100)
(ratio scale)
Fair-Value
(ratio scale)
1988
1989
1990
1991
1992
1993
1994
1995
1996
1997
1998
1999
2000
2001
2002
2003
2004
-30
-20
-10
0
10
20
30
40
-30
-20
-10
0
10
20
30
40
Jun
Overvalued
Undervalued
Yardeni
Source: Thomson Financial.
- Global: United Kingdom (FT 100) -
Prudential Securities Asset Valuation & Allocation Models / July 30, 2002 / Page 19
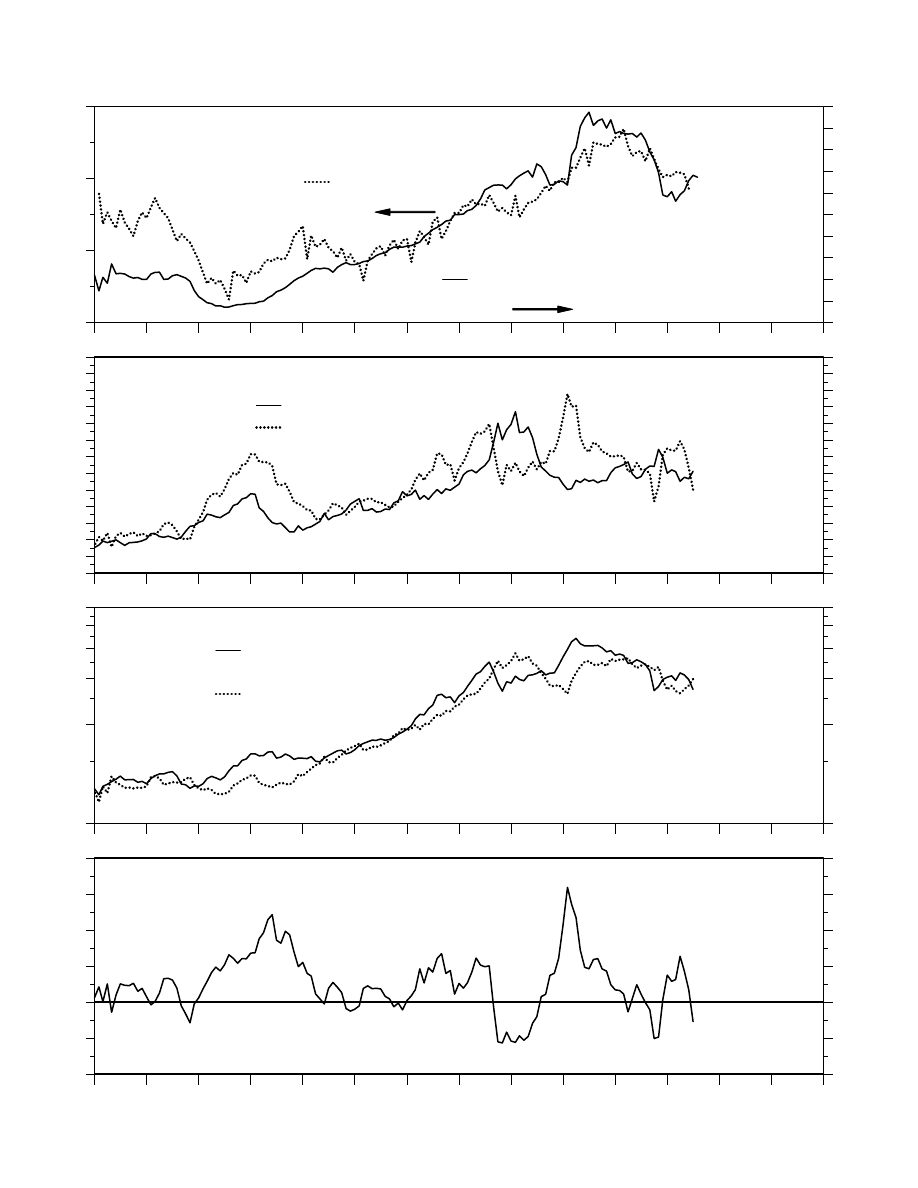
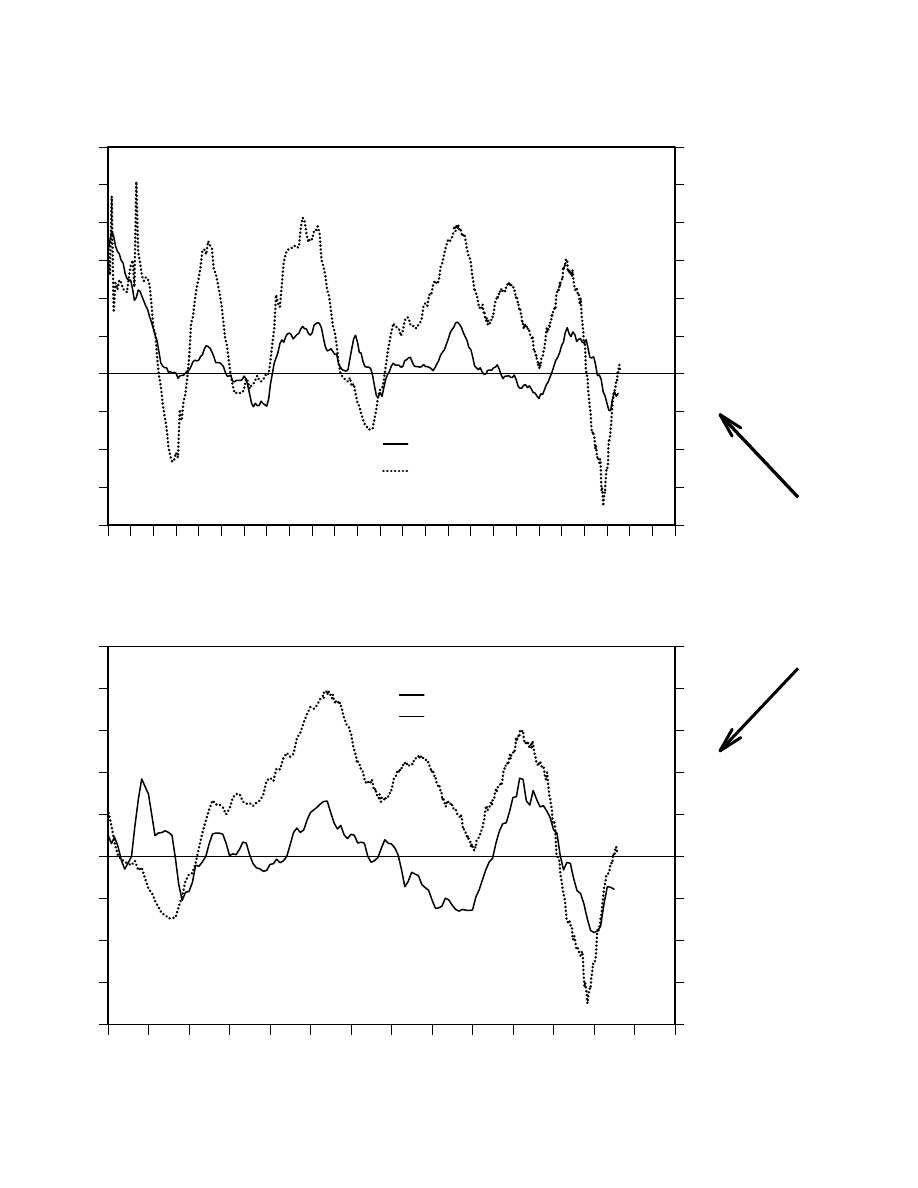
Figure 23.
1991
1992
1993
1994
1995
1996
1997
1998
1999
2000
2001
2002
2003
2004
75
100
125
150
175
200
225
250
275
300
325
90
100
110
120
Jul
STOCK VALUATION MODEL
Expected Earnings Per Share
for DAX (Euros)
Industrial Production
(1995=100)
1991
1992
1993
1994
1995
1996
1997
1998
1999
2000
2001
2002
2003
2004
8
10
12
14
16
18
20
22
24
26
28
30
32
34
8
10
12
14
16
18
20
22
24
26
28
30
32
34
Jun
Fair-Value P/E
Forward P/E
1991
1992
1993
1994
1995
1996
1997
1998
1999
2000
2001
2002
2003
2004
1000
3000
5000
7000
9000
11000
1000
3000
5000
7000
9000
11000
Jun
Stock Price Index (DAX)
(ratio scale)
Fair-Value
(ratio scale)
1991
1992
1993
1994
1995
1996
1997
1998
1999
2000
2001
2002
2003
2004
-40
-20
0
20
40
60
80
-40
-20
0
20
40
60
80
Jun
Overvalued
Undervalued
Yardeni
Source: Thomson Financial.
- Global: Germany (DAX) -
Page 20 / July 30, 2002
/ Prudential Securities Asset Valuation & Allocation Models
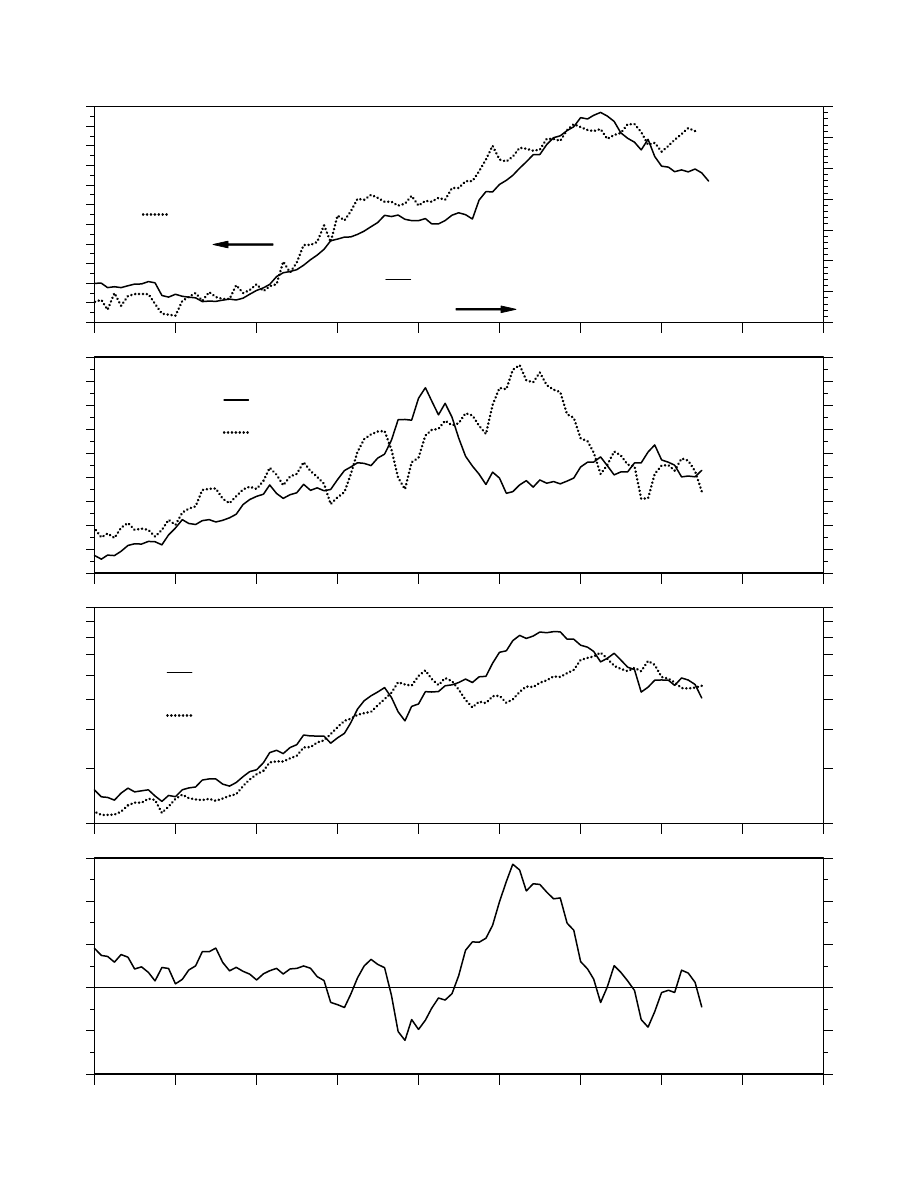
Figure 24.
1995
1996
1997
1998
1999
2000
2001
2002
2003
100
125
150
175
200
225
250
275
98
100
102
104
106
108
110
112
114
116
118
120
Jul
STOCK VALUATION MODEL
Expected Earnings Per Share
for CAC 40 (Euros)
Industrial Production
(1995=100)
1995
1996
1997
1998
1999
2000
2001
2002
2003
11
13
15
17
19
21
23
25
27
29
11
13
15
17
19
21
23
25
27
29
Jun
Fair-Value P/E
Forward P/E
1995
1996
1997
1998
1999
2000
2001
2002
2003
1500
2300
3100
3900
4700
5500
6300
7100
7900
1500
2300
3100
3900
4700
5500
6300
7100
7900
Jun
Stock Price Index (CAC 40)
(ratio scale)
Fair-Value
(ratio scale)
1995
1996
1997
1998
1999
2000
2001
2002
2003
-40
-20
0
20
40
60
-40
-20
0
20
40
60
Jun
Overvalued
Undervalued
Yardeni
Source: Thomson Financial.
- Global: France (CAC 40) -
Prudential Securities Asset Valuation & Allocation Models / July 30, 2002 / Page 21
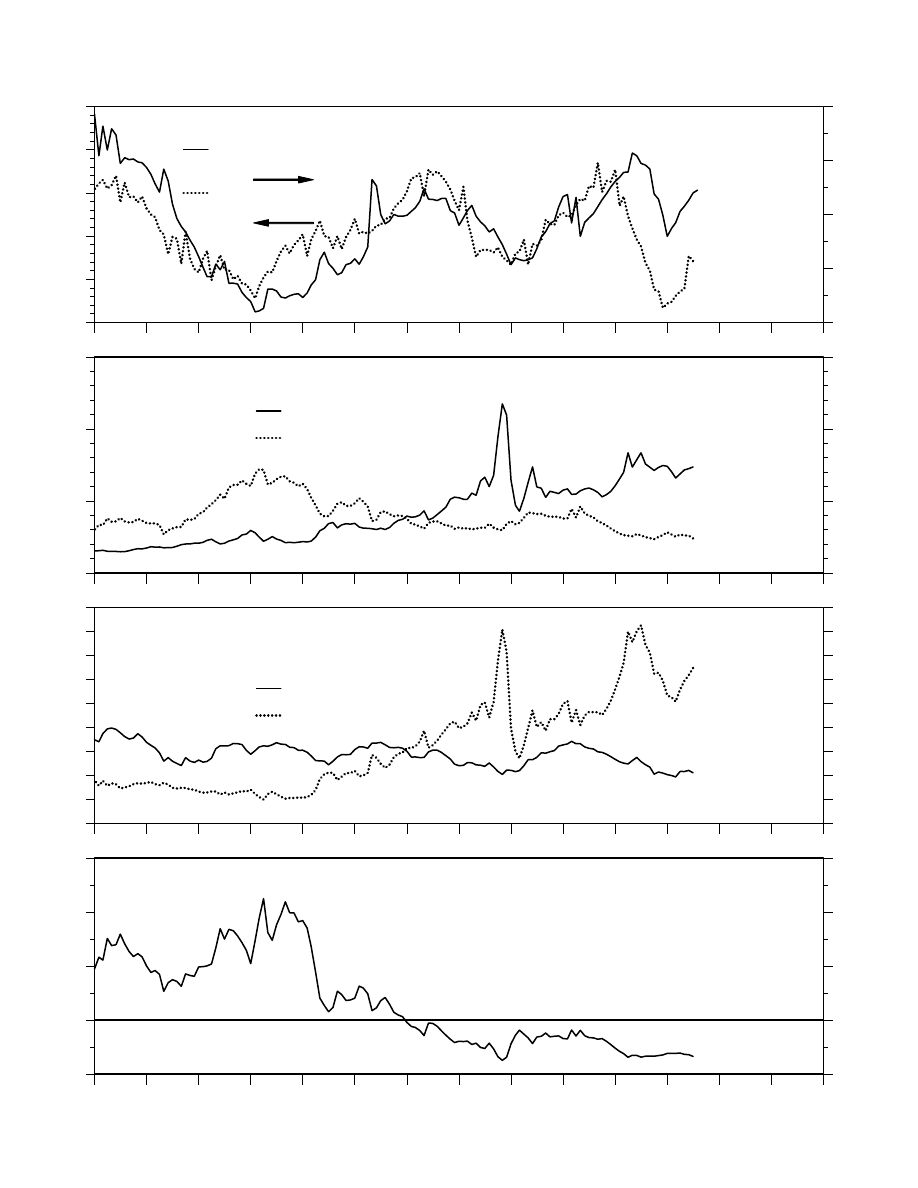
Figure 25.
1991
1992
1993
1994
1995
1996
1997
1998
1999
2000
2001
2002
2003
2004
20
30
40
50
60
90
95
100
105
110
115
Jun
Jul
STOCK VALUATION MODEL
Expected Earnings Per Share
for TOPIX (yen)
Industrial Production
(1995=100)
1991
1992
1993
1994
1995
1996
1997
1998
1999
2000
2001
2002
2003
2004
0
50
100
150
0
50
100
150
Jun
Fair-Value P/E
Forward P/E
1991
1992
1993
1994
1995
1996
1997
1998
1999
2000
2001
2002
2003
2004
0
500
1000
1500
2000
2500
3000
3500
4000
4500
0
500
1000
1500
2000
2500
3000
3500
4000
4500
Jun
Stock Price Index (TOPIX)
Fair-Value
1991
1992
1993
1994
1995
1996
1997
1998
1999
2000
2001
2002
2003
2004
-100
0
100
200
300
-100
0
100
200
300
Jun
Overvalued
Undervalued
Yardeni
Source: Thomson Financial.
- Global: Japan (TOPIX) -
Page 22 / July 30, 2002
/ Prudential Securities Asset Valuation & Allocation Models
1990
1991
1992
1993
1994
1995
1996
1997
1998
1999
2000
2001
2002
2003
2004
100
150
200
250
300
25
30
35
40
45
50
55
60
65
7/26
Jul
S&P 500 & G5 FORWARD EARNINGS
G5 Forward Earnings**
S&P 500 Forward Earnings*
* 52-week forward consensus expected S&P 500 operating earnings per share. Monthly through March 1994,
weekly after.
** Unweighted average of the 12-month forward consensus expected operating earnings per share for Canada,
France, Germany, Japan and United Kingdom. Source: Thomson Financial.
Yardeni
Figure 26.
Close correlation
between US and G5
profits cycle.
1990
1991
1992
1993
1994
1995
1996
1997
1998
1999
2000
2001
2002
2003
2004
-30
-20
-10
0
10
20
30
-30
-20
-10
0
10
20
30
Jul
Jul
S&P 500 & G5 FORWARD EARNINGS
(yearly percent change)
G5 Forward Earnings**
S&P 500 Forward Earnings*
* 12-month forward consensus expected operating earnings per share. Source: Thomson Financial.
** Unweighted average of the 12-month forward consensus expected operating earnings per share for Canada,
France, Germany, Japan and United Kingdom. Source: Thomson Financial.
Yardeni
Figure 27.
Figure 27.
- Earnings: US vs G5 -
Prudential Securities Asset Valuation & Allocation Models / July 30, 2002 / Page 23
79 80 81 82 83 84 85 86 87 88 89 90 91 92 93 94 95 96 97 98 99 00 01 02 03 04
70
80
90
100
110
120
130
140
150
160
10
15
20
25
30
35
40
45
50
55
60
65
7/26
Jun
S&P 500 EARNINGS & INDUSTRIAL PRODUCTION
S&P 500 Forward Earnings*
Industrial Production
(1992=100)
* 52-week forward consensus expected S&P 500 operating earnings per share. Monthly through March 1994,
weekly after
Source: Thomson Financial.
Figure 28.
Strong correlation
between US industrial
production and S&P
500 forward earnings.
80 81 82 83 84 85 86 87 88 89 90 91 92 93 94 95 96 97 98 99 00 01 02 03 04
-20
-15
-10
-5
0
5
10
15
20
25
30
-20
-15
-10
-5
0
5
10
15
20
25
30
7/26
S&P 500 EARNINGS & PRODUCTION
(yearly percent change)
S&P 500 Forward Earnings*
Industrial Production
* 52-week forward consensus expected S&P 500 operating earnings per share. Monthly through March 1994,
weekly after
Source: Thomson Financial.
Figure 29.
Figure 29.
- Earnings & Output: US -
Page 24 / July 30, 2002
/ Prudential Securities Asset Valuation & Allocation Models
80 81 82 83 84 85 86 87 88 89 90 91 92 93 94 95 96 97 98 99 00 01 02 03 04
-20
-15
-10
-5
0
5
10
15
20
25
30
-20
-15
-10
-5
0
5
10
15
20
25
30
7/26
Jun
S&P 500 EARNINGS & PRODUCER PRICE INDEX
(yearly percent change)
PPI: Intermediate Goods
S&P 500 Forward Earnings*
* 12-month forward consensus expected operating earnings per share. Source: Thomson Financial.
Yardeni
Figure 30.
Profits cycle is highly
correlated with pricing
cycles especially with
the intermediate
goods PPI and import
prices.
1990
1991
1992
1993
1994
1995
1996
1997
1998
1999
2000
2001
2002
2003
-20
-15
-10
-5
0
5
10
15
20
25
-20
-15
-10
-5
0
5
10
15
20
25
Jun
7/26
S&P 500 EARNINGS & US IMPORT PRICES
(yearly percent change)
Import Price Index
S&P 500 Forward Earnings*
* 12-month forward consensus expected operating earnings per share. Source: Thomson Financial, US
Department of Labor, Bureau of Labor Statistics.
Yardeni
Figure 31.
Figure 31.
- Earnings & Prices: US -
Prudential Securities Asset Valuation & Allocation Models / July 30, 2002 / Page 25
1991
1992
1993
1994
1995
1996
1997
1998
1999
2000
2001
2002
2003
100
125
150
175
200
225
250
275
92
94
96
98
100
102
104
106
108
110
112
114
116
118
120
May
Jul
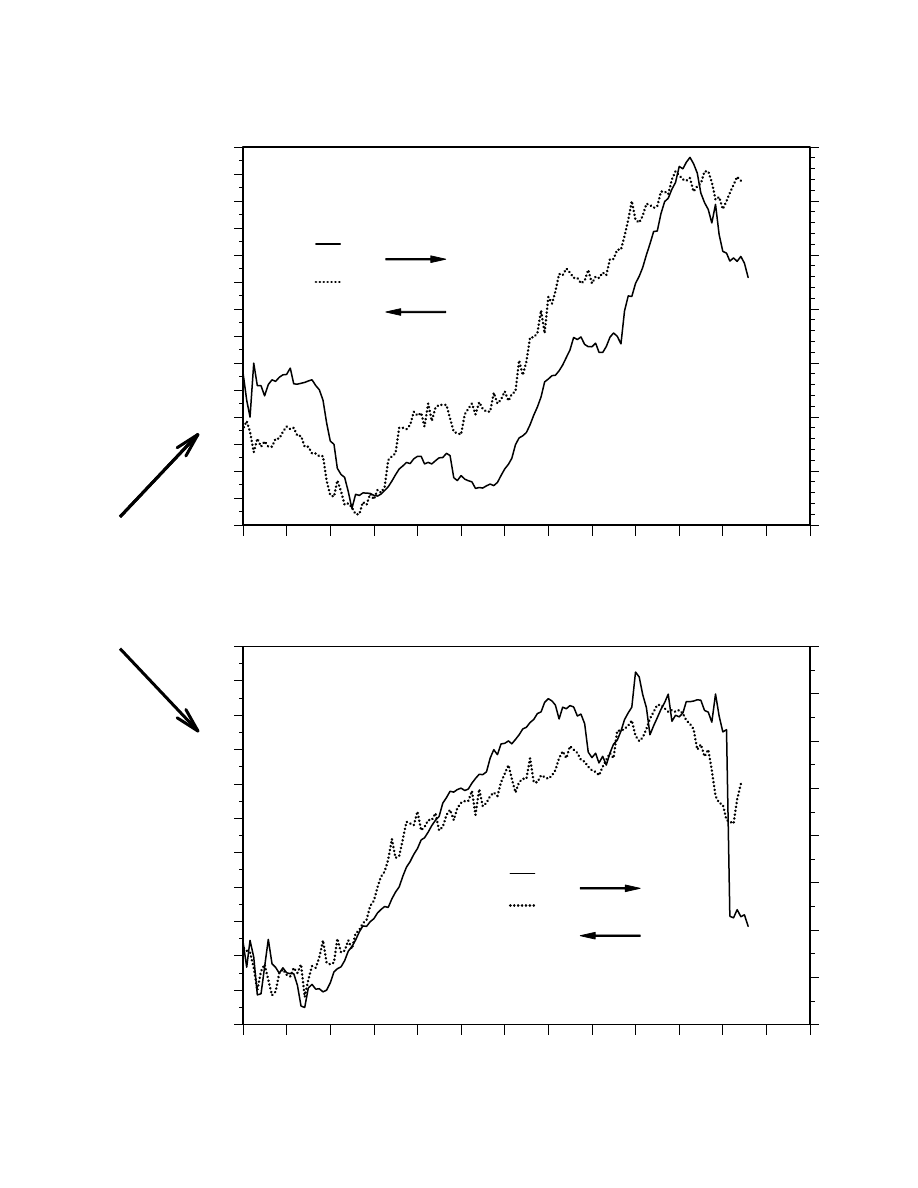
FRANCE: EARNINGS & PRODUCTION
Forward Earnings*
Industrial Production
(1995=100)
* 12-month forward consensus expected earnings per share for CAC 40.
Source: Thomson Financial.
Yardeni
Figure 32.
Industrial production
is key variable driving
profits in France and
UK.
1991
1992
1993
1994
1995
1996
1997
1998
1999
2000
2001
2002
2003
180
200
220
240
260
280
300
320
340
88
90
92
94
96
98
100
102
104
106
108
110
May
Jul
UNITED KINGDOM: EARNINGS & PRODUCTION
Forward Earnings*
Industrial Production
(1995=100)
* 12-month forward consensus expected earnings per share for FT 100.
Source: Thomson Financial.
Yardeni
Figure 33.
Figure 33.
- Earnings & Output: Europe -
Page 26 / July 30, 2002
/ Prudential Securities Asset Valuation & Allocation Models
1991
1992
1993
1994
1995
1996
1997
1998
1999
2000
2001
2002
2003
20
30
40
50
60
90
95
100
105
110
115
Jun
Jul
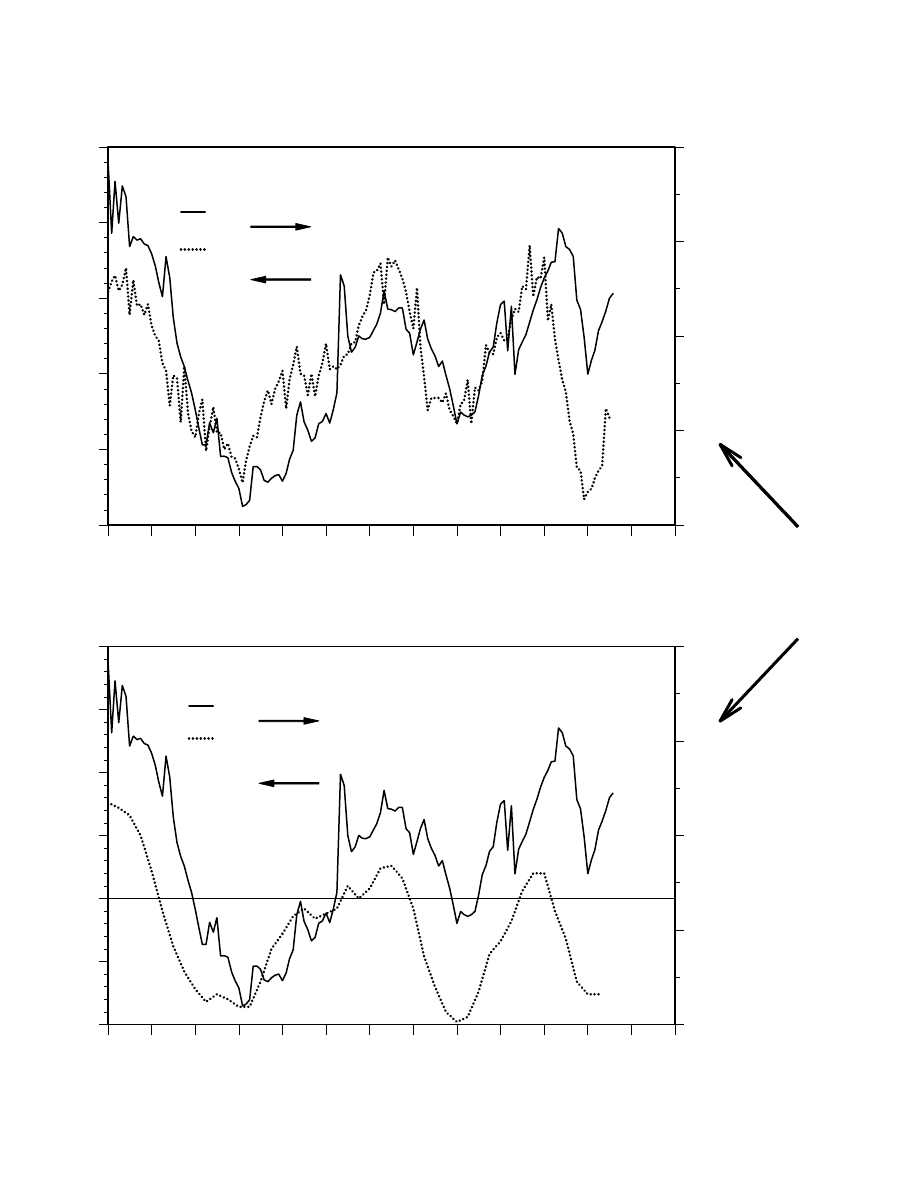
JAPAN: EARNINGS & PRODUCTION
Forward Earnings*
Industrial Production
(1995=100)
* 12-month forward consensus expected operating earnings per share for TOPIX.
Source: Thomson Financial.
Yardeni
Figure 34.
Japan’s profits cycle
driven by
manufacturing.
1991
1992
1993
1994
1995
1996
1997
1998
1999
2000
2001
2002
2003
20
30
40
50
60
-50
-25
0
25
50
75
100
Q1
Jul
JAPAN: EARNINGS & TANKAN BUSINESS CONDITIONS
Tankan Business Conditions:
Major Manufacturers
(diffusion index)
Forward Earnings*
* 12-month forward consensus expected earnings per share for TOPIX.
Source: Thomson Financial.
Yardeni
Figure 35.
Figure 35.
- Earnings & Output: Japan -
Prudential Securities Asset Valuation & Allocation Models / July 30, 2002 / Page 27

R E S E A R C H
The research analyst(s) or a member of the research analyst’s household does not have a financial interest in any of the tickers mentioned in this report.
The research analyst or a member of the team does not have a material conflict of interest relative to any stock mentioned in this report
The research analyst has not received compensation that is based upon (among other factors) the firm’s investment banking revenues as it related to any stock mentioned in this report
The research analyst, a member of the team, or a member of the household do not serve as an officer, director, or advisory board member of any stock mentioned in this report
Prudential Securities has no knowledge of any material conflict of interest involving the companies mentioned in this report and our firm
When we assign a Buy rating, we mean that we believe that a stock of average or below average risk offers the potential for total return of 15% or more over the next 12 to 18 months. For higher
risk stocks, we may require a higher potential return to assign a Buy rating. When we reiterate a Buy rating, we are stating our belief that our price target is achievable over the next 12 to 18
months.
When we assign a Sell rating, we mean that we believe that a stock of average or above average risk has the potential to decline 15% or more over the next 12 to 18 months. For lower risk
stocks, a lower potential decline may be sufficient to warrant a Sell rating. When we reiterate a Sell rating, we are stating our belief that our price target is achievable over the next 12 to 18
months.
A Hold rating signifies our belief that a stock does not present sufficient upside or downside potential to warrant a Buy or Sell rating, either because we view the stock as fairly valued or
because we believe that there is too much uncertainty with regard to key variables for us to rate the stock a Buy or Sell.
Rating distribution
Rating distribution
Rating distribution
Rating distribution
07/15/02
Firm
Firm
Firm
Firm
IBG Clients
IBG Clients
IBG Clients
IBG Clients
Buy
Buy
Buy
Buy
40.00%
4.00%
50.00%
Hold
Hold
Hold
Hold
56.00%
5.00%
50.00%
Sell
Sell
Sell
Sell
3.00%
1.00%
0.00%
Excludes Closed End Funds
Any OTC-traded securities or non-U.S. companies mentioned in this report may not be cleared for sale in all states.
02-XXXX
Securities products and services are offered through Prudential Securities Incorporated, a Prudential company.
©Prudential Securities Incorporated, 2002, all rights reserved. One Seaport Plaza, New York, NY 10292
Prudential Financial is a service mark of The Prudential Insurance Company of America, Newark, NJ, and its affiliates.
Information contained herein is based on data obtained from recognized statistical services, issuer reports or communications, or other sources, believed to be reliable. However, such
information has not been verified by us, and we do not make any representations as to its accuracy or completeness. Any statements nonfactual in nature constitute only current opinions,
which are subject to change. Prudential Securities Incorporated (or one of its affiliates or subsidiaries) or their officers, directors, analysts, employees, agents, independent contractors, or
consultants may have positions in securities or commodities referred to herein and may, as principal or agent, buy and sell such securities or commodities. An employee, analyst, officer, agent,
independent contractor, a director, or a consultant of Prudential Securities Incorporated, its affiliates, or its subsidiaries may serve as a director for companies mentioned in this report. Neither
the information nor any opinion expressed shall constitute an offer to sell or a solicitation of an offer to buy any securities or commodities mentioned herein. There may be instances when
fundamental, technical, and quantitative opinions may not be in concert. This firm (or one of its affiliates or subsidiaries) may from time to time perform investment banking or other services for,
or solicit investment banking or other business from, any company mentioned in this report.
There are risks inherent in international investments, which may make such investments unsuitable for certain clients. These include, for example, economic, political, currency exchange rate
fluctuations, and limited availability of information on international securities. Prudential Securities Incorporated, its affiliates, and its subsidiaries make no representation that the companies
which issue securities which are the subject of their research reports are in compliance with certain informational reporting requirements imposed by the Securities Exchange Act of 1934.
Sales of securities covered by this report may be made only in those jurisdictions where the security is qualified for sale. The contents of this publication have been approved for distribution by
Prudential-Bache International Limited, which is regulated by The Securities and Futures Authority Limited. We recommend that you obtain the advice of your Financial Advisor regarding this or
other investments.
Additional information on the securities discussed herein is available upon request.
Document Outline
- - Introduction -
- - Asset Allocation -
- - Valuation Model -
- - Valuation Model -
- - Earnings -
- - Earnings -
- - Earnings -
- - New Improved Model -
- - New Improved Model -
- - New Improved Model -
- - Global: Expected Earnings* -
- - Global: Stock Valuation -
- - Global: United States (S&P 500) -
- - Global: Canada (TSE 300) -
- - Global: United Kingdom (FT 100) -
- - Global: Germany (DAX) -
- - Global: France (CAC 40) -
- - Global: Japan (TOPIX) -
- - Earnings: US vs G5 -
- - Earnings & Output: US -
- - Earnings & Prices: US -
- - Earnings & Output: Europe -
- - Earnings & Output: Japan -
Wyszukiwarka
Podobne podstrony:
anal deutsche bank polska
Pewnego dnia pewna starsza dama przyszła do Deutsche Bank z torbą pełną pieniędzy, pliki
anal deutsche bank polska
anal deutsche bank polska
Digital Card Models 2002 Samolot B 25B Michell
WOTRSCHATZ Bank, Deutsch, Wortschatz und Grammatik
Prudential Financial Research Stock Valuation Models
2002 all models
BANK CENTRALNY I JEGO FUNKCJE
Bank centralny 5
Europejski Bank Centralny
Bank centralny
Ustawa z 30 10 2002 r o ubezp społ z tyt wyp przy pracy i chor zawod
Die Baudenkmale in Deutschland
ecdl 2002
5 Bank Swiatowy
ei 03 2002 s 62
więcej podobnych podstron