PC Scopes
CHECK THE
Pc-Lab2000
T M
GETTING STARTED GUIDE
FOR SOFTWARE INSTALLATION
R
R
e
e
f
f
e
e
r
r
e
e
n
n
c
c
e
e
M
M
a
a
n
n
u
u
a
a
l
l
PCS500
PCS100 / K8031

PCS500 / PCS100 / K8031
2
VELLEMAN Instruments is a division of
VELLEMAN Components NV
Legen Heirweg 33
9890 Gavere
Belgium
Support & updates : http://www.Velleman.be
Velleman Instruments
HPCS500_UK- 2001– 1

PCS500 / PCS100 / K8031
3
FCC information for the USA
This equipment has been tested and found to comply with the limits for a
Class B digital device, pursuant to Part 15 of the FCC R ules. These limits are
designed to provide reasonable protection against harmful interference in a
residential installation. This equipment generates, uses and can radiate
radio frequency energy and, if not installed and used in accordance with the
instructions, may cause harmful interference to radio communications.
However, there is no guarantee that interference will not occur in a particular
installation. If this equipment does cause harmful interference to radio or
television reception, which can be determined by turning the equipment off
and on, the user is encouraged to try to correct the interference by one or more
of the following measures:
•
Reorient or relocate the receiving antenna.
•
Increase the separation between the equipment and receiver.
•
Connect the equipment into an outlet on a circuit different from that to
which the receiver is connected.
•
Consult the dealer or an experienced radio/TV technician for help.
Important
This equipment was tested for FCC compliance under conditions that include
the use of shielded test leads between it and the peripherals. It is important
that you use shielded cables and connectors to reduce the possibility of
causing Radio and Television interference.
Shielded probes, suitable for the PCS500 oscilloscope can be obtained
from the authorized Velleman dealer.
If the user modifies the PCS500 oscilloscope or its connections in any way,
and these modifications are not approved by Velleman, the FCC may withdraw
the user’s right to operate the equipment.
The following booklet prepared by the Federal Communications Commission
may be of help: “How to identify and Resolve Radio-TV Interference problems”.
This booklet is available from the US Government Printing Office, Washington,
DC20402 Stock No. 044-000-00345-4.

PCS500 / PCS100 / K8031
4
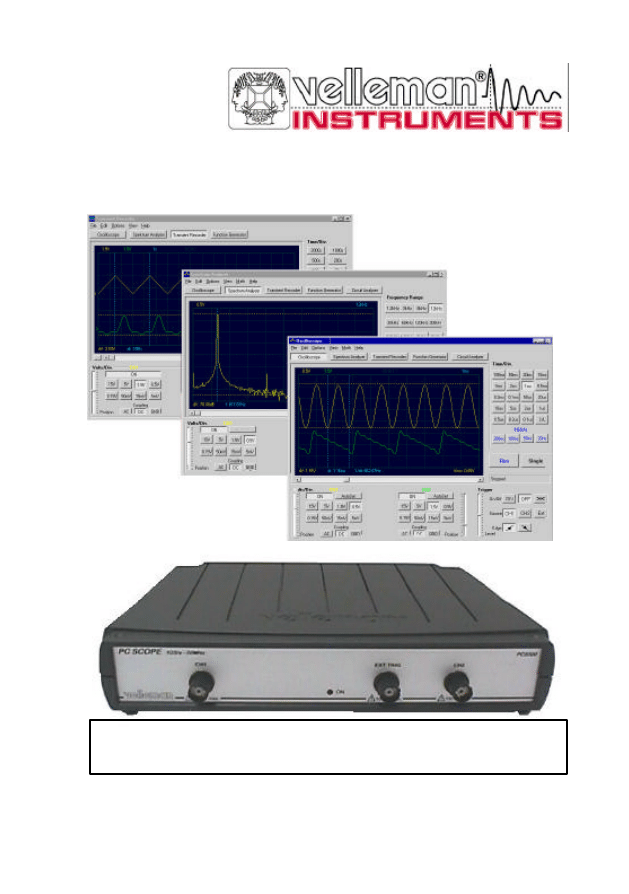
GENERAL
The PCS500 / PCS100 / K8031 are digital storage oscilloscopes, using a
computer and its monitor to display waveforms. All standard oscilloscope
functions are available in the Windows program supplied. Its operation is just
like a normal oscilloscope with the difference that most operations can be
done using the mouse. The markers for indicating voltage and frequency also
provide considerable ease of use and can be operated without difficulty using
the mouse. Apart from being used as an oscilloscope, the unit can also be
used as a spectrum analyzer and as a transient signal recorder, for recording
voltage variations or for comparing two voltages over a longer period (over
more than a year!). Connection is through the computer's parallel port; the
scopes are completely optically isolated from the computer port. Any waveform
displayed on the screen can be stored for later use in documents or for
comparison of waveforms. Together with the PCG10 function generator, a
powerful Bode plotter can be made. In the PCS500 the oscilloscope and
transient recorder have two completely separated channels.
PCS500 features
•
Inputs: 2 channels, 1 external trigger input
•
Input impedance: 1 Mohm / 30pF
•
Frequency response
±
3dB: 0Hz to 50MHz
•
Maximum readout error: 2.5%
•
Low noise
•
Pre-trigger function
•
Maximum input voltage: 100V (AC + DC)
•
Input coupling: DC, AC and GND
•
Optically isolated from computer
•
Supply voltage: 9 - 10Vdc / 1000mA
•
Dimensions: 230x165x45mm (9x6.5x1.8”)
•
Weight: 490g (17oz)
PCS100 / K8031 features
•
1 channel input
•
Input impedance: 1 Mohm / 30pF
•
Frequency response ±3dB: 0 Hz to 12MHz
•
Maximum readout error: 2.5%
•
Slew rate 1div/10ns
•
Low noise
•
Maximum input voltage: 100V (AC + DC)
•
Input coupling: DC, AC, (GND only for PCS100)
•
Optically isolated from computer
•
Supply voltage: 9 - 10Vdc / 500mA
•
Dimensions: 230x165x45mm (9x6.5x1.8”)
•
Weight: 400g (14oz)

PCS500 / PCS100 / K8031
5
Minimum system requirements
•
IBM compatible PC
•
Windows 95, 98, ME, (Win2000 or NT possible)
•
SVGA display card (min. 800x600)
•
Mouse
•
Free printer port LPT1, LPT2 or LPT3
•
CD Rom player
Options
•
Insulated measurement probe x1 / x10: PROBE60S
•
Soft carry case: GIP
Technical data
PCS500 Oscilloscope
•
Time base: 20ns to 100ms per division
•
Trigger source: CH1, CH2, EXT or free run
•
Trigger level: adjustable in whole screen
•
Input sensitivity: 5mV (10mV for PCS100 / K8031) to 15V/division
•
Record length: 4096 samples / channel
•
Sampling frequency: Real time* 1.25 kHz to 50 MHz
•
Sampling frequency: Repetitive*: 1 GHz (Equivalent Sampling Rate)
PCS100 / K8031 Oscilloscopes
•
Time base: 0.1us to 100ms per division
•
Trigger source: CH1 or free run
•
Trigger level: adjustable per ½ division
•
Input sensitivity: 10mV to 3V per division
•
Record length: 4079 samples
•
Sampling frequency: Real time* 800Hz to 32MHz
PCS500 / PCS100 / K8031 general data
•
Trigger edge: rising or falling
•
Step markers for voltage, time and frequency
•
Interpolation: linear or smoothed
•
Vertical resolution: 8 bit
•
Auto setup function
•
True RMS readout (only AC component)
(*) Real-time Sampling:
A sampling mode in which the picture is build by collecting as many samples
as it can as the signal occurs.
(*) Equivalent Sampling rate:
A sampling mode in which the picture is builds using repetitive signals by
capturing information from each repetition.

PCS500 / PCS100 / K8031
6
Transient recorder
•
Timescale: 20ms/Div to 2000s/Div
•
Max record time: 9.4hour/screen
•
Automatic storage of data
•
Automatic recording for more than 1 year
•
Max. Number of samples: 100/s
•
Min. number of samples: 1 sample/20s
•
Markers for time and amplitude
•
Zoom function
•
Record and display of screens
•
Data format: ASCII
Spectrum analyser
•
Frequency range PCS500: 0.. 1.2kHz to 25MHz
•
Frequency range PCS100 / K8031: 0.. 400Hz to 16MHz
•
Linear or logarithmic timescale
•
Operating principle: FFT (Fast Fourier Transform)
•
FFT resolution: 2048 lines
•
FFT input channel: CH1 or CH2 (CH1 for PCS100 / K8031)
•
Zoom function
•
Markers for amplitude and frequency

PCS500 / PCS100 / K8031
7
SAFETY and WARNINGS
Symbols displayed on the unit
!
Important safety information, see user manual.
The PC scopes are optically isolated from the PC, but even then it
is advisable to measure only safe devices.
⇒
Measurements should be avoided in case of polluted or very humid air.
One should also refrain from measuring conductors or installations that
use voltages that exceed 600Vrm s above ground level. CAT II indicates
conformity for measurements of domestic installations.
⇒
The maximum input voltage for the connections of the unit stands at 100Vp
(AC+DC)
⇒
Do NOT open the enclosure while performing measurements.
⇒
Remove all test leads before opening the enclosure in order to avoid
electrical shock.
⇒
Use a measuring probe with an insulated connector ( e.g. type
PROBE60S) when measuring voltages exceeding 30V.
Before making measurements and for safety reasons, it is important to know
some information about the measured unit.
Safe devices are:
•
Battery operated equipment
•
Equipment supplied via a transformer or adapter.
Unsafe devices are:
•
Equipment directly connected to mains (e.g. old TV sets)
•
Equipment that contains components that are d irectly connected to mains
(dimmers…).
It is advisable, when measuring on above equipment, to use a isolation
transformer.
Always be careful when measuring directly to the mains; please remember
that the ground of both channels is interconnected!
F
IMPORTANT: Prior to measuring high voltages, set the probe to the X10
position.
PCS500 / PCS100 / K8031
8
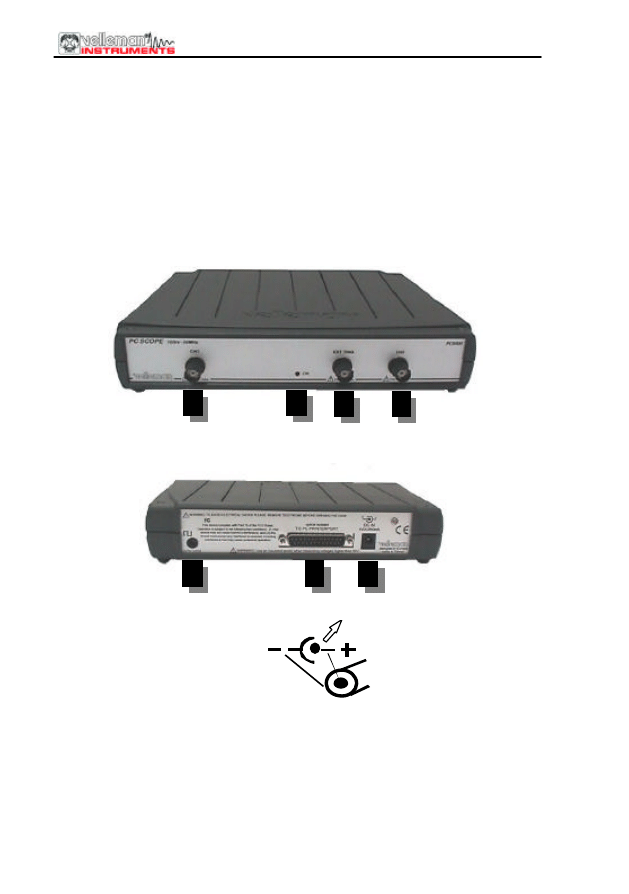
CONNECTIONS
Survey of the connections and controls
1.BNC input connectors (1CH for PCS100 / K8031)
2.BNC external trigger input (max. input 100Vp AC+DC) only PCS500
3.Power indication LED (software driven)
4.Adapter connection (observe the polarity!)
5.Parallel port connector
6.X10 probe testing signal (at front panel for PCS100 / K8031)
PCS500 PICTURES
1
2
3
1
4
6
5
The unit is connected to the printer port LPT of the computer, using a parallel
cable.
PCS500 / PCS100 / K8031
9
Connection
Connect the oscilloscope unit to the printer port LPT1, LPT2 or LPT3.
To select the LPT port address click Hardware Setup on Options menu or run
Pc-Lab2000 software.
Connect the mains voltage DC adapter to the unit : 9VDC / 1000m A. (500mA
for PCS100 / K8031) (pin = positive).
M
ATTENTION: Only use adapter with correct voltage otherwise the unit could
be damaged.
Using a wrong power supply could blow the internal fuse. The fuse is
soldered onto the PCB, please contact an experienced service center, to
replace the fuse. The best w ay is to cut the leads of the fuse, and to solder a
new (2A PICO, 1A for PCS100 / K8031) fuse onto the old leads.
After starting the software (see also getting started manual), the LED on the
front panel should lid.
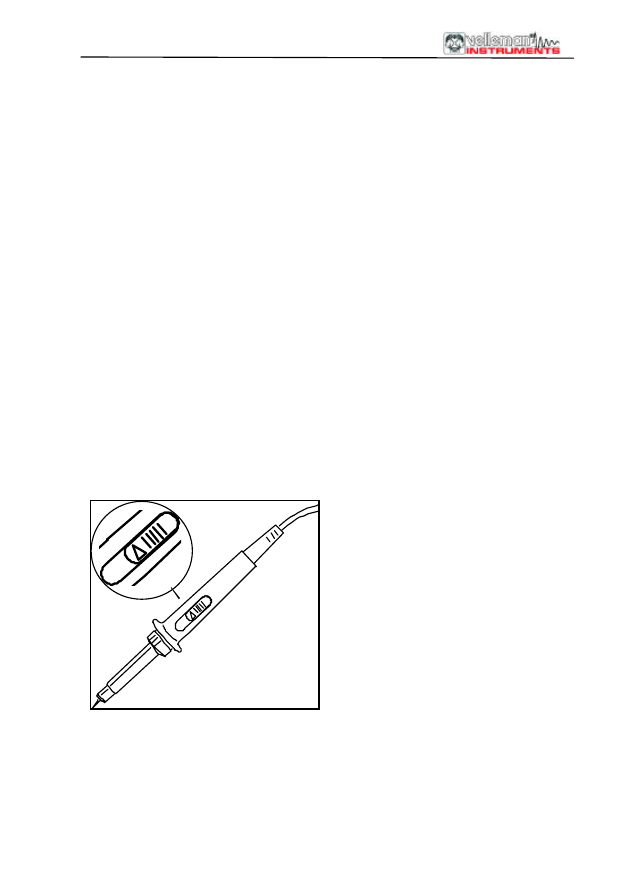
Measuring probe
We advise the user to use a measuring probe equipped with a X10 setting
when high or unknown voltages or high impedances need to be measured.
(e.g. our PROBE60S type)
When using the measuring probe in the X10 position, the measuring
impedance will increase to 10Mohm, thereby reducing the measuring
instrument's charge on the coupling.
x1
x
10
x1 x10
IMPORTANT: X10 measuring probes should be calibrated. See probe
manual.
PCS500 / PCS100 / K8031
10
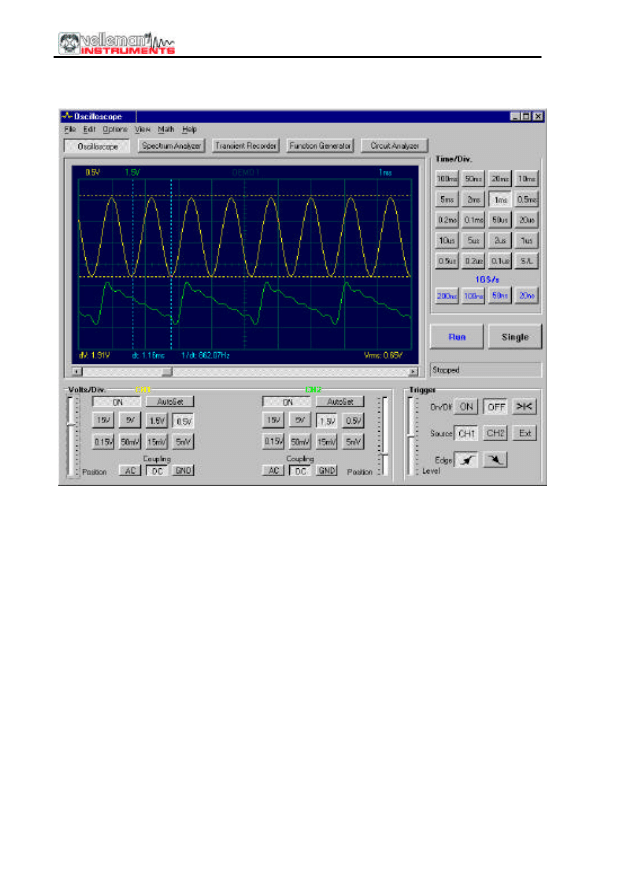
DIGITAL STORAGE OSCILLOSCOPE "DSO"
PCS500 screenshot
PURPOSE
An oscilloscope is an indispensable instrument for viewing electrical signals.
The advantage of a digital oscilloscope is that the measured signals can be
frozen for subsequent examination or comparison with other signals. In
digitizing the signal there is the additional advantage that it can also be
scientifically analyzed. Thus the calculation of RMS values is no problem,
although remember that the displayed RMS value is only for the AC
component of the measured signal. By using the markers the signal frequency
can be determined (by measuring the time of one period), and the voltage can
also be measured between the two markers.
When using a digital oscilloscope, it should be remembered that the signal to
be measured is split up piece-wise, i.e. into "samples". The result of such
splitting is that certain signals may escape the sampling frequency, especially
in the case of high frequency signals.
PCS500 / PCS100 / K8031
11
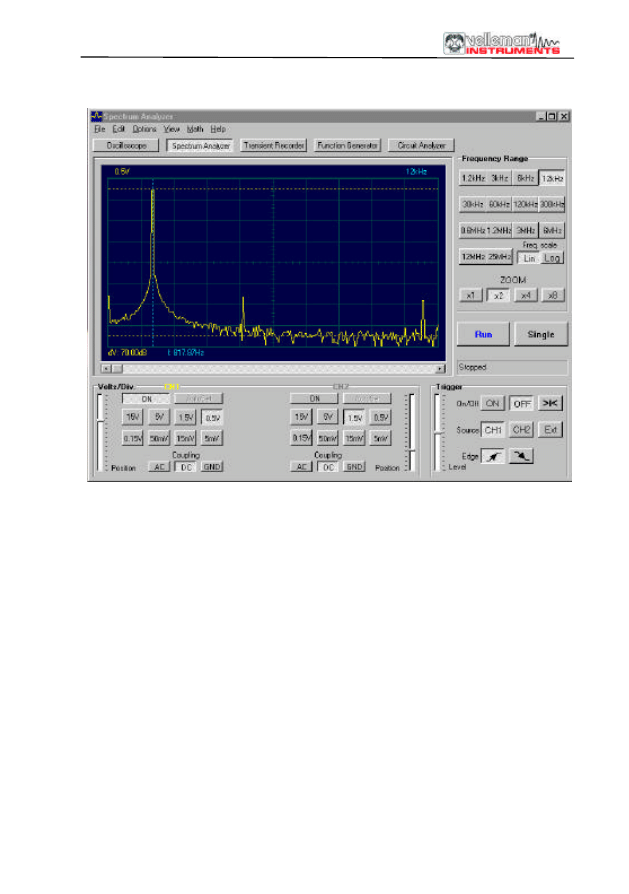
SPECTRUM ANALYZER "FFT"
PCS500 screenshot
PURPOSE
Only one fundamental frequency of a signal can be properly measured using
an oscilloscope, the levels of other frequencies cannot be easily examined
and compared simultaneously. The spectrum analyzer is the solution to this
problem.
Because the incoming signal is digitized, it is possible for the signal to be
scientifically converted into its frequency spectrum (using FFT - Fast Fourier
Transforms).
With the spectrum analyzer program supplied, it is possible to view the signal
in terms of its frequency spectrum. Thus, the harmonics in a distorted,
imperfect sine wave (e.g., square wave) can be examined.
Furthermore the spectrum analyzer can also be used for measuring filter
circuits, etc.
PCS500 / PCS100 / K8031
12
SOFTWARE CONTROLS
Remarks:
•
Due to software upgrades, the actual menus can differ from the ones
described in this manual, please also refer to the Help file (English only)
•
PCS100 / K8031 has only one channel and no external trigger input
All modules:
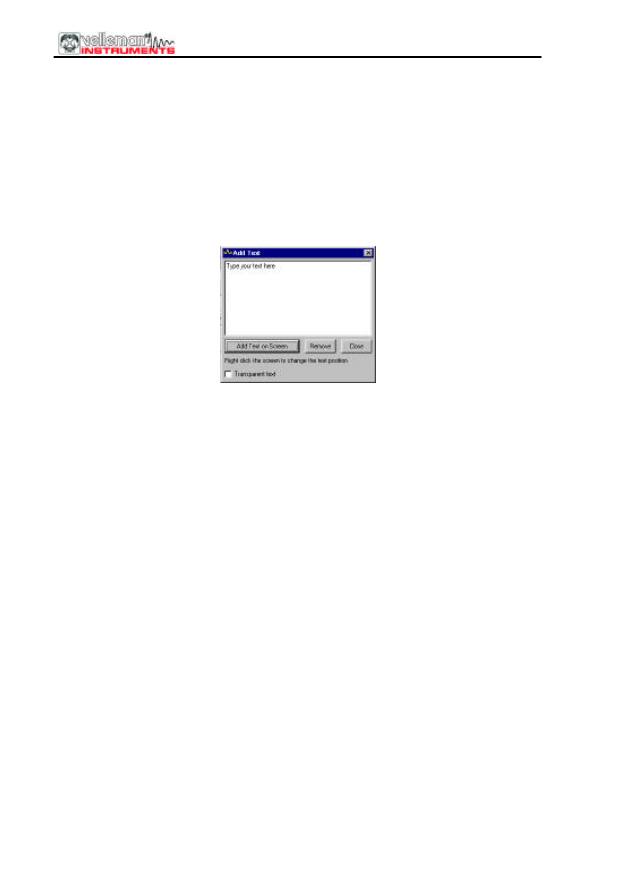
How to add a comment in the signal screen:
Right mouse Click into the screen
Text box will open, to write your comment:
Click “Add text on the screen” or “Remove” to remove previously inserted text.
Right click on the screen to position your text.
Click “Close”
To make the text transparent with the background, check “Transparent text”
The text will have the same color as the vertical time/frequency markers.
Oscilloscope mode (DSO)
VOLTS/DIV
Selected value indicates the peak-to-peak voltage required to produce a
peak-to-peak deflection of one major division on the screen.
The vertical position sliders move the trace in Y position.
CH1, CH2
Buttons turn the display of the trace ON or OFF. To get the cursor
measurements of CH2 voltage values switch CH1 off.
COUPLING
AC: the input signal is capacitive coupled to the input amplifier/attenuator. Only
the AC components are measured.
GND: (not for K8031) the input signal is broken and the input
amplifier/attenuator is connected to earth. Use this position for selecting a
reference point on the display.
DC: the input signal is directly connected to the input amplifier/attenuator. Both
AC and DC voltage are measured.

PCS500 / PCS100 / K8031
13
TIME/DIV
Selects the time setting for the beam to sweep one major division on the
screen. By selecting different TIME/DIV settings it is possible to zoom the
frozen waveform on the screen.
TRIGGER On/Off
Selects free run mode or trigged mode.
TRIGGER Level
Selects the signal level at which the sweep is triggered.
Triggering reference mark is displayed with the horizontal line on the left side
of the screen.
TRIGGER Channel
Selects the trigger source signal (CH1, CH2 or EXT)
TRIGGER Edge
Selects the triggering slope:
Arrow up: Trigger occurs when triggering signal crosses trigger level in a
positive going direction.
Arrow down: Trigger occurs when triggering signal crosses trigger level in a
negative going direction.
>|<
Resets the triggering x-position reference point. Triggering reference mark is
displayed with the vertical line on the bottom of the screen.
|< (PCS100 / K8031)
Resets the trace starting from the triggering point.
RUN
Selects recurrent display update mode (RUN). Pressing the button again
freezes the display.
SINGLE
When button is depressed and the trigger level is reached, refreshment of the
display takes place only once.
X-POSITION SCROLLBAR (Below the waveform display)
Positions the trace horizontally on the screen. Triggering reference point is
displayed with the vertical line on the bottom of the screen.
S/L
Button selects linear (L) or smoothed (S) interpolation. Linear interpolation
connects the data points with straight lines. Smoothed interpolation uses
curves to connect the data points . Smoothed interpolation gives better
waveform display at highest sine frequencies. Linear interpolation is better for
step signals. The S/L selection effects only at TIME/DIV settings 0.2 and 0.1us
(and in 1GS/s modes for the PCS500).
PCS500 / PCS100 / K8031
14
1GS/s sampling mode (not for PCS100 / K8031)
This 1GS/s sampling rate is in use on 0.2us/div, 0.1us/div, 0.05us/div and
0.02us/div ranges.
Triggering must be ON to get stable waveform images.
This mode is useable only for repetitive signals.
This operation mode is called "Random Interleaved Sampling" (RIS) method,
sometimes also called "Equivalent Time Sampling" (ET) mode or "Random
Repetitive Sampling". In this sampling mode the oscilloscope uses
successive triggering occurrences to gather the data to construct a picture of a
repetitive signal.
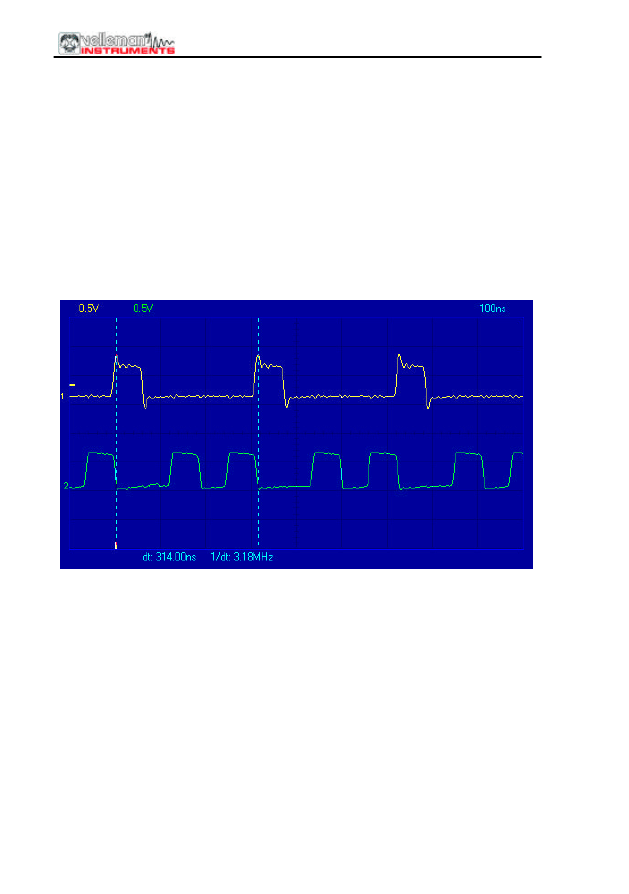
Hint for 1GS/s sampling:
A repetitive pulse sequence (CH2) can be displayed if a repetitive triggering
signal (CH1) is available.
CH1 + CH2
CH1 - CH2
XY Plot
INV. CH2
This button appears only in math mode. Toggles between m ath mode and
normal mode. (Not for PCS100 / K8031)
Auto Set
Automatic setup for the Volts/div, Time/div, and Trigger level to produce a
stable waveform of usable size. Trigger will be set on if the wave amplitude
on the screen is more then 0.5 division.
The signal should be repetitive for proper auto set function: Amplitude 5mV to
100V, frequency above 50Hz and duty cycle greater than 10%.

PCS500 / PCS100 / K8031
15
Spectrum analyzer mode (FFT)
FREQ. RANGE
Sets the frequency range of the display. It is necessary to slide the screen
using X-POSITION in order to see the full range.
LOG/LIN
To display the frequency on a linear or logarithmic scale.
ZOOM x1, x2, x4, x8
In order to expand the screen X1, X2, X4 or X8

PCS500 / PCS100 / K8031
16
Menu Options
(some options depend on selected module)
File Menu
Open Image
Opens an image file and displays it on the screen.
Open DSO Data
Opens and displays the waveform data saved in text format using the Save
DSO Data option.
Save Image
Saves the image to a file in Windows Bitmap (*.BMP) format.
Image is saved in gray scale. Use Edit/Copy menu to get full color images to
other applications.
Save DSO Data
Saves the waveform data in text format. All captured data (4096
points/channel, 4080 points/channel in PCS100 / K8031) is saved.
Save FFT Data
Saves the FFT data in text format. Only the portion of the data displayed on the
screen is saved (250 points, 240 points in PCS100 / K8031).
Note: Default subdirectory (folder) \DATA for image and data files is created
when the program is run the first time.
Print
Prints the image in gray scale. Printer must be connected to other LPT port
than the oscilloscope. You can edit the image caption.
Print Setup
Selects a printer and sets printer options before printing. The available
options depend on the printer you select.
Exit
Terminates the program.
Calibrate & Exit
Makes the oscilloscope calibration, saves the calibration values to the
WinDSO.INI file and terminates the program. This option should be used
when the new oscilloscope has been on for about 1h.
This option performs following operations:
1. The fine adjustment of the trace Y-position (offset) on different
Volt/Div and Time/Div scales.
2. Sets the trace labels (on the left side of the screen) to correspond the
trace GND level.
3. Sets the triggering level mark to correspond the triggering level
(PCS500 only).

PCS500 / PCS100 / K8031
17
Edit Menu
Copy
Copies the image to the Windows' clipboard.
Paste
Pastes the image residing in Windows' clipboard to the screen.
Options Menu
FFT Window
Spectrum analyzer supports five different FFT windows
It is common practice to taper the original signal before calculating the FFT
(Fast Fourier Transformation). This reduces any discontinuities at the edges
of the signal. This is done by multiplying the signal with a suitable window
function.
1.
Rectangular
2.
Bartlett
3.
Hamming
4.
Hanning
5.
Blackman
The Hamming window is set as default at the startup
You can see the effect of different window functions to a frozen spectrum too.
Set the window function used to taper the original signal before calculating the
FFT.
FFT Options
Maximum
Maximum value of each frequency is displayed in Run mode.
This option can be used for recording signal levels as a function of frequency
(Bode plot). You can use spreadsheet to display the frequency response
curve including the frequency labels. On File menu, click Save FFT Data to
export the data to the spreadsheet.
Average
Displays smoothed values in Run mode. Use this option to reduce the noise
level.
Hardware Setup
Select the LPT port address where the hardware is connected
378, 278 or 3BC
You'll find the address either from BIOS setup or from Windows' Device
Manager:
1 Click "System" icon in Control Panel and then the Device Manager tab.
2 Click the plus sign next to the "Ports".
3 Double-click "Printer Port (LPTx)".
4 Click the Resources tab to see the Input/Output address.

PCS500 / PCS100 / K8031
18
Colors
Select the color for various items on the waveform display.
To change the color of an item, click the corresponding button. This will open
a dialog in which you can select the new color.
Full color selection is possible only if True Color (24 bit) palette is used.
There are restrictions in the color combinations with other palettes.
Click Default Colors button to resets all colors to the default settings.
View
RMS value
When this option is selected the true RMS AC value of the signal is displayed
on the screen.
If CH1 is on the RMS value of CH1 is shown
If CH1 is off the RMS value of CH2 is shown
dBm value
Displays AC dBm value of the signal
If CH1 is on the dBm value of CH1 is s hown
If CH1 is off the dBm value of CH2 is shown
0 dBm = 1 milliwatt at 600 ohms (0.775 Vrms)
Markers in oscilloscope mode
Two horizontal markers for measuring voltage
Two vertical markers for measuring time and frequency
Note: The voltage markers give preference to channel Ch1 if both channels
are being used.
Markers in spectrum analyzer mode
Marker function for absolute and relative voltage measurement is provided.
The absolute voltage level in dBV or the voltage difference in decibels (dB) can
be measured.
One vertical marker is provided for the frequency measurement.
Moving the markers
Place the mouse pointer over a dashed marker line.
Press and hold the left mouse button. The marker line turns solid.
Drag the marker to the appropriate position
Bright Grid
Brightens the signal grid on the screen.

PCS500 / PCS100 / K8031
19
Math Menu (not for PCS100 / K8031)
The result of mathematical operation of channel 1 and 2 is displayed.
One of the following functions can be selected:
Ch1 + Ch2
Ch1 - Ch2
XY Plot
Invert Ch2
XY Plot:
Ch1 data is displayed on Y-axis
Ch2 data is displayed on X axis
A button is provided to toggle between Math mode and Normal mode.
Help Menu
Contents
Displays the help file (English only)
Installing Windows NT4 driver
Gives instructions for Windows NT and Windows 2000 users
About
Displays information of the program version
PCS500 / PCS100 / K8031
20
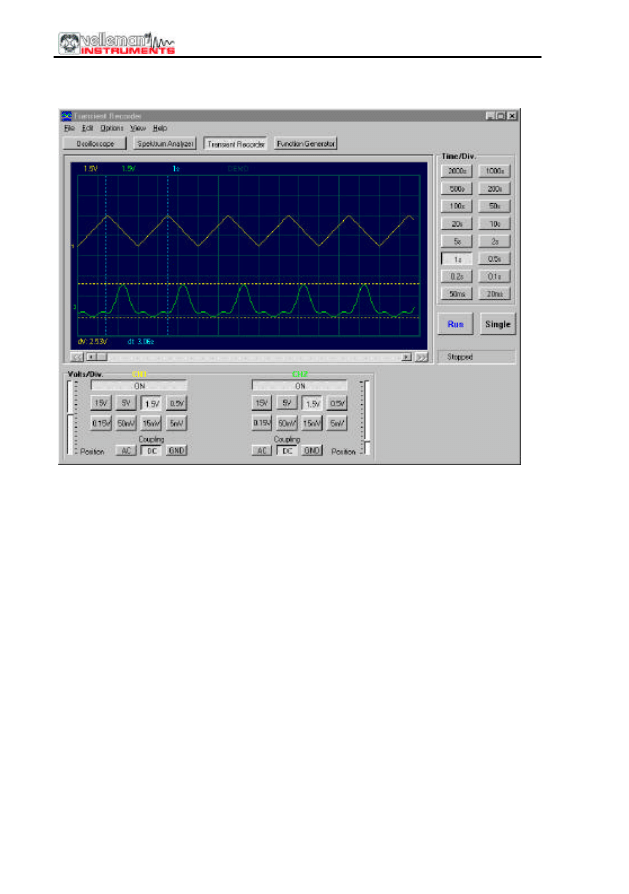
TRANSIENT SIGNAL RECORDER "REC"
PCS500 screenshot (1CH only for PCS100 / K8031)
PURPOSE
If short one time changes are to be recorded, then it is best to use a transient
recorder. This device can best be compared to a tape recorder, but is used for
recording electrical signals. The signal recorder is nothing other than an
oscilloscope with a very slow time base. The advantage of a digital recorder is
that the signals can be s tored on disk, so that they can be used for analysis at
a later time. By making the timescale very slow, and by selecting the automatic
save function, signals can be checked for up to 1 year, and on the two
channels simultaneously. By using the markers it can also be accurately
determined when a change has occurred and how large the change is.

PCS500 / PCS100 / K8031
21
SOFTWARE CONTROLS
Remark:
•
Due to software upgrades, the actual menus can differ from the ones
described in this manual, please also refer to the Help file (English o nly)
•
PCS100 / K8031 has only one channel and no external trigger input
VOLTS/DIV
Selected value indicates the peak-to-peak voltage required to produce a peak-
to-peak deflection of one major division on the screen.
CH1, CH2
Buttons turn the display of the trace ON or OFF. To get the cursor
measurements of CH2 voltage values switch CH1 off.
COUPLING
AC: the input signal is capacitive coupled to the input amplifier/attenuator. Only
the AC components are measured.
GND: (not for K8031) the input signal is b roken and the input
amplifier/attenuator is connected to earth. Use this position for selecting a
reference point on the display.
DC: the input signal is directly connected to the input amplifier/attenuator. Both
AC and DC voltage are measured.
TIME/DIV
Selects the time setting for the beam to sweep one major division on the
screen.
Selection of TIME/DIV is possible to zoom in on the frozen waveform display.
RUN
Selects recurrent display update mode (RUN). Pressing the button again
freezes the display.
SINGLE
When button is depressed refreshment of the display takes place only once.
X-POSITION SCROLLBAR (Below the waveform display)
Positions the trace horizontally on the screen.

PCS500 / PCS100 / K8031
22
Menu Options
File Menu
Note: Default subdirectory (folder) /DATA for image and data files is created
when program is run the first time.
Open Image
Opens an image file and displays it on the screen.
Open Data
Opens and displays the waveform data saved in text format using the Save
Data option.
Save Image
Saves the image to a file in Windows Bitmap (*.BMP) format.
Image is saved in gray scale. Use Edit/Copy to get full color images to other
applications.
Save Data
Saves the recorded data in text format to a file.
AutoSave Data
Saves all next screens of data in text form at to a file.
The AutoSave function will be activated after the Run button is pressed.
The AutoSave function will be finished after the Run button is pressed again.
Note: Every screen saved takes about 20kB of disk space
Print
Prints the image.
Printer must be connected to other LPT port than the oscilloscope.
You can edit the image caption.
Print Setup
Selects a printer and sets printer options before printing. The available
options depend on the printer you select.
Exit
Terminates the program.
Edit Menu
Copy
Copies the image to the Windows' clipboard.
Paste
Pastes the image residing in Windows' clipboard to the screen

PCS500 / PCS100 / K8031
23
View Menu
Markers
Two horizontal markers for measuring voltage
Note: The voltage markers give preference to channel Ch1 if both channels
are being used.
Two vertical markers for measuring time
Marker function for absolute and relative time measurement is provided.
If V & t markers are selected the absolute time of the marker position is
displayed.
If V & dt markers are selected the time difference between the markers is
displayed.
Moving the markers
Place the mouse pointer over a dashed marker line.
Press and hold the left mouse button. The marker line turns solid.
Drag the marker to the appropriate position
Bright Grid
Brightens the blue grid on the screen.
Help Menu
Contents
Displays the help file (English only)
About
Displays information of the program version

PCS500 / PCS100 / K8031
24
Troubleshooting
No signal on the oscilloscope display
No communication with the computer (check that the cable is connected to
parallel printer port (LPT)
Check the printer port setting in the BIOS SETUP of the computer. Select
standard parallel port mode (SPP), also named "compatible" mode or
"Centronics" mode.
•
Program is not in RUN ON
•
The channel concerned is OFF
•
TIME/DIV switch is in the wrong setting.
•
TRIGGER is ON, set TRIGGER OFF
•
The unit input selection is at GND.
•
Y position is wrongly adjusted.
•
Input amplitude is too large, adjust VOLTS/DIV setting.
If the above tips have no effect, then test on a different computer or replace the
printer port card.
The voltage readout does not correspond to the actual value.
•
The probe is in the X10 position
•
Note, the RMS readout measures only the AC voltage.
•
The oscilloscope must be calibrated.
Errors in Recorder time scale
When recording at short time base (< 2s/div) the sampling interval is 10ms.
This is possible only on fast computers. Anyhow, do not execute other
applications during the recording process; it may influence the measuring
time scale.
The time base of the measurements is generated by the internal timer of the
computer. This timer can be put on hold by other processes on the computer.
This can cause a deviation in the time measurement.
To ensure the precision of the time measurement at short time base:
•
Use a fast computer: 486 or Pentium.
•
Do not run other applications when recording
•
Prevent your computer from going into power saving mode

PCS500 / PCS100 / K8031
25
WARRANTY
This product is guaranteed against defects in components and construction from the
moment it is purchased and for a period of ONE YEAR starting from the date of sale.
This guarantee is only valid if the unit is submitted together with the original purchase
invoice. VELLEMAN Components limits its responsibility to the reparation of defects or,
as VELLEMAN Components deems necessary, to the replacement or reparation of
defective components. Costs and risks connected to the transport, removal or
placement of the product, or any other costs directly or indirectly connected to the
repair, will not be reimbursed by VELLEMAN Components. VELLEMAN Components will
not be held responsible for any damages caused by the malfunctioning of a unit.
Wyszukiwarka
Podobne podstrony:
Assassins PC Manuel UK
uk ad pokarmowy
MonikiKamica uk éadu moczowego
BUDOWA KOMPUTERA PC
Wybrane choroby nerek i uk adu oddechowego
pc 01s084 085
pc 07s084 087
pc 08s020 027
Czę¶ć ogólna PC wykład 2 podmioty
1510478 8000SRM0988 (06 2005) UK EN
Instrukcja programu PC Suite SonyEricsson
1568204 0700SRM1159 (08 2005) UK EN
Anatomia PC Wydanie VIII
pc 04s044 049
pc 02s076 079
pc 03s038 039
Zaka enia uk adu1, VI rok, VI rok, Pediatria, Pediatria, PEDIATRIA OLA, pediatria IV V, Choroby dzie
więcej podobnych podstron