
Validated immunoassay methods
James F. Brady
Syngenta Crop Protection, Inc., Greensboro, NC, USA
1
Introduction
Analytical methods for agrochemical residues intended for use as tolerance enforce-
ment methods under US Environmental Protection Agency (EPA) guidelines must be
validated according to specific requirements. The EPA has published data require-
ments for residue methods under Section 860.1340, with specifics for methods that
employ chromatographic measurements for the determinative step. In August 1996,
a revision of that section included a statement allowing the use of immunochemical
methods.
1
To date, few immunoassay-based methods have been validated according
to those guidelines and disclosed to the public or have been submitted to the EPA
Office of Pesticide Programs (OPPTS) for use as tolerance enforcement methods.
This article will focus on the development and validation of immunochemical meth-
ods to be used as enforcement methods. This will be accomplished by examining
the theory and practice of enzyme immunoassays and comparing immunoassay- and
chromatography-based methods. The requirements for tolerance enforcement will be
discussed, and examples of immunochemical analytical methods validated according
to these guidelines will illustrate the process. Examples will be drawn from the lit-
erature and from methods developed in this laboratory. Observations on the practical
aspects of immunoassays will also be presented.
2
Enzyme immunoassays
The term ‘immunoassay’ is a generalized description of using antibodies for measure-
ment purposes. In this article, ‘immunoassay’ will refer to a methodology depicted in
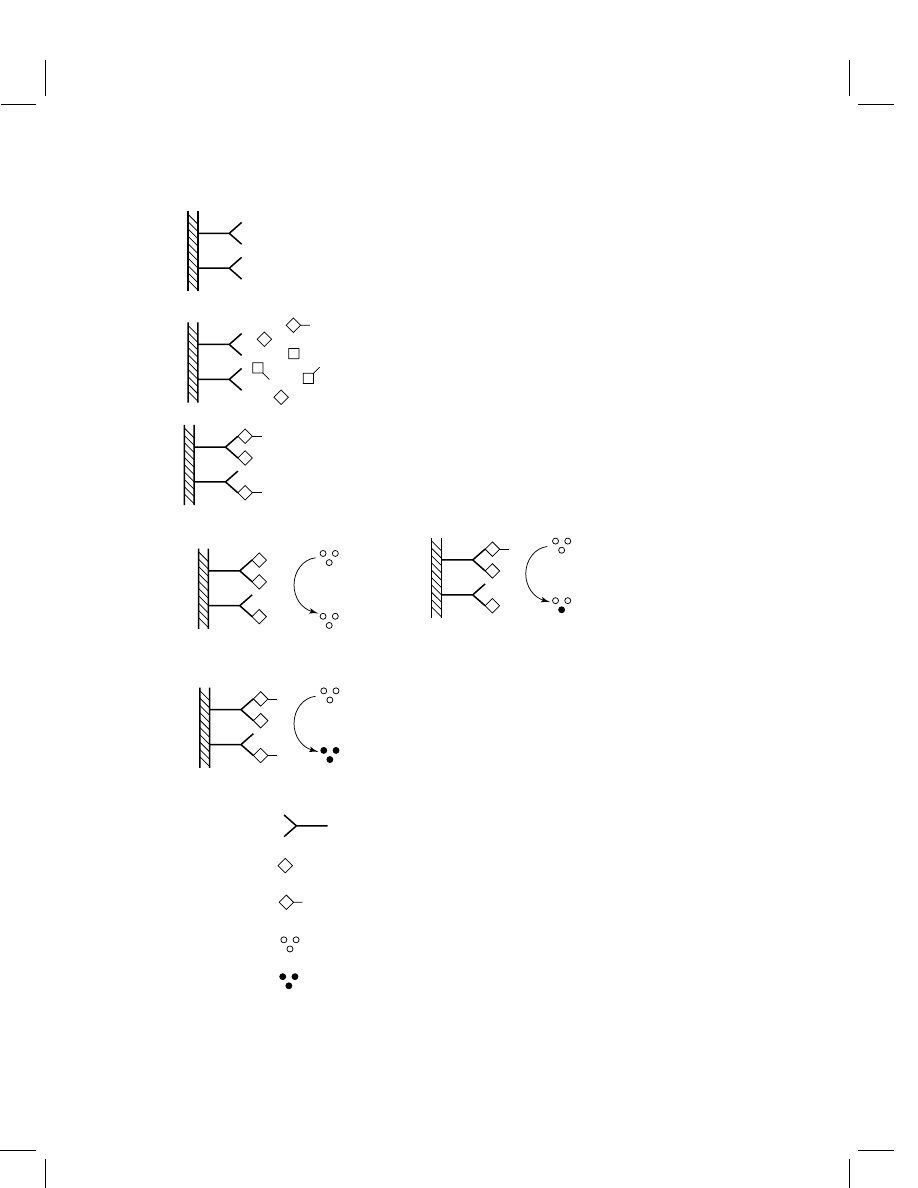
Figure 1 called ‘enzyme immunoassay’ (EIA).
2
In this format, antibodies are coupled
to a solid phase, usually cast from polystyrene, such as a culture tube or the well of a
microtiter plate. The sample and an enzyme conjugated to a derivative of the analyte
of interest are added to the reaction vessel. Analyte in the sample and in the enzyme
conjugate compete for the constant, limited number of antibody binding sites. Bind-
ing of analyte in the sample prevents, or inhibits, the enzyme conjugate from binding.
Hence, this part of the assay is often referred to as the ‘inhibition step’. The reaction
Handbook of Residue Analytical Methods for Agrochemicals.
C
2003 John Wiley & Sons Ltd.
Validated immunoassay methods
715
E
E
E
E
E
E
E
E
1.
2.
3.
4A.
4C.
4B.
E
KEY:
antibody reactive to analyte
analyte
enzyme tracer
enzyme substrate
colored product
Figure 1
Schematic of an enzyme immunoassay. (1, 2) The test solution and enzyme conjugate
are added to a tube or well pre-coated with anti-analyte antibodies. (3) After the inhibition step, the
solid phase is washed, and only antibody-bound material is retained. (4A–C) Colorless substrate is
added and is converted to a visible color in inverse proportion to the amount of analyte in the sample
716
Recent advances in analytical technology, immunoassay and other nonchromatographic methods
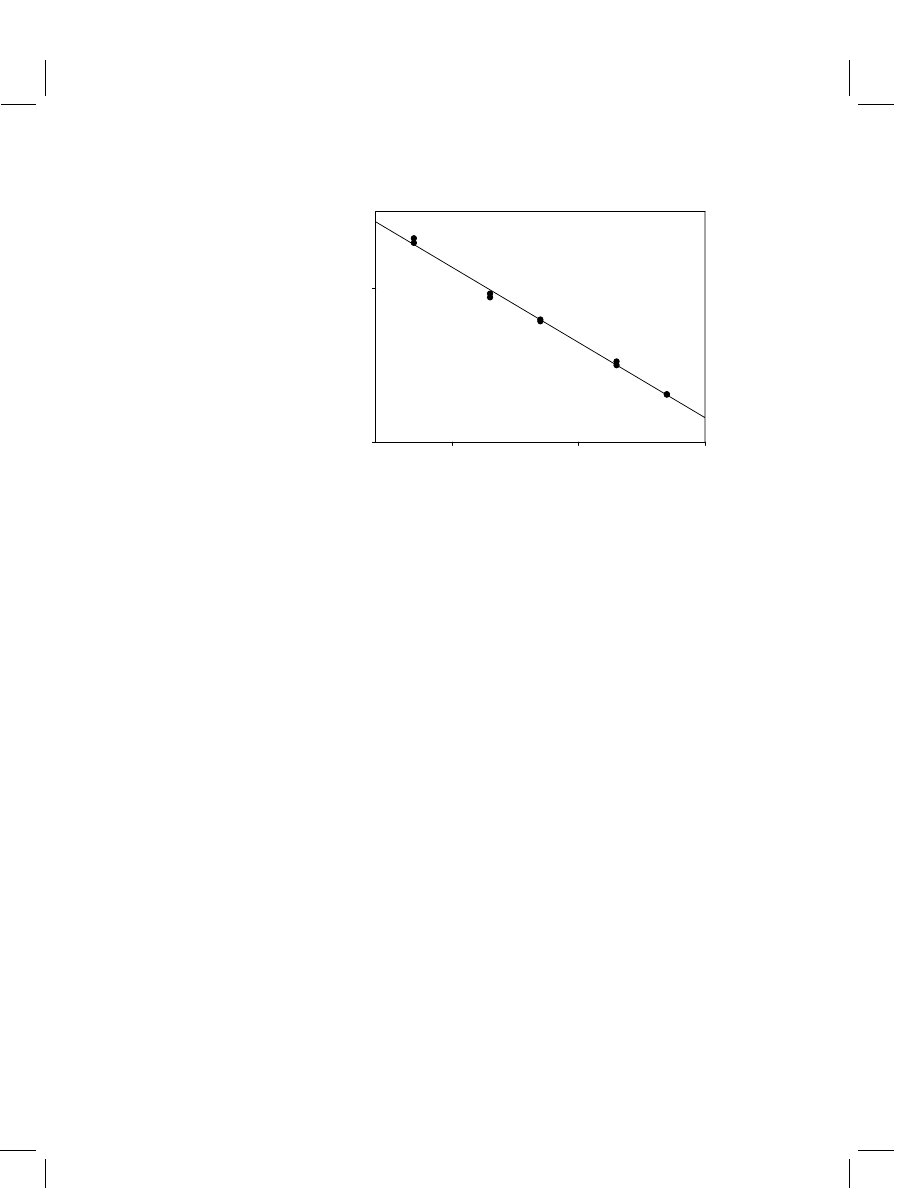
Atrazine (ppb)
0.1
1
10
Absorbance
0
1
Y = -0.490 Log(X) + 0.648
r = -0.998
Figure 2
Typical enzyme immunoassay calibration curve illustrating the inversely proportional
dose–response relationship
vessel is washed, removing all materials not bound to antibodies. Enzyme substrate
is added. Substrate is colorless at the outset but is converted to a colored product by
the bound enzyme. Generation of the colored product is terminated by acidification.
Samples containing a high concentration of analyte bind little enzyme and produce
weakly colored signals; the opposite is true for samples with a low concentration
of analyte. As a consequence, calibration curves are inversely proportional to the
concentration of the analyte (Figure 2).
EIAs are more desirable for the measurement of agrochemicals than enzyme-
linked immunosorbent assays (ELISAs) for several reasons.
3
EIAs are easier to run,
require minimal liquid transfers, and are completed in brief time frames, approxi-
mately 40 min for tube assays to 2.5 h for microtiter plate assays. In contrast, ELISAs
are more complex, have many steps involving transfer of reagents, and require 6–8 h
to complete. Most commercially available immunoassays utilize the EIA format.
2.1
Choice of tube or plate format
The choice of using tubes or plates depends on the expected sample load. If only
a few samples are to be analyzed at one time, the tube format is ideal. Equipment
requirements are minimal and quantitation can be carried out with a visible wavelength
spectrophotometer. An analyst can become proficient with a tube assay after only a few
practice trials, because only single-channel pipets are used to transfer reagents. The
downside is that a single analytical set can accommodate only about a dozen samples,
including controls and recovery samples. In contrast, 40 samples in duplicate can be
analyzed on one microplate. The trade-off lies in a greater degree of skill required by
the analyst and a much greater financial investment to conduct microplate assays. The
analyst must be proficient with multichannel pipets for transferring small volumes
of liquid, usually less than 0.20 mL. Microplates also require a dedicated photometer
and special software. Regardless of the format selected, experience has shown that
Validated immunoassay methods
717
whenever the absorbance data can be processed by commonly available spreadsheet
software, the analyst should do so.
Several observations relative to plate assays should be noted. Antibody binding
kinetics are proportional to temperature, and the long incubations associated with plate
assays make microplates susceptible to variable binding should the room temperature
fluctuate. This has been resolved in this laboratory by performing all incubations in
a covered chamber such as under a cardboard box. Incubations in tube assays are so
brief that temperature changes are not a concern. Performing plate incubations with
shaking has been shown to increase precision of measurement. Finally, automated
plate or strip washers are useful accessories for laboratories conducting analyses in
the plate format.
Regardless of the format selected, samples and standards should always be mixed
throughout an analytical set. In this manner, the first and last tube or well would
contain a standard, with the remaining samples and standards intermixed. This serves
as a check of the linearity of the assay response, because the calibration curve is based
on standards spread throughout the set. Some commercial assays recommend running
all standards prior to the samples. This approach cannot detect changes in pipetting
rate or reagent handling over the entire set and is, therefore, not recommended.
Maintaining a moderate, consistent pipetting rhythm is the best way to ensure that
all samples and standards are treated equally. This is easy to accomplish with tube
assays, because relatively few samples can be analyzed per set. Microtiter plates
present more of a challenge, because up to 96 wells may be utilized at the same time.
One solution developed in this laboratory involves the use of a microtiter plate not
coated with reagent – the reservoir plate.
4
An excess of all samples and standards
is loaded into the reservoir plate. If 0.10 mL is needed for the inhibition step, for
example, 0.15 or 0.20 mL of each solution is added to a pre-determined position in
the reservoir plate; the excess amount simplifies the next pipetting step. The location
of each sample and standard is identified on a plate layout sheet, a ‘map’ of the
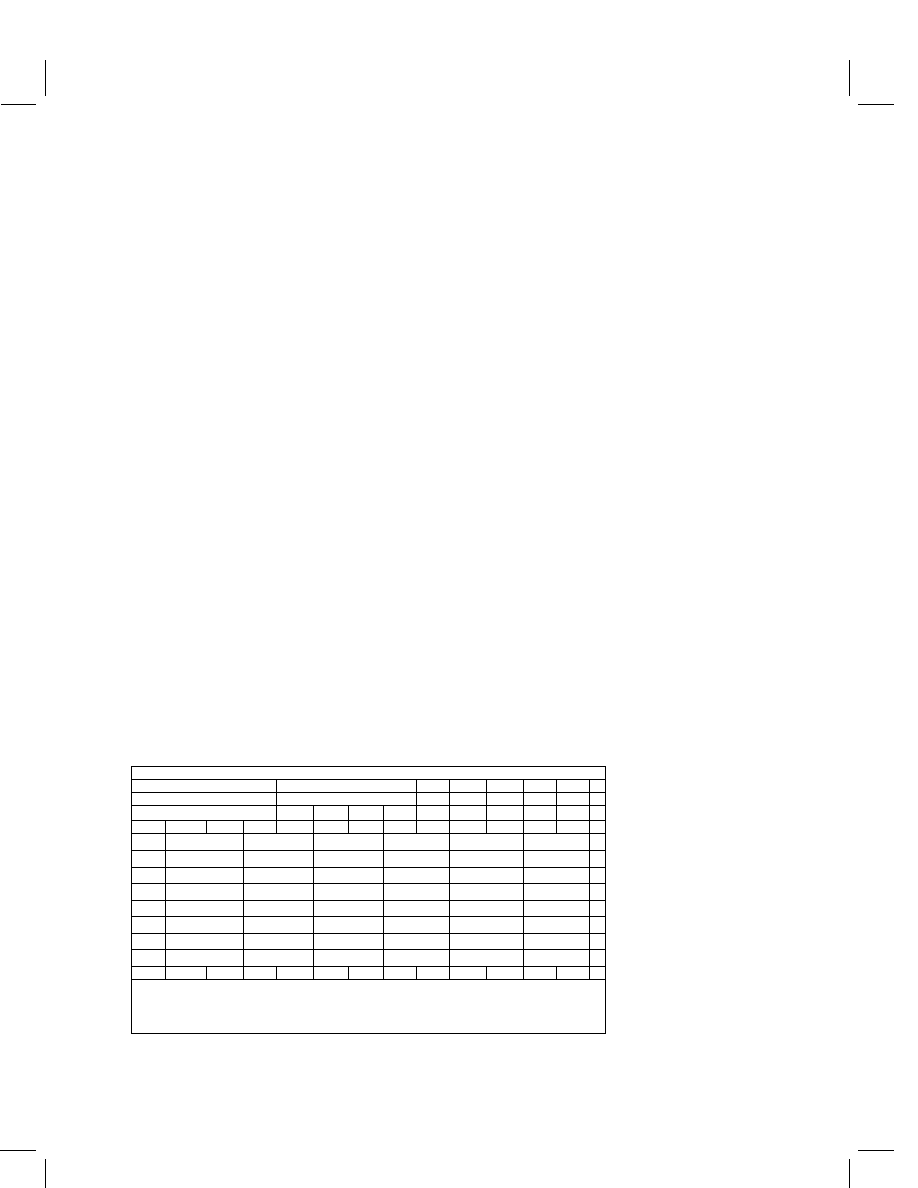
reservoir plate previously completed by the analyst (Figure 3). When the reservoir
Plate Layout Sheet
Plate ID:
Study No.:
Analysis Date:
NB Ref.:
Analyst:
1 2 3 4 5 6 7 8 9 10 11
12
A
0 ppb
A
B
B
C
C
D
D
E
E
F
F
G
G
H
H
1 2 3 4 5 6 7 8 9 10 11
12
Comments
Figure 3
Plate layout sheet

718
Recent advances in analytical technology, immunoassay and other nonchromatographic methods
plate is completed, the analyst simultaneously transfers aliquots from all wells in a
column of eight wells to the corresponding column in the antibody-coated plate using
an eight-channel pipettor. This procedure is carried out across the reservoir plate. The
enzyme conjugate or other reagent is added to the antibody-coated plate in a similar
manner, except that the enzyme conjugate or reagent is pipetted from a commercially
available reservoir specifically made for multichannel pipets. When liquid transfers
are conducted in such a methodical, reproducible fashion, all antibody-coated wells
are exposed to all reagents for the same length of time.
2.2
Calculation of residues
Immunochemists have applied a variety of mathematical models to immunoassay
data.
5
Although curvilinear models such as the four-parameter logistic model
6
accurately describe the sigmoidial character of antibody–antigen interactions, two
problems arise when this model is applied to the quantitation of residues. First,
because the coefficients in the model are derived through a software-driven iterative
process, verifying that the coefficients are correct may be difficult. The inability to
verify that the software is operating properly is problematic from the viewpoint of
Good Laboratory Practice (GLP),
7
which requires confirmation of software output.
Second, the sigmoidial tails of the curve have such a shallow slope that they may
not support a one-to-one relationship between analyte mass and detector response.
Therefore, the analyst should restrict quantitation to the central linear portion of the
curve where such a relationship is maintained. Using a straightforward log-linear plot
(Figure 2) also simplifies the quantitation procedure, because regression packages
are readily available in spreadsheet form, and results can be verified with a hand-held
calculator.
2.3
Comparison with chromatography-based methods
Applying immunoassays to pesticide residue methods can be viewed as simply an
adaptation of ‘classical’ residue technology. Indeed, immunoassay has been likened
to merely a new detection system based on antibody recognition of the analyte. In
essence, the immunochemist patterns the immunoassay-based method on the same set
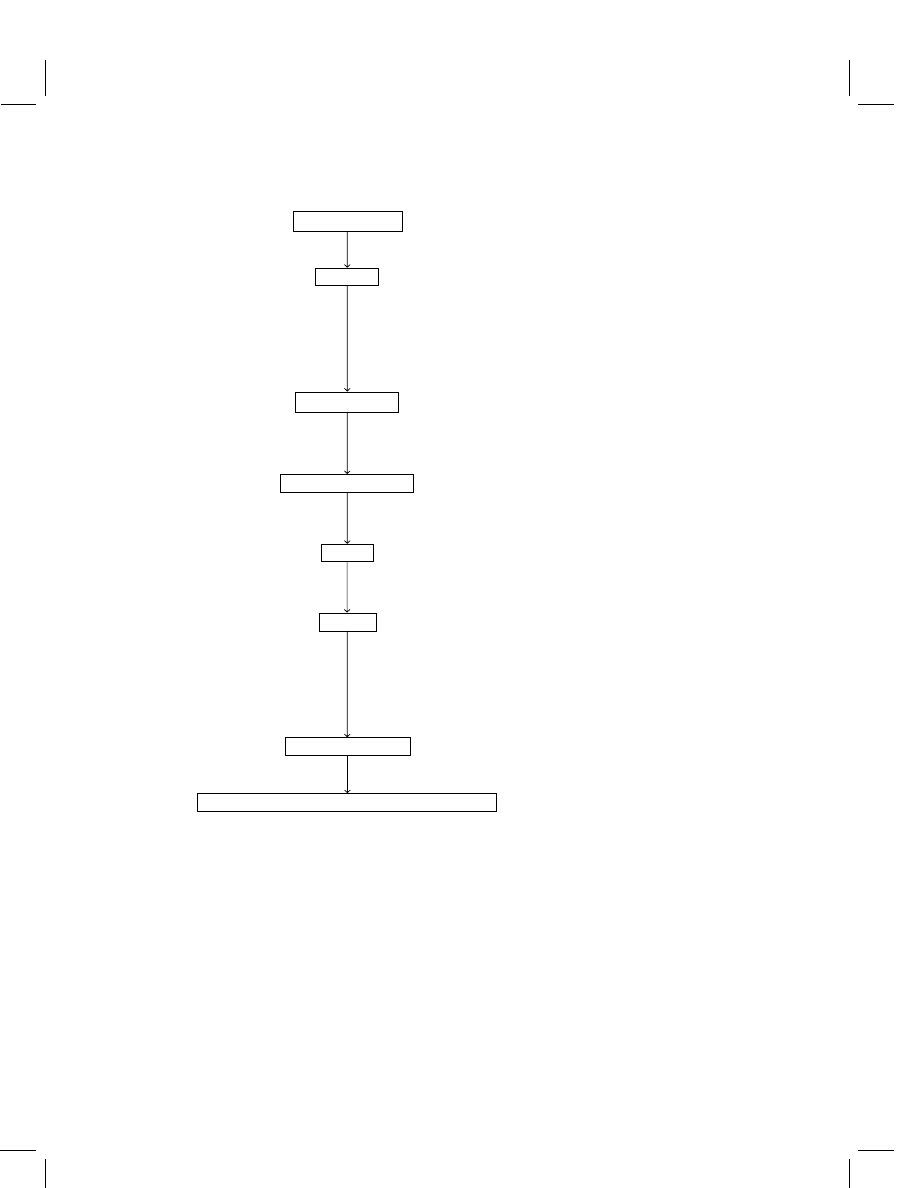
of overall procedures followed in a chromatography-based procedure. A generalized
residue method is depicted in Figure 4 to visualize the process. A sub-sample is taken
for analysis and extracted in an appropriate solvent, and an aliquot of the extract is
prepared, or ‘cleaned up’, for analysis by isolating the analyte from compounds that
would interfere with the measurement step. A fraction of the prepared aliquot is then
subjected to analysis. The kinds of techniques performed at each step are suitable for
most residue methods, regardless of measurement technique. Thus, extraction and
cleanup techniques developed for chromatographic methods are readily transferable
to immunoassay-based methods.
From an empirical viewpoint, the chief difference lies in the size of the aliquot that
must be carried through the procedure. A typical sample size for a chromatographic
method is 20 g. This is extracted, for illustration, in 100 mL of solvent. A volume of
Validated immunoassay methods
719
Sample preparation
Blending, mixing, chopping
Extraction
Homogenization
Reflux
Soxhlet extraction
Ultrasonic disruption
Supercritical fluid extraction
Accelerated solvent extraction
Cleanup of extract
Liquid-liquid partitioning
Solid-phase extraction
Column chromatography
Concentration of extract
Rotoevaporation
Evaporation under nitrogen
Analysis
Immunoassay, GC, HPLC
Detection
Visible wavelength spectrophotometry
Mass selective detection
Nitrogen-phosphorus detection
Electron capture detection
UV detection
Calculation of residues
Determination of sample results from regression function
Figure 4
Flow chart of a typical agrochemical residue analysis
extract equivalent to half that mass (50 mL) is prepared for analysis, and the solvent
is reduced to a few milliliters or less. As little as 2 µL of the concentrated extract may
be injected for gas chromatography (GC), whereas 20–50 µL may be analyzed in
high-performance liquid chromatography (HPLC) procedures. Calibration standards
are typically in the micrograms per milliliter range. In contrast, an immunoassay
method may require only a 1.0 g equiv. of extract, in this case 5 mL, to be cleaned up
for analysis. Instead of reducing the aliquot volume, the extract prepared for analysis
is usually restored to the original volume of the aliquot. A relatively large volume of
extract is analyzed, approximately 100–500 µL, with standards in the nanograms per
milliliter range.

720
Recent advances in analytical technology, immunoassay and other nonchromatographic methods
There are several important differences between these analytical approaches that the
analyst should recognize. First, chromatographic methods generally bring the concen-
trated extract into an organic solvent or organic–aqueous solution immediately prior
to injection; organic solvents are mandated by GC systems, whereas reversed-phase
HPLC columns utilize organic–aqueous solutions. Immunoassays, by comparison,
are aqueous systems and can tolerate only limited amounts of organic solvents, gen-
erally up to 5% acetonitrile or 10% methanol in buffer or water; acetone is generally
avoided, because this solvent precipitates protein. Poorly aqueous-soluble analytes
can be brought into solution by amending buffers with surfactants, such as the Tween
or Triton series (polyoxyethylene ethers), to a final concentration of 0.01 or 0.05%.
Surfactants have also been added to wash solutions for more effective removal of
hydrophobic compounds.
Second, each methodology has its own type of interferences. Interferences in a chro-
matographic system are viewed as compounds that elute near or at the retention time
of the analyte of interest. Sample cleanup is directed at removing these compounds.
In contrast, immunological interferences cause changes, positively or negatively, in
the immunoassay response. These are regarded as specific and nonspecific. In the
first case, compounds other than the desired target molecule are bound by antibodies.
These ‘cross-reactive’ materials are chemicals of a similar size, shape, and charge as
the target, such as simazine or propazine in an analysis for atrazine.
8
Chemicals of like
structure may be difficult to remove from a sample because of their similar chemical
properties. Cross-reactants may also share an immunoreactive moiety in their overall
structure, such as the aromatic ring of alachlor in its ethanesulfonic acid metabolite.
9
On the other hand, co-extractives or sample constituents that affect the assay re-
sponse by some other means are lumped together as ‘nonspecific’ interferences. These
were historically thought to interfere with antibody binding of analyte, but recent
practice has shown that their effect upon the enzyme conjugate bears consideration.
Horseradish peroxidase is frequently used to synthesize enzyme–analyte conjugates
owing to its rapid turnover rate. However, the ubiquitous distribution of peroxidase
isozymes in plants and animals suggests that molecules that control peroxidase activ-
ity are also widely distributed. The method developer should, therefore, be aware of
the potential alteration of enzyme activity due to co-extraction of such compounds.
Cinnamic acid derivatives,
10
conjugated linoleic acid,
11
d-mannose,
12
salicylic acid,
13
ascorbic acid,
14
and extracts of aged soybean seeds
15
have been cited as responsible
for peroxidase inhibition. Khaziyev and Gul’ko
16
also found that humic acid inhibited
peroxidase activity; humic and fulvic acids may be removed by passing an extract
through strong anion-exchange solid-phase extraction (SPE) cartridges if the chem-
istry of the target molecule permits. Potential analytes carbaryl, dicofol, and dichlone
were observed to stimulate peroxidase activity, whereas fenitrothion and dimethoate
had a negative impact.
17
A. Krotsky (personal communication) found that aqueous
extracts of control root crops gave strongly positive immunoassay responses. The
problematic compounds were removed by back-partitioning the extract into methy-
lene chloride. This case emphasizes the need to purify extracts of each substrate to
the extent that control samples yield immunoassay responses similar to that of the
blank, or zero standard.
Finally, a more subtle distinction lies in the manner in which the measure-
ment step is carried out. This is accomplished in chromatographic methods by the

Validated immunoassay methods
721
separation of sample components until the analyte of interest can be quantified in
the absence of co-eluting peaks. No such separation occurs during an immunoassay.
The immunological reagents are exposed to all constituents of the final extract during
the inhibition step. In this sense, certain substrates may require more extensive cleanup
for immunochemical analysis than for a chromatographic analysis. As stated above,
the goal of the method developer should be to achieve similar immunoassay responses
from the control substrate and the blank. Only in this manner can the analyst be assured
that interferences associated with a given substrate have been adequately addressed.
Investigators have sometimes dealt with interferences by dilution or incorporating
background interferences into the standards by preparing them in control extract.
Dilution serves only to reduce the concentration of potential interferences, not re-
move them. Dilution also results in a corresponding decrease in assay sensitivity.
Lucas et al.,
18
for example, diluted human urine 1 : 10 in buffer to reduce interfering
substances in an analysis for atrazine mercapturate. While this step made immuno-
analysis feasible, the dilution resulted in a 10-fold loss of sensitivity. In this laboratory,
maintaining a low limit of quantitation (LOQ) (the lowest level of fortification for
which recoveries in the range 70–120% can be obtained) was important. Organic
extracts of urine were chromatographed on a diol SPE cartridge to achieve this goal.
Concentration of the SPE eluate retained a 1.0 ng mL
−1
LOQ and did not appreciably
slow sample processing.
19
Workers have also added extracts of blank substrate to
standard solutions to correct for substrate-specific interferences. Control substrate,
however, may not always be available. Consequently, EPA requirements prohibit the
use of control substrate as a means to address interferences in enforcement methods.
1
3
Requirements for validating a residue method
To understand how immunoassay-based analytical methods can be constructed to
comply with tolerance enforcement requirements, a brief examination of those re-
quirements is in order. This discussion is not intended to be comprehensive but to
highlight aspects of special significance to immunoassay method development. The
reader is urged to consult the literature
1
,20,21
for further details.
A brief summary of EPA method requirements for tolerance enforcement methods
is given in Table 1. Taken in total, these requirements ensure that the means to conduct
the method are available to laboratories and that experimental evidence to establish
method performance, on a substrate-by-substrate basis, is generated prior to analysis
of samples and as part of each analytical set. Thus, an analyst who must generate data
to support method performance in his or her hands can obtain whatever is required to
reproduce the method.
These requirements have special implications with regard to immunoassay meth-
ods. First, the lack of commercial availability of reagents precludes preparing
antibody-coated tubes or plates on-site, which may require knowledge of special
skills. Commercial availability also ensures the analyst access to a reproducibly manu-
factured product. Therefore, the method must be based on an immunoassay that is a
commercial product. Method developers may choose to introduce an in-house assay
to the marketplace by partnering with a manufacturer, although this approach is costly
and time-consuming.

722
Recent advances in analytical technology, immunoassay and other nonchromatographic methods
Table 1
Summary of US EPA method requirements
a
1
Method described in a stepwise fashion
b
2
Commercial availability of reagents and equipment
3
Method must not be subject to substrate-related interferences (not require the use of blank
substrate to correct for substrate-specific interferences)
4
Establish LOD and LOQ for each substrate
5
Control and recovery data for all substrates (blank substrate and blank substrate-fortified
to LOQ)
6
Substrate/sub-sample must be fortified, not the extract
7
Recoveries of fortified samples in the range 70–120%
8
Specificity
9
Enforcement method to undergo independent laboratory validation study
a
The reader should consult US EPA
1
for a complete description of the method requirements.
b
A detailed outline of a written analytical method can be found in Mihaliak and Berberich.
20
Second, the specificity of the method, or reactivity of the antibodies to other ana-
lytes that might be present in samples, must be thoroughly investigated. The analyst
should determine what other agrochemicals might be present in a given substrate.
These chemicals should be screened to ensure that the immunoassay does not generate
false positive results. In most cases, this is likely to be a mechanical exercise given
the selective nature of antibody binding. However, agrochemicals are often varia-
tions on common chemical themes such as the sulfonylurea (SU) class of herbicides.
Development of an assay against one member of this class should include exam-
ination of antibody recognition of other SUs and their metabolites. For example,
an immunoassay for triasulfuron was screened against 19 related parent SUs and
degradates; only trace reactivity to three other SUs was observed.
4
As a result, the
presence of other SUs in samples analyzed by the triasulfuron immunoassay is not a
concern.
Third, the bulk of the items in Table 1 address method performance. These require-
ments must be satisfied on a substrate-by-substrate basis to address substrate-specific
interferences. As discussed above, interferences are best dealt with by application
of conventional sample preparation techniques; use of blank substrate to account
for background interferences is not permitted. The analyst must establish a limit of
detection (LOD), the lowest standard concentration that yields a signal that can be
differentiated from background, and an LOQ (the reader is referred to Brady
5
for a
discussion of different techniques used to determine the LOD for immunoassays).
For example, analysis of a variety of corn fractions requires the generation of LOD
and LOQ data for each fraction. Procedural recoveries must accompany each analyt-
ical set and be based on fresh fortification of substrate prior to extraction. Recovery
samples serve to confirm that the extraction and cleanup procedures were conducted
correctly for all samples in each set of analyses. Carrying control substrate through
the analytical procedure is good practice if practicable.
Lastly, a laboratory not involved in the development process must validate the
method. The independent laboratory validation study, or ruggedness trial, ensures
that analysts unfamiliar with the method can successfully perform the method. The
method developer should, therefore, strive to make all procedures as straightforward
as possible to aid reproducibility of the method.

Validated immunoassay methods
723
An additional requirement not noted in Table 1 is compliance with GLP.
7
These
practices establish a paper trail for all procedures involved in the determination of
residues. With regard to immunoassays, GLPs require calibration of measurement
devices such as adjustable pipettors and dedicated spectrophotometers. Computer
software output, as noted above, must be verified prior to use. This process can be
simplified by limiting the application of specialized software to the operation of an
instrument and carrying out the residue calculations in a broadly available spreadsheet
such as Excel. On a positive note, in recent years, the software accompanying most
microtiter plate readers has become generally easier to use and usually incorporates
internal spreadsheets that are compatible with external systems.
3.1
Examples of validated immunoassay methods
The following methods serve as typical examples of immunoassay-based analytical
methods applied to biomonitoring, environmental, and crop tissue analyses. Each
method utilized a commercially available immunoassay kit that was combined with
sample extraction and cleanup steps as part of an overall residue method. These
methods can serve as models for resolution of similar problems.
Atrazine
mercapurate
[2-(
L
-cysteine-N -acetyl)-4-(ethylamino)-6-(isopropyla-
mino)-s-triazine], a metabolite of atrazine in humans, was measured in urine as
part of a study to assess the exposure of pesticide applicators and mixer/loaders
to atrazine.
19
Aliquots (1.0-mL) were taken from urine samples collected at each
void over a prescribed time period. Sodium chloride and HCl were added to the
sample prior to liquid–liquid extraction with a solution of methylene chloride and
ethyl acetate. The sample was extracted by vortex mixing and centrifugation to
separate the phases. The organic layer was set aside, and the extraction was repeated
twice. The combined organic fractions were dried over sodium sulfate and hexane.
The dry organic extract was passed over a diol SPE column (Waters Milford, MA,
USA), which retained the analyte. The analyte was eluted with alkaline ethanol. The
eluate was evaporated to dryness and re-constituted in Tris–HCl buffer; duplicate
aliquots of the buffered eluate were analyzed. The method utilized an EnviroGard
atrazine plate kit (Strategic Diagnostics, Newark, DE, USA) designed to detect
parent atrazine. The substantial cross-reactivity to the mercapturate formed the basis
of the immunoassay measurement. The antibodies were more than four times as
reactive to atrazine than to the mercapturate, but the diol cleanup step separated
the polar degradation product from the nonpolar parent molecule. Measurements
by GC failed to detect the parent molecule. Reactivity to the mercapturates of the
chlorodegradates of atrazine was minimal. The method had an LOD of 0.50 ng mL
−1
and an LOQ of 1.0 ng mL
−1
. Procedural recoveries ranged from 86 to 112%.
A second example of a biomonitoring method is an analysis for atrazine in large-
mouth bass plasma (Syngenta Crop Protection, unpublished data, 2002). This study
presented the challenge of dealing with extremely small sample sizes, often less than
30 µL in volume. Aliquots of each sample, varying from 5 to 30 µL, were extracted
directly on phenyl SPE cartridges (AnSys Technologies, Lake Forest, CA, USA).
After dilution with water, the sample was passed through the cartridge. Atrazine

724
Recent advances in analytical technology, immunoassay and other nonchromatographic methods
residues were eluted in methylene chloride. The eluate was evaporated to dryness
under nitrogen, and the residue was dissolved in water. Duplicate aliquots of the
aqueous solution were analyzed. The method used the Beacon atrazine plate kit
(Beacon Analytical Systems, Portland, ME, USA) that has a range of measurement of
0.05–5.0 ng mL
−1
. As a result, the method LOD was 0.05 ng mL
−1
. The LOQ was
established at 0.10 ng mL
−1
, and procedural recoveries averaged 95%. Cross-
reactivity to other analytes was not a concern, because the samples were collected
from fish exposed to atrazine in a controlled study.
An immunoassay-based method for the SU herbicide triasulfuron in soil and water
is representative of a typical environmental method.
4
The EnviroGard triasulfuron
plate kit (Strategic Diagnostics) was utilized for the determinative step. This assay sel-
ectively recognized triasulfuron among a variety of other SUs and their metabolites.
Water and soil samples were collected from Kansas and North Dakota study sites,
respectively. Water samples were analyzed directly without extraction. Soil samples
were extracted in a methanol–phosphate buffer solution by vortex mixing and sonica-
tion. The extract was centrifuged, and a 1.0 g-equiv. of the supernatant was added to a
C
8
SPE cartridge (Varian Sample Preparation Products, Harbor City, CA, USA). The
extract was made acidic to reduce the water solubility of the analyte, which was re-
tained on the column. Residues were eluted in methylene chloride, and the eluate was
reduced to dryness. The residue was dissolved in a Tris–HCl buffer for immunoas-
say analysis. The immunoassay had an LOD of 0.05 ng mL
−1
. The LOQ for water
and soil samples was 0.05 and 0.10 ng mL
−1
, respectively. Results of the immunoas-
say analyses compared favorably with chromatographic analyses of water (HPLC)
and soil samples [high-performance liquid chromatography/mass spectrometry
(HPLC/MS)].
The only published immunoassay method submitted to date to EPA OPPTS as an
enforcement method for a range of substrates (water, sediment, crops, processed crop
fractions, and animal tissues) is the spinosad method, developed by Young et al.
21
This
method uses the spinosad RaPID Assay (Strategic Diagnostics) for determination of
total spinosad residues (TSR). This discussion will be limited to crop and animal
tissues, because the water and soil analyses are analogous to the triasulfuron method.
The extraction, cleanup, and method parameters are summarized in Table 2.
Samples are extracted in acetonitrile or acetonitrile–water. The extracts are filtered
or diluted prior to assay of beef tissues or milk. Extracts containing high concentrations
of carbohydrates, such as apples, sorghum, and citrus produce, are passed through
cyclohexyl SPE cartridges to remove the sugars. Residues in sorghum and apples are
partitioned into dichloromethane and transferred into acetonitrile–water prior to SPE
cleanup. Crop tissues containing high amounts of chlorophyll, including spinach and
lettuce, undergo a novel treatment: sodium hypochlorite is added to these extracts
to bleach out the so-called ‘green material’. This is a unique contribution to cleanup
procedures that should see wide application to a variety of crop tissues.
These authors noted the potential for the assay to underestimate the concentration
of TSR due to decreased binding of metabolites relative to parent spinosad. How-
ever, the major residue found was parent spinosad, so underestimation of residues is
not likely to be problematic. Overall, this method was validated in 34 matrices and
showed excellent agreement with results obtained with a high-performance liquid
chromatography/ultraviolet detection (HPLC/UV) method.
22

Validated immunoassay methods
725
Table 2
Spinosad method summary
Extraction
LOD
LOQ
Substrate
Sub-sample (g)
Solvent
a
Technique
Cleanup
(
µ
g mL
−1
)
(
µ
g mL
−1
)
Beef tissue
20
ACN–H
2
O
Homogenization
Dilution
0.003
0.01
(4 : 1)
Reflux
Filtration
Evaporation
Milk
5.0
ACN
Shaking
Dilution
0.003
0.01
Evaporation
Apples, sorghum
5.0
ACN–H
2
O
Homogenization
Liquid–liquid
0.003
0.01
(4 : 1)
Shaking
partitioning with
Centrifugation
dichloromethane
Evaporation
Cyclohexyl SPE
b
Citrus
5.0
ACN–H
2
O
Homogenization
Cyclohexyl SPE
b
0.003
0.01
(4 : 1)
Shaking
Centrifugation
Other crops
5.0
ACN–H
2
O
Homogenization
Treatment with
0.003
0.01
(4 : 1)
Shaking
sodium
Centrifugation
hypochlorite
c
a
ACN
= acetonitrile.
b
Cyclohexyl SPE cleanup applied to citrus and sorghum samples only.
c
Added to extracts of mustard greens, celery, head lettuce, leaf lettuce, spinach, and tobacco only.
4
Conclusion
This article describes the theory behind enzyme immunoassays and the formats in
which commercially available assays are constructed. Some observations pertinent to
microtiter plate assays were presented. The manner by which data reduction is carried
out was discussed, and comparisons with chromatography-based analytical methods
were made. Interferences specific to immunoassays and suggestions to ameliorate
their effects were presented. The requirements for validating a method according to
US EPA guidelines were outlined. Finally, examples of immunoassay-based methods
validated according to these guidelines for water, soil, biomonitoring, animal tissues,
and crop tissues were discussed. It is hoped that this article will provide investigators
with a real-world foundation upon which to build immunoassay-based methodologies
for agrochemicals.
References
1. US EPA, Residue Chemistry Test Guidelines, OPPTS 860.1340, Residue Analytical Method,
EPA 712-C-96-174, Office of Prevention, Pesticides and Toxic Substances, Environmental Pro-
tection Agency, Washington, DC (1996).
2. B.K. Van Weemen and A.H.W.M. Schuurs, FEBS Lett., 24, 77 (1972).
3. E. Engvall and P. Perlmann, Immunochemistry, 8, 871 (1971).
4. J. Brady, J. Turner, and D. Skinner, J. Agric. Food Chem., 43, 2542 (1995).

726
Recent advances in analytical technology, immunoassay and other nonchromatographic methods
5. J.F. Brady, ACS Symp. Ser., 586, 266 (1995).
6. D. Robard, in ‘Ligand Assay,’ ed. J. Langan and J.J. Clapp, Mason Publishing, New York,
pp. 45–101 (1981).
7. US EPA, FIFRA, Good Laboratory Practice Standards, Final Rule (40 CFR Part 160 [OPP-
300165A; FRL-3518-2]) RIN 2070-AB68, Environmental Protection Agency, Washington, DC
(1989).
8. J. Brady, D. Tierney, J. McFarland, and M. Cheung, J. Am. Water Works Assoc., 93, 107 (2001).
9. D. Baker, R. Bushway, S. Adams, and C. Macomber, Environ. Sci. Technol., 27, 562 (1993).
10. R. Volpert, W. Osswald, and E.F. Elstner, Phytochemistry, 38, 19 (1995).
11. H. Cantwell, R. Devery, M. O’Shea, and C. Stanton, Lipids, 34, 833 (1999).
12. M. Soeiro, M. Paiva, H. Barbosa, M. Meirelles, and T. Araujo-Jorge, Cell Struct. Funct., 24, 139
(1999).
13. M. Ruffer, B. Steipe, and M. Zenk, FEBS Lett., 377, 175 (1995).
14. U. Takahama, Plant Cell Physiol., 34, 809 (1993).
15. J. Sung and C. Chiu, Plant Sci. Limerick, 110(1), 45 (1995).
16. F.-Kh. Khaziyev and A. Ye. Gul’ko, Sov. Soil Sci., 22(4), 27 (1990).
17. L. Blagonravova and G. Nilov, Khim. Sel’sk. Khoz., 14(11), 41 (1976).
18. A.D. Lucas, A.D. Jones, M.H. Goodrow, S.G. Saiz, C. Blewett, J.N. Seiber, and B.D. Hammock,
Chem. Res. Toxicol., 6, 107 (1993).
19. J. Brady, J. Turner, M. Cheung, J. Kelly, D. King, and A. Alemanni, ACS Symp. Ser., 683, 131
(1998).
20. C. Mihaliak and S. Berberich, ACS Symp. Ser., 586, 288 (1995).
21. D. Young, C. Mihaliak, S. West, K. Hanselman, R. Collins, A. Phillips, and C. Robb, J. Agric.
Food Chem., 48, 5146 (2000).
22. S. West, L.-T. Yeh, L. Turner, D. Schwedler, A. Thomas, and D. Duebelbeis, J. Agric. Food
Chem., 48, 5131 (2000).
Document Outline
- Front Matter
- Table of Contents
- Volume I
- Volume II
- Recent Advances in Analytical Technology, Immunoassay and Other Nonchromatographic Methods
- Regulatory Considerations for Environmental Analytical Methods for Environmental Fate and Water Quality Impact Assessments of Agrochemicals
- Immunoassay, Biosensors and Other Nonchromatographic Methods
- Immunologically Based Assays for Pesticide/Veterinary Medicine Residues in Animal Products
- Validated Immunoassay Methods
- Advances in Methods for Pesticide Residues in Food
- Overview of Analytical Technologies Available to Regulatory Laboratories for the Determination of Pesticide Residues
- Best Practices in the Generation and Analyses of Residues in Environmental Samples
- Compound Class
- Individual Compounds
- Index
Wyszukiwarka
Podobne podstrony:
B 05d Msza w ciagu dnia
05d STENOZA LEDŹWIOWA I KREGOZMYK
23 05d
B 05d Msza w ciagu dnia
05d Górnośląskie koleje wąskotorowe 160 lecie
91942 08w
91942 abb
91942 08q
91942 04m
91942 03d
91942 01e
91942 08j
91942 05b
91942 08p
91942 04b
91942 08u
91942 06c
91942 04i
91942 01c
więcej podobnych podstron