Your first choice for antibodies!
Introduction to
Flow Cytometry
By Misha Rahman, Ph.D.
Technical advisors
Andy Lane, Ph.D.
Angie Swindell, M.Sc.
Sarah Bartram, B.Sc.
Principles
Data analysis
Protocols
Troubleshooting
Flow Cytometry ipl.qxd 11/12/06 11:14 Page i

Flow Cytometry ipl.qxd 11/12/06 11:14 Page ii
Introduction
to Flow Cytometry
By Misha Rahman, Ph.D.
Technical advisors
Andy Lane, Ph.D.
Angie Swindell, M.Sc.
Sarah Bartram, B.Sc.
Principles
Data analysis
Protocols
Troubleshooting
Flow Cytometry ipl.qxd 11/12/06 11:14 Page iii

Preface
How can I explain what flow cytometry is to someone that knows nothing
about it? Well, imagine it to be a lot like visiting a supermarket. You choose
the goods you want and take them to the cashier. Usually you have to pile
them onto a conveyor. The clerk picks up one item at a time and interrogates
it with a laser to read the barcode. Once identified and if sense prevails,
similar goods are collected together e.g. fruit and vegetables go into one
shopping bag and household goods into another. Now picture in your mind
the whole process automated; replace shopping with biological cells; and
substitute the barcode with cellular markers – welcome to the world of flow
cytometry and cell sorting!
We aim to give you a basic overview of all the important facets of flow
cytometry without delving too deeply into the complex mathematics and
physics behind it all. For that there are other books (some recommended at
the back). Instead, we present a guide that will be invaluable to beginners of
flow cytometry or act as a fact-packed synopsis for those of you interested in
teaching others about the virtues of this powerful application.
At AbD Serotec, we specialize in flow cytometry reagents and offer the
largest range of antibody markers commercially available, together with
accessory buffers. Our guiding principle is to manufacture products for use
with every known flow cytometry instrument. We offer no bias towards only
one machine but are more interested in maximizing scientific performance.
Confidence in our reagents is shown by our quality promise that states that if
any product does not perform as described on its datasheet we will replace
the reagent with a fresh vial or offer you credit.
Please contact us or view our website at www.ab-direct.com for our ever-
increasing range of flow cytometry reagents. You can see and print out
detailed datasheets for every product online. But should you need any further
information, just contact our Technical Services Team (see the back cover for
your nearest office) and they will be happy to assist.
I hope this booklet will prove useful to you. If you like it, let us know and
we’ll produce similar guides for the research applications we support.
Morris Gillis
Marketing Manager
2
Flow Cytometry ipl.qxd 11/12/06 11:14 Page 2

Contents
Chapter 1 Principles of the flow cytometer
Fluidics system . . . . . . . . . . . . . . . . . . . . . . . . . . . . . . . . . . . . . . . . . . . . . 4
Optics and detection . . . . . . . . . . . . . . . . . . . . . . . . . . . . . . . . . . . . . . . . . 5
Signal processing . . . . . . . . . . . . . . . . . . . . . . . . . . . . . . . . . . . . . . . . . . . 6
Electrostatic cell sorting . . . . . . . . . . . . . . . . . . . . . . . . . . . . . . . . . . . . . . 7
Chapter 2 Principles of fluorescence
Fluorochromes and light . . . . . . . . . . . . . . . . . . . . . . . . . . . . . . . . . . . . . . 9
Maximal absorbance and maximal emission . . . . . . . . . . . . . . . . . . . . . 10
Why use a fluorescent probe? . . . . . . . . . . . . . . . . . . . . . . . . . . . . . . . . 12
Which fluorochromes are useful for flow cytometry? . . . . . . . . . . . . . . . 12
Fluorescence compensation . . . . . . . . . . . . . . . . . . . . . . . . . . . . . . . . . . 14
Chapter 3 Data analysis
Gates and regions . . . . . . . . . . . . . . . . . . . . . . . . . . . . . . . . . . . . . . . . . . 16
Single-parameter histograms . . . . . . . . . . . . . . . . . . . . . . . . . . . . . . . . . 18
Two-parameter histograms . . . . . . . . . . . . . . . . . . . . . . . . . . . . . . . . . . . 20
Intracellular antigens . . . . . . . . . . . . . . . . . . . . . . . . . . . . . . . . . . . . . . . 21
Immunophenotyping . . . . . . . . . . . . . . . . . . . . . . . . . . . . . . . . . . . . . . . . 22
Chapter 4 Common protocols
Sample preparation . . . . . . . . . . . . . . . . . . . . . . . . . . . . . . . . . . . . . . . . 24
Methods
1 Preparation of cells . . . . . . . . . . . . . . . . . . . . . . . . . . . . . . . . . . . . . . . 25
2 Direct immunofluorescence staining of cells and blood . . . . . . . . . . . 26
3 Indirect immunofluorescence staining of cells and blood . . . . . . . . . . 27
4 Staining lambda and kappa chains in whole blood . . . . . . . . . . . . . . 28
5 Whole blood protocol for analysis of intracellular cytokines . . . . . . . 28
6 Direct staining of intracellular antigens . . . . . . . . . . . . . . . . . . . . . . . 29
7 Direct staining of intracellular antigens: methanol method . . . . . . . . 30
Chapter 5 Troubleshooting
. . . . . . . . . . . . . . . . . . . . . . . . . . . . . . . . . . . . 31
Recommended reading
. . . . . . . . . . . . . . . . . . . . . . . . . . . . . . . . . . . . . . . . 33
3
Flow Cytometry ipl.qxd 11/12/06 11:14 Page 3
1
Principles of the
flow cytometer
C H A P T E R 1
4
Chapter
where
D = tube diameter,
V = mean velocity of fluid,
p = density of fluid, and
μ = viscosity of fluid.
When Re < 2300, flow is
always laminar. When Re >
2300, flow can be turbulent,
which accelerates diffusion.
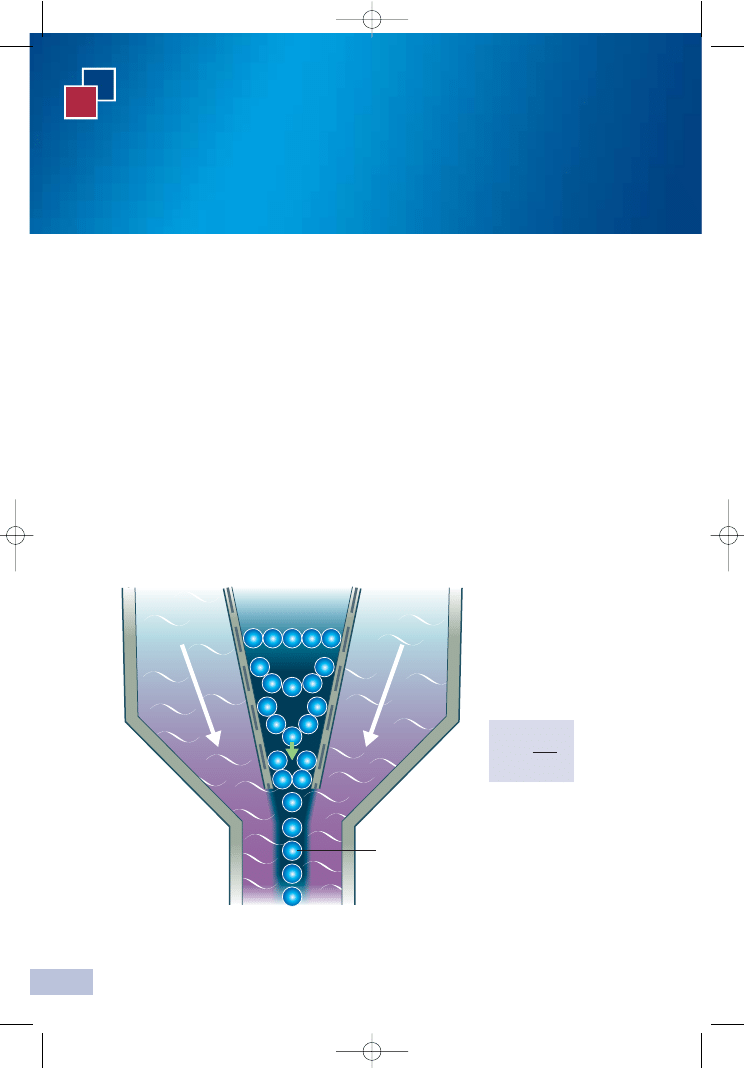
Fluidics system
One of the fundamentals of flow cytometry is the ability to measure the
properties of individual particles. When a sample in solution is injected into a
flow cytometer, the particles are randomly distributed in three-dimensional
space. The sample must therefore be ordered into a stream of single particles
that can be interrogated by the machine’s detection system. This process is
managed by the fluidics system.
Essentially, the fluidics system consists of a central channel/core through
which the sample is injected, enclosed by an outer sheath that contains faster
flowing fluid. As the sheath fluid moves, it creates a massive drag effect on
the narrowing central chamber. This alters the velocity of the central fluid
whose flow front becomes parabolic with greatest velocity at its center and
zero velocity at the wall (see Figure 1). The effect creates a single file of
particles and is called hydrodynamic focusing. Under optimal conditions
(laminar flow) the fluid in the
central chamber will not mix
with the sheath fluid.
The flow characteristics of
the central fluid can be
estimated using Reynolds
Number (R
e
):
Single flow
FIGURE 1
Hydrodynamic focusing produces a single
stream of particles
R
e
=
pVD
μ
Sheath
fluid
Central core
Flow Cytometry ipl.qxd 11/12/06 11:14 Page 4

C H A P T E R 1
5
Without hydrodynamic focusing the nozzle of the instrument (typically
70
μM) would become blocked, and it would not be possible to analyze one
cell at a time.
Optics and detection
After hydrodynamic focusing, each particle passes through one or more
beams of light. Light scattering or fluorescence emission (if the particle is
labeled with a fluorochrome) provides information about the particle’s
properties. The laser and the arc lamp are the most commonly used light
sources in modern flow cytometry.
Lasers produce a single wavelength of light (a laser line) at one or more
discreet frequencies (coherent light). Arc lamps tend to be less expensive than
lasers and exploit the color emissions of an ignited gas within a sealed tube.
However, this produces unstable incoherent light of a mixture of wavelengths,
which needs subsequent optical filtering.
Light that is scattered in the forward direction, typically up to 20
o
offset from
the laser beam’s axis, is collected by a lens known as the forward scatter
channel (FSC). The FSC intensity roughly equates to the particle’s size and can
also be used to distinguish between cellular debris and living cells.
Light measured approximately at a 90
o
angle to the excitation line is called
side scatter. The side scatter channel (SSC) provides information about the
granular content within a particle. Both FSC and SSC are unique for every
particle, and a combination of the two may be used to differentiate different
cell types in a heterogeneous sample.
Fluorescence measurements taken at different wavelengths can provide
quantitative and qualitative data about fluorochrome-labeled cell surface
receptors or intracellular molecules such as DNA and cytokines.
Flow cytometers use separate fluorescence (FL-) channels to detect light
emitted. The number of detectors will vary according to the machine and its
manufacturer. Detectors are either silicon photodiodes or photomultiplier
tubes (PMTs). Silicon photodiodes are usually used to measure forward
scatter when the signal is strong. PMTs are more sensitive instruments and
are ideal for scatter and fluorescence readings.
The specificity of detection is controlled by optical filters, which block certain
wavelengths while transmitting (passing) others. There are three major filter
types. ‘Long pass’ filters allow through light above a cut-off wavelength,
‘short pass’ permit light below a cut-off wavelength and ‘band pass’ transmit
light within a specified narrow range of wavelengths (termed a band width).
All these filters block light by absorption (Figure 2).
Flow Cytometry ipl.qxd 11/12/06 11:14 Page 5
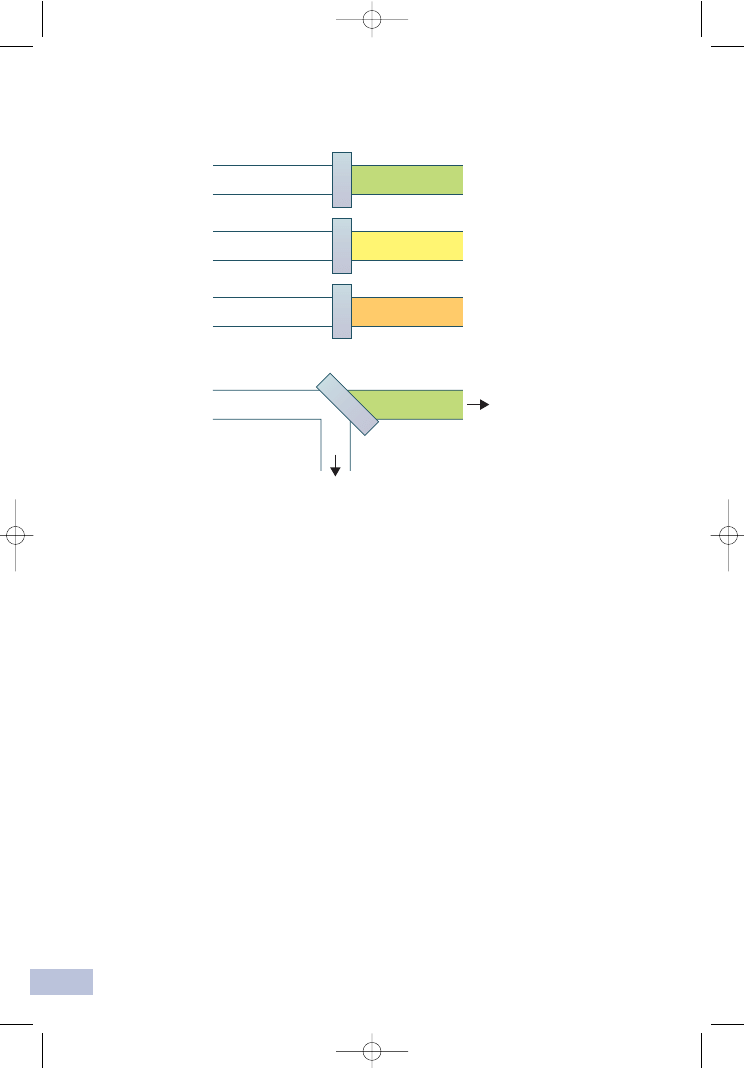
When a filter is placed at a 45
o
angle to the oncoming light it becomes a
dichroic filter/mirror. As the name suggests, this type of filter performs two
functions, first, to pass specified wavelengths in the forward direction and,
second, to deflect blocked light at a 90
o
angle. To detect multiple signals
simultaneously, the precise choice and order of optical filters will be an
important consideration (refer to Figure 3).
Signal processing
When light hits a photodetector a small current (a few microamperes) is
generated. Its associated voltage has an amplitude proportional to the total
number of light photons received by the detector. This voltage is then
amplified by a series of linear or logarithmic amplifiers, and by analog to
digital convertors (ADCs), into electrical signals large enough (5–10 volts) to
be plotted graphically.
Log amplification is normally used for fluorescence studies because it expands
weak signals and compresses strong signals, resulting in a distribution that is
easy to display on a histogram. Linear scaling is preferable where there is not
such a broad range of signals e.g. in DNA analysis.
The measurement from each detector is referred to as a ‘parameter’ e.g.
forward scatter, side scatter or fluorescence. The data acquired in each
CHAPTER 1
6
Long pass
500 nm long pass
transmits > 500 nm
560 nm short pass
transmits < 560 nm
630/15 nm band pass permits
everything in the 615–645 nm
band width
Light passed
Blocked light
absorbed
Blocked light
deflected
Short pass
Band pass
Dichroic
mirror
FIGURE 2
Different types of optical filters
Flow Cytometry ipl.qxd 11/12/06 11:14 Page 6
parameter are known as the ‘events’ and refer to the number of cells
displaying the physical feature or marker of interest.
Electrostatic cell sorting
A major application of flow cytometry is to separate cells according to
subtype or epitope expression for further biological studies. This process is
called cell sorting or FACS
TM
analysis.
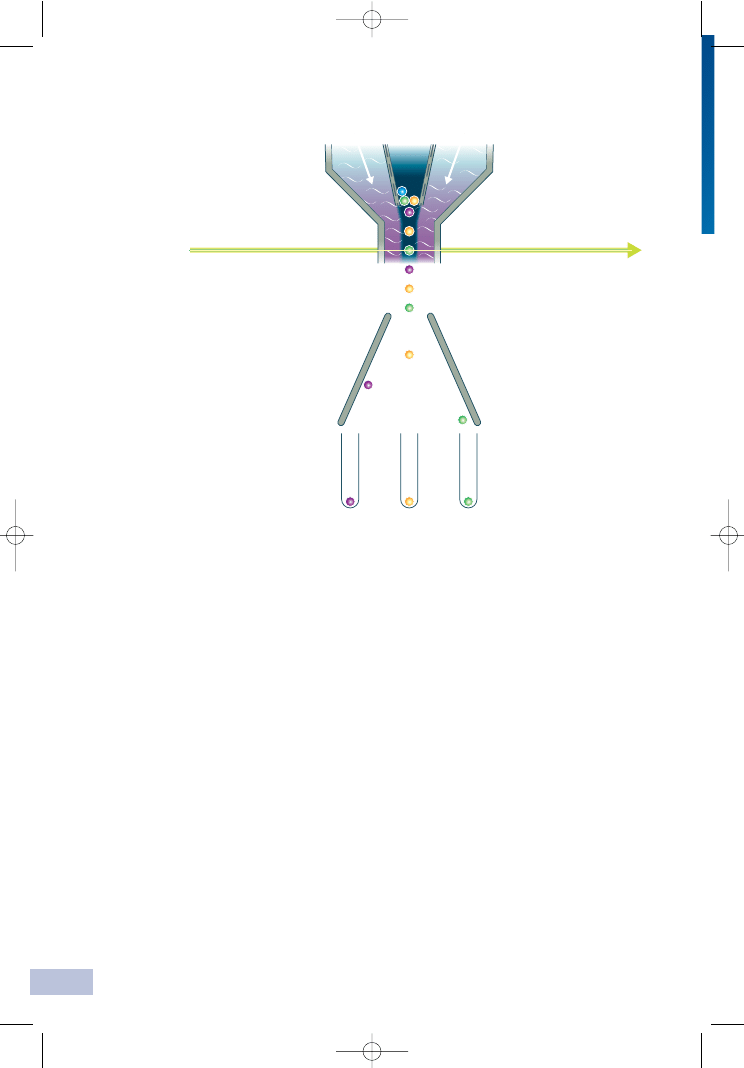
After the sample is hydrodynamically focused, each particle is probed with a
beam of light. The scatter and fluorescence signal is compared to the sort
criteria set on the instrument. If the particle matches the selection criteria, the
fluid stream is charged as it exits the nozzle of the fluidics system.
Electrostatic charging actually occurs at a precise moment called the
‘break-off point’, which describes the instant the droplet containing the
particle of interest separates from the stream.
To prevent the break-off point happening at random distances from the
nozzle and to maintain consistent droplet sizes, the nozzle is vibrated at high
frequency. The droplets eventually pass through a strong electrostatic field,
and are deflected left or right based on their charge (Figure 4).
CHAPTER 1
7
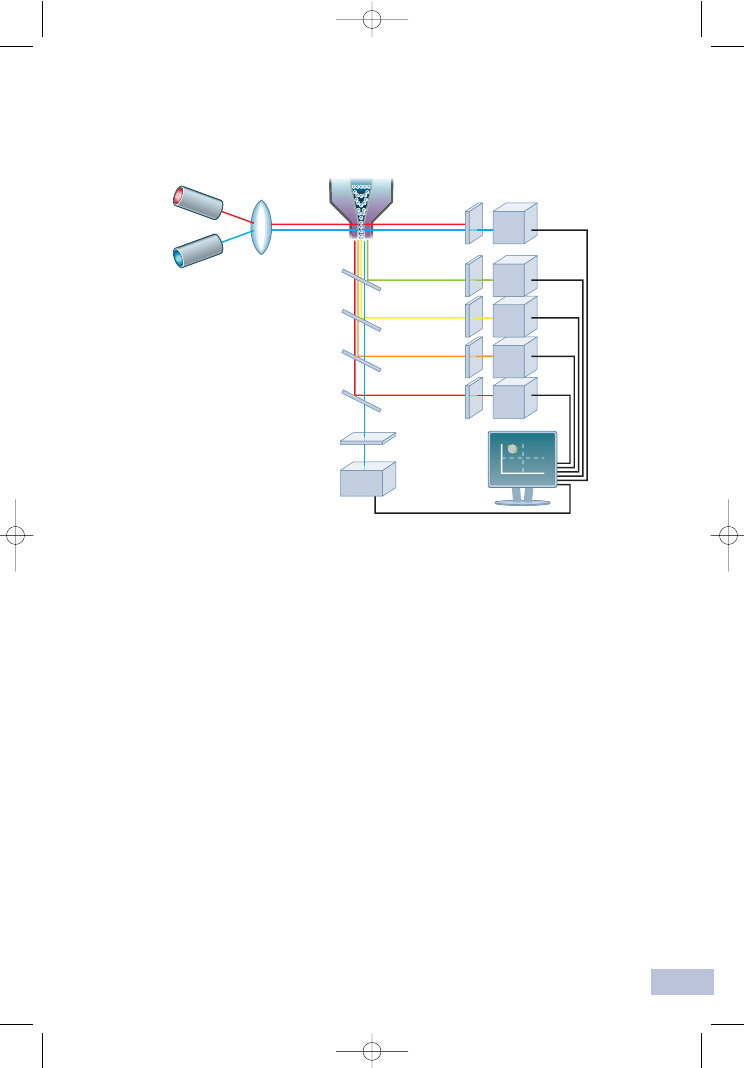
635
nm
488
nm
Lens
Lasers
Fluidics system
Filters
Filters
Detectors
Detector
SSC
Screen
PMT
(FL-1)
PMT
(FL-2)
PMT
(FL-3)
PMT
(FL-4)
FSC
FIGURE 3
Schematic overview of a typical flow cytometer setup
Flow Cytometry ipl.qxd 11/12/06 11:14 Page 7
The speed of flow sorting depends on several factors including particle size
and the rate of droplet formation. A typical nozzle is between 50–70 µM in
diameter and, depending on the jet velocity from it, can produce
30,000–100,000 droplets per second, which is ideal for accurate sorting.
Higher jet velocities risk the nozzle becoming blocked and will also decrease
the purity of the preparation.
CHAPTER 1
8
Laser interrogation
Break-off point
(charging)
Voltage
plates
–
–
–
–
+
+
+
+
FIGURE 4
Electrostatic flow sorting
Flow Cytometry ipl.qxd 11/12/06 11:14 Page 8
2
Principles of fluorescence
CHAPTER 2
9
Chapter
Fluorochromes and light
Fluorochromes are essentially dyes, which accept light energy (e.g. from a
laser) at a given wavelength and re-emit it at a longer wavelength. These two
processes are called excitation and emission. The process of emission follows
extremely rapidly, commonly in the order of nanoseconds, and is known as
fluorescence. Before considering the different types of fluorochrome available
for flow cytometry, it is necessary to understand the principles of light
absorbance and emission.
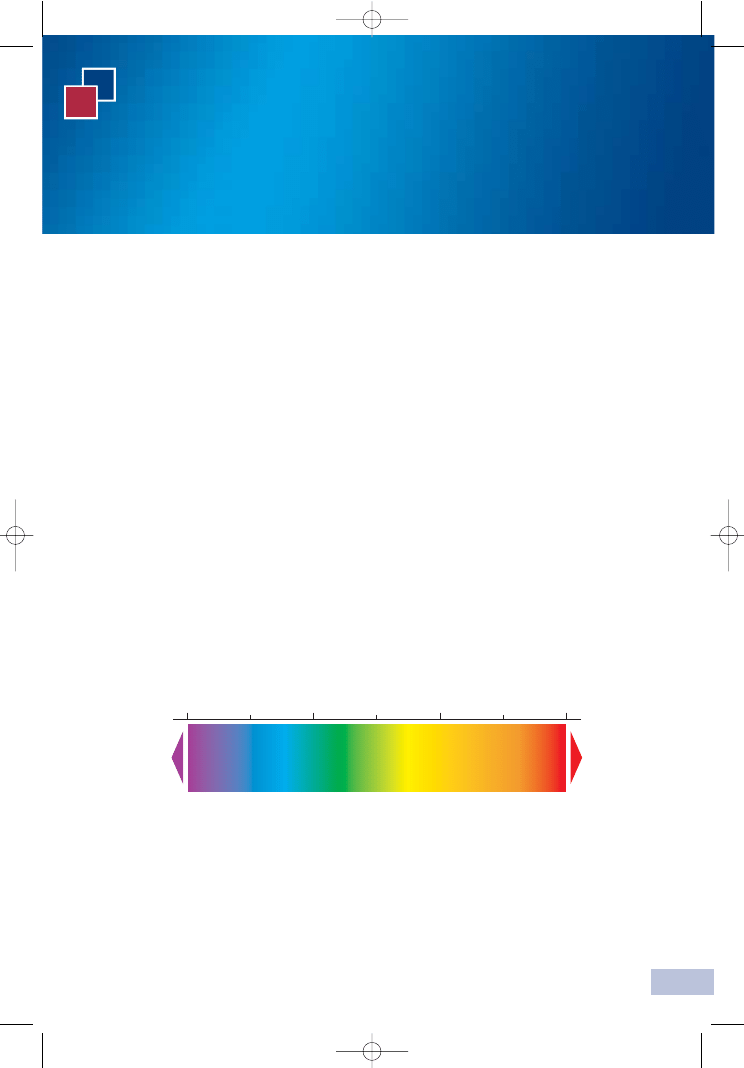
Light is a form of electromagnetic energy that travels in waves. These waves
have both frequency and length, the latter of which determines the color of
light. The light that can be visualized by the human eye represents a narrow
wavelength band (380–700 nm) between ultraviolet (UV) and infrared (IR)
radiation (Figure 5). Sunlight, for example, contains UV and IR light that,
although invisible to the eye, can still be felt as warmth on the skin and
measured scientifically using photodetectors. The visible spectrum can further
be subdivided according to color, often remembered by the mnemonic
‘ROY G BV’ standing for red, orange, yellow, green, blue and violet. Red light
is at the longer wavelength end (lower energy) and violet light at the shorter
wavelength end (higher energy).
Stokes Shift
When light is absorbed by a fluorochrome, its electrons become excited and
move from a resting state (1) to a maximal energy level called the ‘excited
electronic singlet state’ (2). The amount of energy required will differ for each
Higher
energy
Lower
energy
Ultraviolet
Visible spectrum
Infrared
400 nm
500 nm
600 nm
700 nm
FIGURE 5
The electromagnetic spectrum
Flow Cytometry ipl.qxd 11/12/06 11:14 Page 9
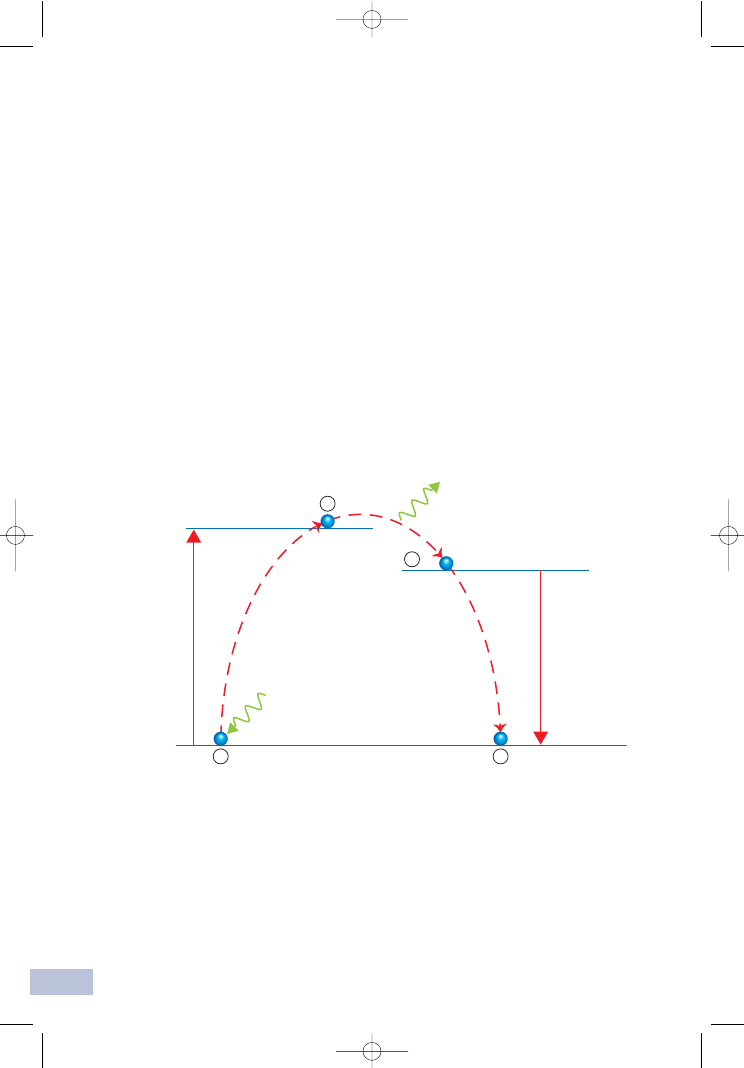
Excited singlet state
Ground state
Relaxed singlet state
4
1
2
3
E
excitation
E
emission
Light
IN
Light
OUT
Heat
OUT
fluorochrome and is depicted in Figure 6 as E
excitation
. This state only lasts for
1–10 nanoseconds because the fluorochrome undergoes internal
conformational change and, in doing so, releases some of the absorbed
energy as heat. The electrons subsequently fall to a lower, more stable, energy
level called the ‘relaxed electronic singlet state’ (3). As electrons steadily
move back from here to their ground state they release the remaining energy
(E
emission
) as fluorescence (4).
As E
emission
contains less energy than was originally put into the fluorochrome
it appears as a different color of light to E
excitation
. Therefore, the emission
wavelength of any fluorochrome will always be longer than its excitation
wavelength. The difference between E
excitation
and E
emission
is called Stokes
Shift and this wavelength value essentially determines how good a
fluorochrome is for fluorescence studies. After all, it is imperative that the
light produced by emission can be distinguished from the light used for
excitation. This difference is easier to detect when fluorescent molecules have
a large Stokes Shift.
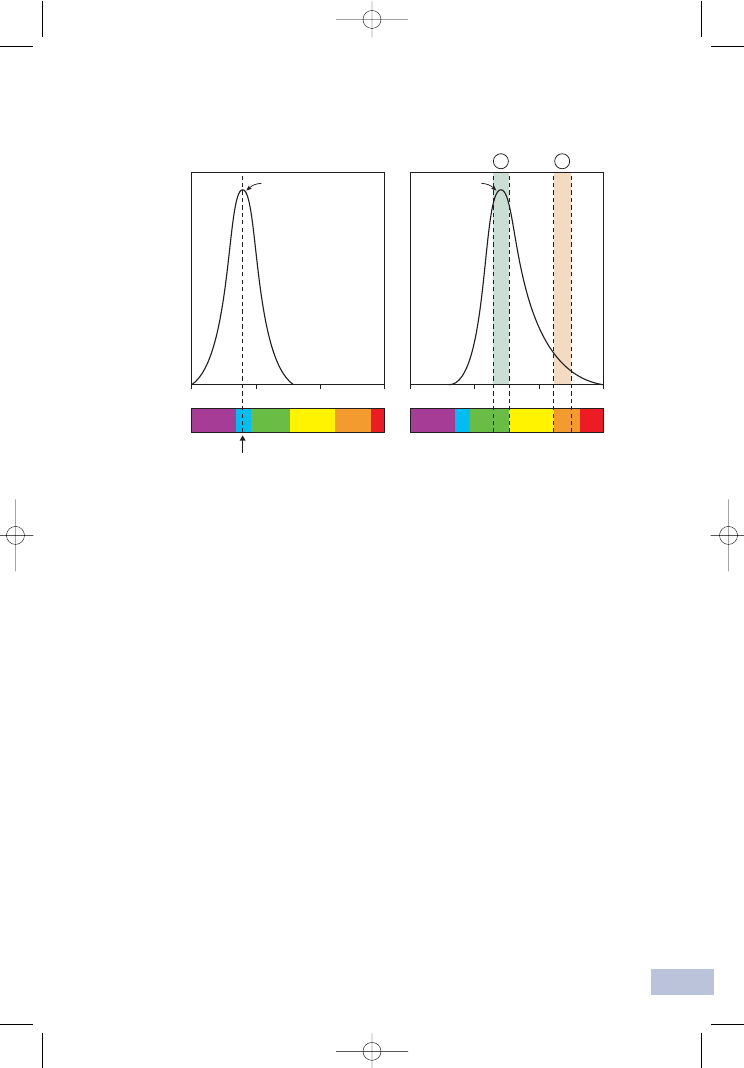
Maximal absorbance and maximal emission
The wavelength of excitation is critical to the total photons of light the
fluorochrome will absorb. FITC (fluorescein isothiocyanate), for example, will
absorb light within the range 400–550 nm but the closer the wavelength is to
490 nm (its peak or maximum), the greater the absorbance is. In turn, the
more photons absorbed, the more intense the fluorescence emission will be.
CHAPTER 2
10
FIGURE 6
Stokes Shift
Flow Cytometry ipl.qxd 11/12/06 11:14 Page 10
Wavelength (nm)
(blue light)
Excitation
laser line
Peak or
maximum
Excellent
signal
(green)
Weak
signal
(orange)
Spectrum
400
500
600
700
Rel
a
tive
a
bsorb
a
n
ce
400
500
600
700
Rel
a
tive fluor
es
cen
ce emission
A
B
Peak or
maximum
These optimal conditions are termed maximal absorbance and maximal
emission wavelengths.
Maximal absorbance usually defines the laser spectral line that is used for
excitation. In the case of FITC, its maximum falls within the blue spectrum.
Therefore, the blue Argon-ion laser is commonly used for this fluorochrome,
as it excites at 488 nm, close to FITC’s absorbance peak of 490 nm.
FITC emits fluorescence over the range 475–700 nm peaking at 525 nm,
which falls in the green spectrum. If filters are used to screen out all light
other than that measured at the maximum via channel A (see Figure 7), FITC
will appear green. Hence, ‘fluorescence color’ usually refers to the color of
light a fluorochrome emits at its highest stable excited state. However, if FITC
fluorescence is detected only via channel B (see Figure 7), it will appear
orange and be much weaker in intensity. How the flow cytometer is set up to
measure fluorescence will ultimately determine the color of a fluorochrome.
CHAPTER 2
11
FIGURE 7
Light absorbance (LEFT) and light emission (RIGHT) of FITC
Flow Cytometry ipl.qxd 11/12/06 11:14 Page 11

CHAPTER 2
12
Why use a fluorescent probe?
The purpose of a fluorescent probe, such as a fluorochrome-conjugated
antibody, is to directly target an epitope of interest and to allow its biological
and biochemical properties to be measured more easily by the flow cytometer.
Fluorescent probes are useful in a wide range of applications including:
identifying and quantifying distinct populations of cells, cell surface receptors
or intracellular organelles; cell sorting; immunophenotyping; calcium influx
experiments; determining nucleic acid content; measuring enzyme activity, and
for apoptosis studies. By changing the excitation light and using more than one
fluorochrome, it is possible to analyze several parameters of the sample at any
one time. This forms the basis of multicolor fluorescence studies.
Which fluorochromes are useful for flow cytometry?
There are dozens of fluorescent molecules (fluorochromes) with a potential
application in flow cytometry. The list is ever growing but it is not the scope of
this booklet to cover them all. Instead, some of the most useful fluorochromes
for surface or intracellular epitope detection are described on page 13,
including the very latest in fluorescent probe technology – tandem dyes. There
is enough variation in the two tables to cover most researchers’ needs.
Single dyes:
Some of these single dyes e.g. FITC have been in use for the past 30 years but
are now facing competition from alternatives like Alexa Fluor
®
dyes, which
offer the user greater photostability and increased fluorescence.
Tandem dyes:
In a tandem dye, a small fluorochrome takes a ‘piggy-back’ ride on another
larger fluorochrome. When the first dye is excited and reaches its maximal
singlet state, all its energy transfers to the second dye (an acceptor molecule),
located in close proximity. This activates the second fluorochrome, which then
produces the fluorescence emission. The process is called FRET (fluorescence
resonance energy transfer). It is a clever way to achieve higher Stokes Shifts
and, therefore, increase the number of colors that can be analyzed from a
single laser wavelength.
The majority of tandem dyes have been manufactured for the standard 488 nm
laser, which is found in most flow cytometers. Tandem dyes are very useful for
multicolor fluorescence studies especially in combination with single dyes.
For example, Alexa Fluor
®
488, Phycoerythrin, PerCP-Cy5.5 and PE-Cy7 can all
be excited at 488 nm, but will produce green, yellow, purple and infrared
emissions respectively, which can be measured using separate detectors.
Flow Cytometry ipl.qxd 11/12/06 11:14 Page 12
CHAPTER 2
13
Single dyes
Dye
Laser
excitation
Maximal Maximal Fluorescence
line (nm)
absorbance (nm) emission (nm)
color
Alexa Fluor
®
405
405, 407
401
421
Alexa Fluor
®
430
405, 407
433
541
Alexa Fluor
®
488
488
495
519
Alexa Fluor
®
633
633, 635, 647
632
647
Alexa Fluor
®
647
633, 635, 647
650
665
Alexa Fluor
®
660
633, 635, 647
663
690
Alexa Fluor
®
680
633, 635, 647
679
702
Alexa Fluor
®
700
633, 635, 647
702
723
Infrared
APC
633, 635, 647
650
661
FITC
488
490
525
Pacific Blue™
405, 407
410
455
PerCP
488
490
675
Phycoerythrin
488
490, 565
578
Tandem dyes
Dye
Laser
excitation
Maximal Maximal Fluorescence
line (nm)
absorbance (nm) emission (nm)
color
APC-Alexa Fluor
®
750 633, 635, 647 650
779
Infrared
APC-Cy5.5
633, 635, 647 650
695
APC-Cy7
633, 635, 647
650
785
Infrared
PerCP-Cy5.5
488 496, 546
695
PE-Alexa Fluor
®
610
488
496, 546
627
PE-Alexa Fluor
®
647
488
496, 546
667
PE-Alexa Fluor
®
680
488
496, 546
702
PE-Alexa Fluor
®
700
488
496, 546
723
Infrared
PE-Alexa Fluor
®
750
488
496, 546
779
Infrared
PE-Cy5.5
488
496, 546
695
PE-Cy5
488
496, 546
667
PE-Cy7
488
496, 546
785
Infrared
PE-Texas Red
®
488
496, 546
615
Abbreviations
APC
Allophycocyanin
FITC
Fluorescein isothiocyanate
PE
Phycoerythrin
PerCP Peridinin-chlorophyll-protein complex
Note. Phycoerythrin (PE) is same as R-Phycoerythrin (RPE).
Flow Cytometry ipl.qxd 11/12/06 11:14 Page 13
CHAPTER 2
14
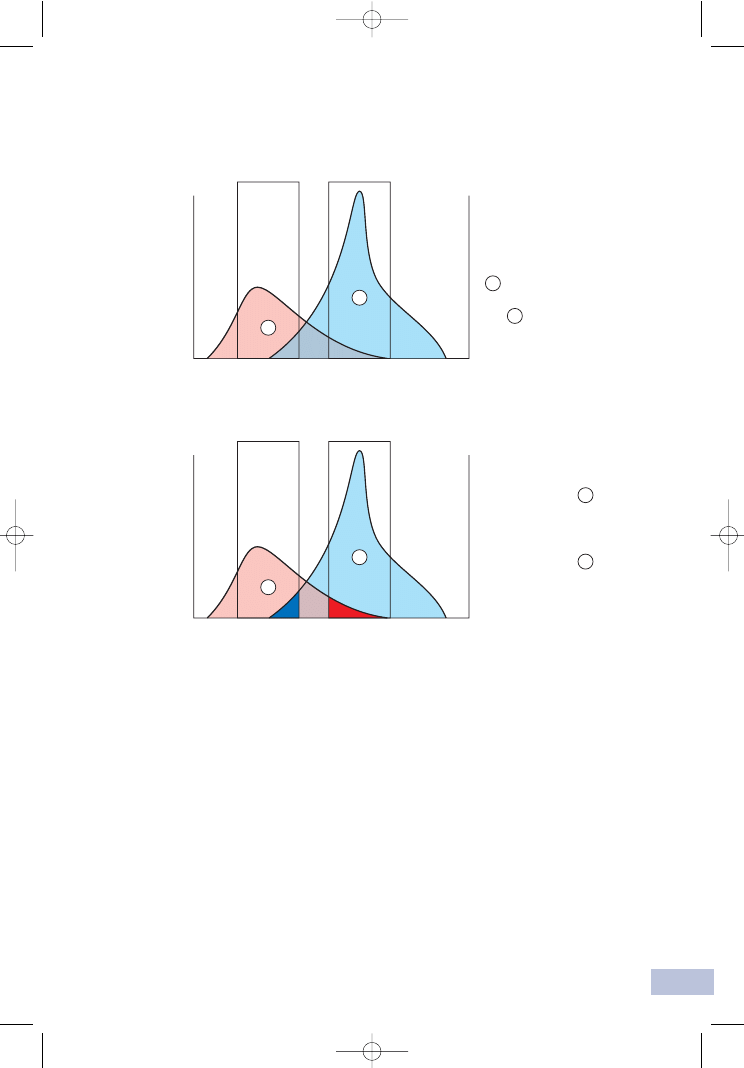
Fluorescence compensation
One consideration to be aware of when performing multicolor fluorescence
studies is the possibility of spectral overlap. When two or more fluorochromes
are used during a single experiment there is a chance that their emission
profiles will coincide, making measurement of the true fluorescence emitted
by each difficult. This can be avoided by using fluorochromes at very different
ends of the spectrum e.g. Alexa Fluor
®
405 and Phycoerythrin; however, this
is not always practical.
Instead, a process called fluorescence compensation is applied during data
analysis, which calculates how much interference (as a %) a fluorochrome
will have in a channel that was not assigned specifically to measure it.
Figure 8 helps to explain the concept.
The graphs show the emission profiles of two imaginary fluorochromes ‘A’
and ‘B’ which are being detected in FL-1 and FL-2 channels respectively.
Because the emission profiles are so close together, a portion of fluorochrome
A spills over into FL-2 (red shade) and conversely, some of fluorochrome B
reaches FL-1 (dark blue shade).
To calculate how much compensation needs to be applied to the dataset if
both dyes are used simultaneously, some control readings must first be taken.
Fluorochrome A should be run through the flow cytometer on its own and the
% of its total emission that is detectable in FL-2 (spillover) determined. The
procedure should be repeated with fluorochrome B, except that this time FL-1
is spillover.
Suppose the results are:
This means that when the two fluorochromes are used for a dual-color
experiment, the true reading for fluorochrome A in FL-1
= (total fluorescence measured in FL-1) minus (5% of fluorochrome B’s total fluorescence)
Similarly, the true reading for fluorochrome B in FL-2
= (total fluorescence measured in FL-2) minus (17% of fluorochrome A’s total fluorescence)
Fortunately, modern flow cytometry analytical software applies fluorescence
compensation mathematics automatically, which simplifies matters
considerably.
Spillover Fluorescence
FL-1
FL-2
Fluorochrome A
N/A
17%
Fluorochrome B
5%
N/A
Flow Cytometry ipl.qxd 11/12/06 11:14 Page 14
CHAPTER 2
15
Spectral properties
of two imaginary
fluorochromes,
'A' and 'B'.
is measured in
the FL-1 channel
and in the FL-2
channel.
Wavelength
FL-1
Fluor
es
cen
ce
A
B
A
B
A
B
FL-2
Wavelength
Spectral overlap.
Dark blue shade represents
the proportion of
that overlaps into the
FL-1 channel.
Red shade represents
the proportion of
that interferes with
FL-2 channel
measurements.
FL-1
Fluor
es
cen
ce
A
B
FL-2
FIGURE 8
Fluorescence compensation
Flow Cytometry ipl.qxd 11/12/06 11:14 Page 15
Gates and regions
An important principle of flow cytometry data analysis is to selectively
visualize the cells of interest while eliminating results from unwanted
particles e.g. dead cells and debris. This procedure is called gating.
Cells have traditionally been gated according to physical characteristics. For
instance, subcellular debris and clumps can be distinguished from single cells
by size, estimated by forward scatter. Also, dead cells have lower forward
scatter and higher side scatter than living cells. Lysed whole blood cell
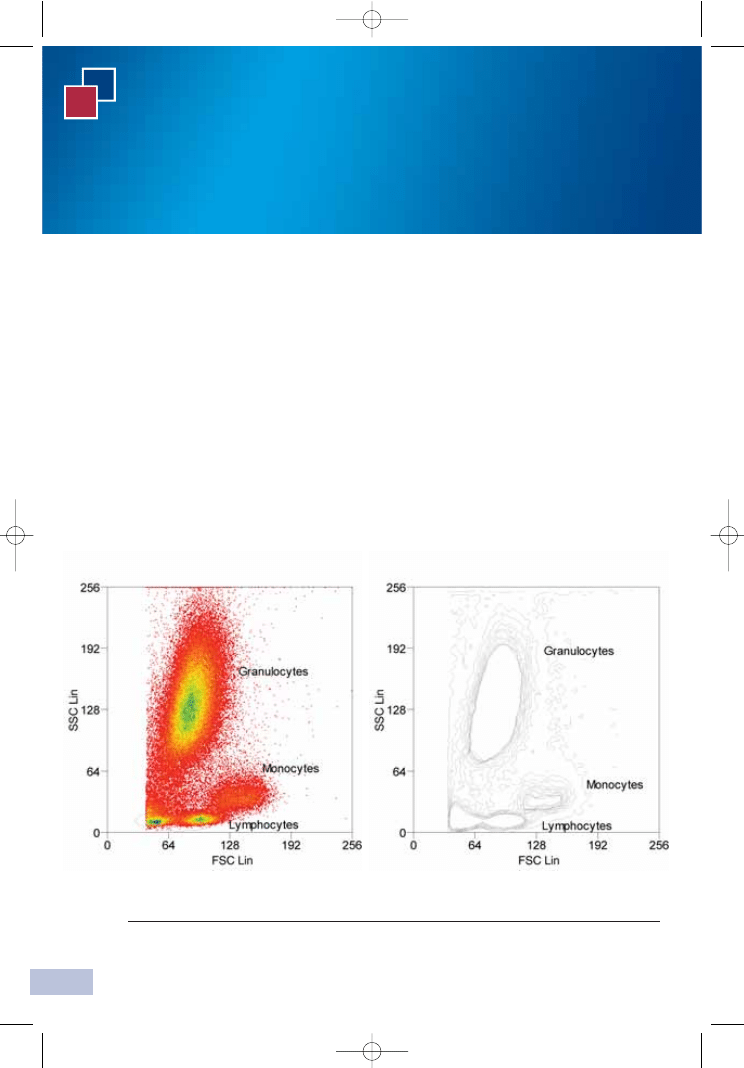
analysis is the most common application of gating, and Figure 9 depicts
typical graphs for SSC versus FSC when using large cell numbers. The different
physical properties of granulocytes, monocytes and lymphocytes allow them
to be distinguished from each other and from cellular contaminants.
3
Data analysis
CHAPTER 3
16
Chapter
FIGURE 9
Analysis of lysed whole blood using FSC/SSC
Density plot
Contour diagram
Abbreviations used in histograms: Lin = Linear scale Log = Logarithmic scale
Log Comp = Logarithmic scale with compensation applied
Flow Cytometry ipl.qxd 11/12/06 11:14 Page 16
On the density plot, each dot or point represents an individual cell that has
passed through the instrument. Yellow/green hotspots indicate large numbers
of events resulting from discreet populations of cells. The colors give the graph
a three-dimensional feel. After a little experience, discerning the various
subtypes of blood cells is relatively straightforward.
Contour diagrams are an alternative way to demonstrate the same data.
Joined lines represent similar numbers of cells. The graph takes on the
appearance of a geographical survey map, which, in principle, closely resembles
the density plot. It is a matter of preference but sometimes discreet
populations of cells are easier to visualize on contour diagrams e.g. compare
monocytes in Figure 9.
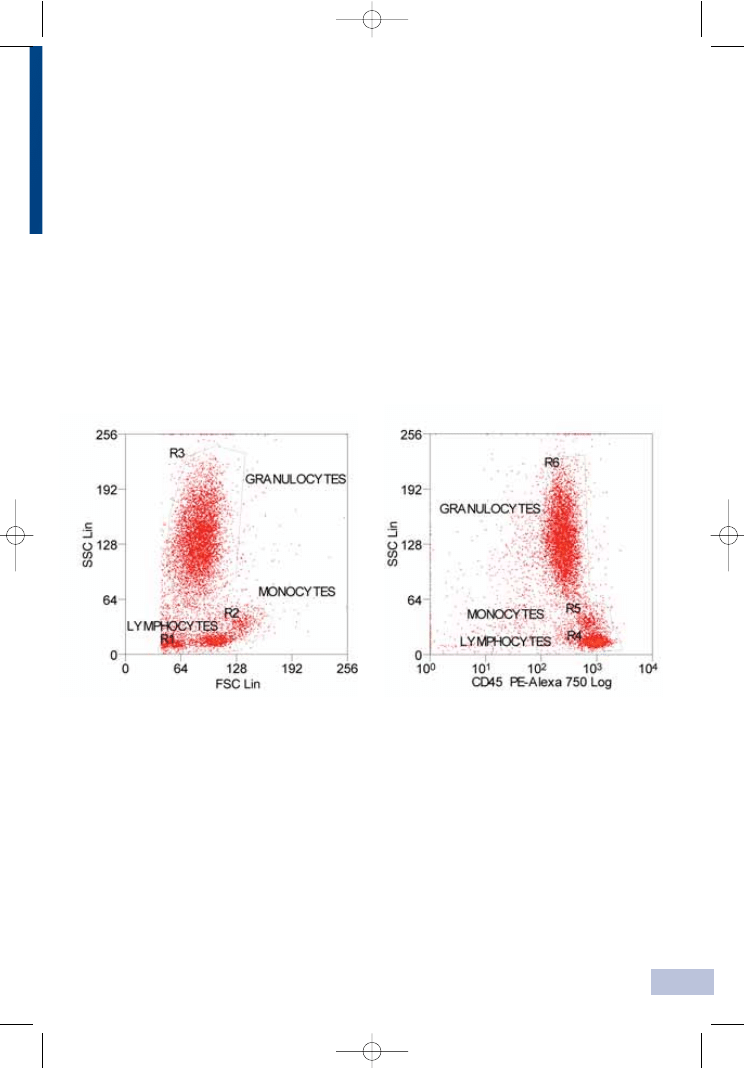
Newer gating strategies utilize fluorescence parameters along with scatter
parameters. Once again, blood can be used to demonstrate this principle.
Above on the left is a FSC/SSC plot for human lysed whole blood using
smaller numbers of cells than in Figure 9. The lymphocytes, monocytes and
granulocytes have been gated as region 1 (R1), region 2 (R2) and region
3 (R3), respectively. ‘Region’ simply refers to an area drawn on a plot
displaying flow cytometry data.
On the right the same cells are now plotted as SSC on the y-axis versus CD45
fluorescence on the x-axis. CD45 is a marker expressed on all white blood
cells at varying intensities but is absent on red blood cells. In relative terms,
lymphocytes have a low SSC and high CD45 count (R4), granulocytes have a
high SSC and low CD45 count (R6), while monocytes are somewhere in
between the other two (R5). The major difference between the lymphocytes
CHAPTER 3
17
FIGURE 10
Lysed whole blood analysis using scatter and fluorescence
Flow Cytometry ipl.qxd 11/12/06 11:14 Page 17
gated in R1 and those gated in R4 is the absence of red blood cells in the
latter, making it a much purer preparation. This highlights the usefulness of
gating strategies that combine a scatter parameter with a fluorescence
parameter.
Single-parameter histograms
These are graphs that display a single measurement parameter (relative
fluorescence or light scatter intensity) on the x-axis and the number of events
(cell count) on the y-axis.
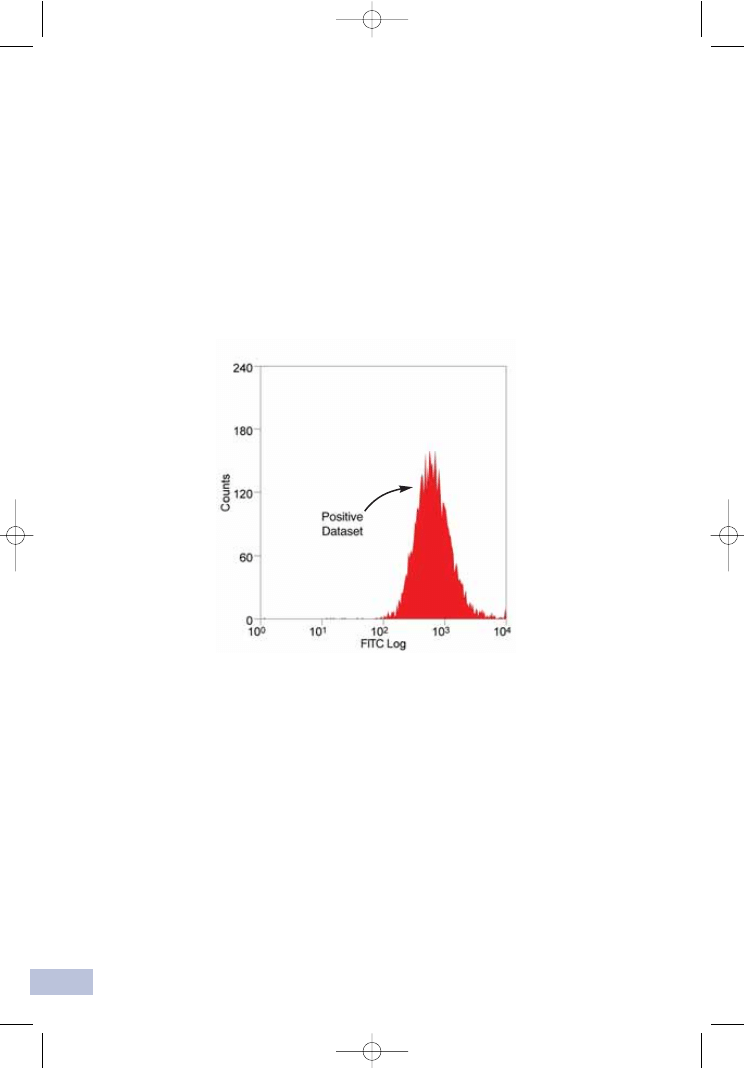
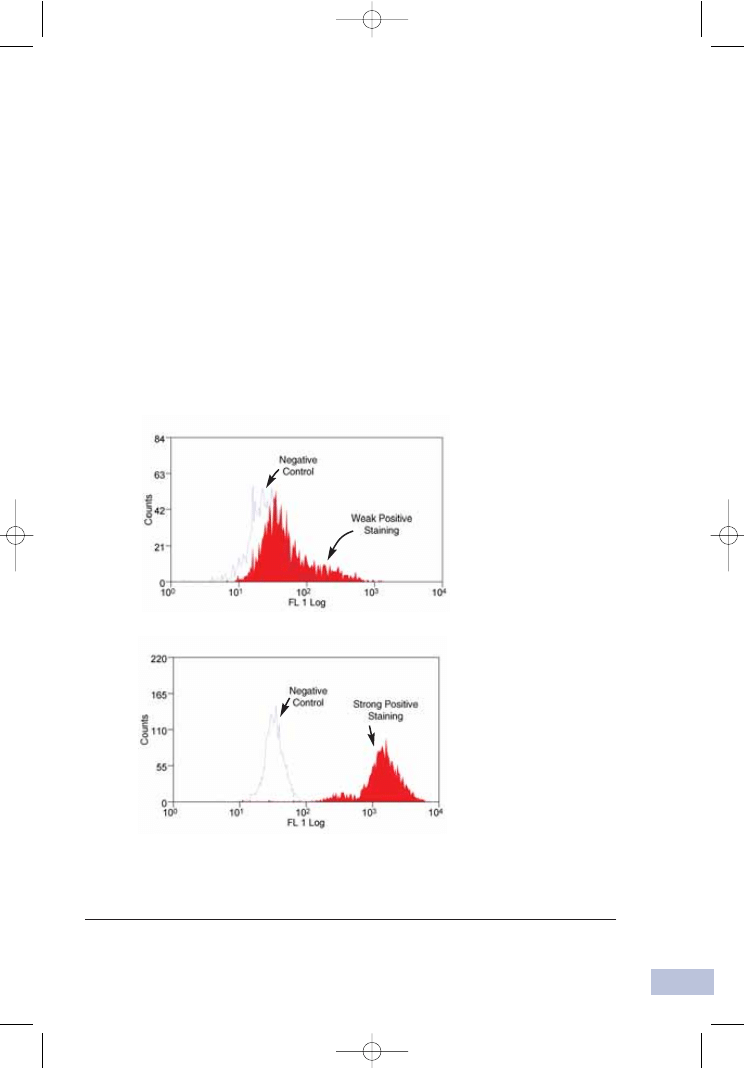
The histogram in Figure 11 looks very basic but is useful for evaluating the
total number of cells in a sample that possess the physical properties selected
for or which express the marker of interest. Cells with the desired
characteristics are known as the positive dataset.
Ideally, flow cytometry will produce a single distinct peak that can be
interpreted as the positive dataset. However, in many situations, flow analysis
is performed on a mixed population of cells resulting in several peaks on
the histogram. In order to identify the positive dataset, flow cytometry should
be repeated in the presence of an appropriate negative isotype control
(see Figure 12).
CHAPTER 3
18
FIGURE 11
A single-parameter histogram
Flow Cytometry ipl.qxd 11/12/06 11:14 Page 18
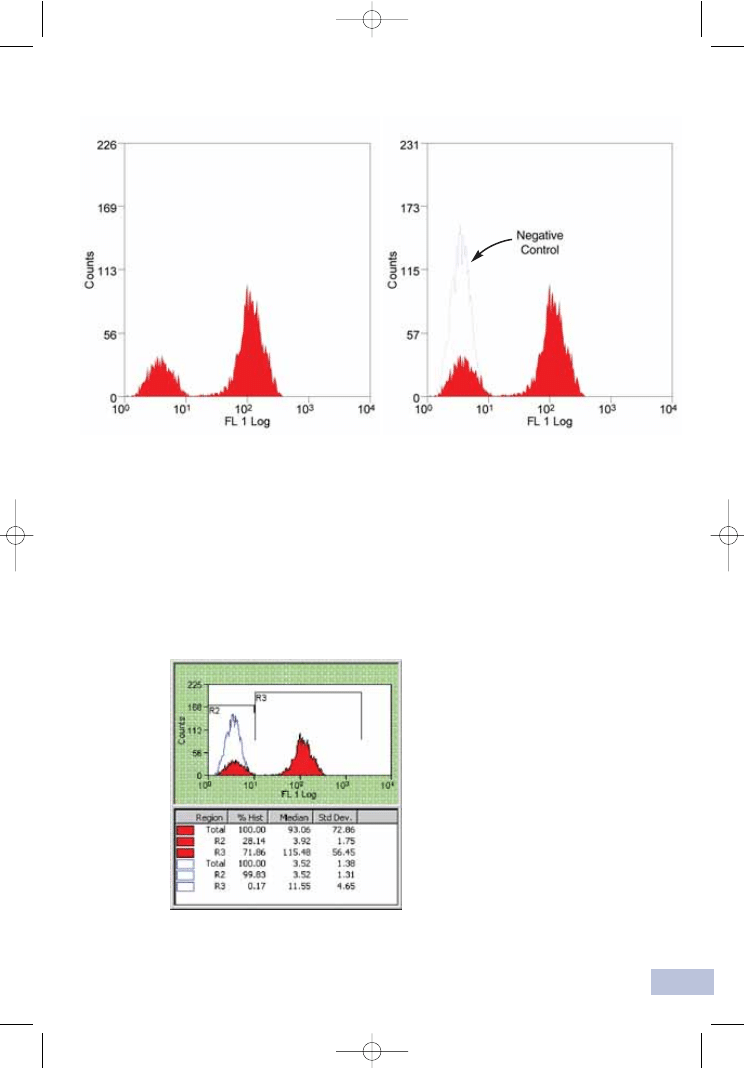
Analytical software packages that accompany flow cytometry instruments
make measuring the % of positive-staining cells in histograms easy. For
example, the F4/80 histogram is shown again below with statistics for R2 and
R3 (known on this type of graph as ‘bar regions’).
CHAPTER 3
19
FIGURE 12
Which is the positive dataset?
LEFT, Using rat anti-mouse F4/80 conjugated to
FITC to stain mouse peritoneal macrophages produces two peaks. RIGHT, By running
an appropriate isotype control (rat IgG2b negative control conjugated to FITC) and
overlaying its image on the histogram (blue outline) the positive dataset is identified
as the taller red peak on the right.
FIGURE 13
Statistical analysis
Flow Cytometry ipl.qxd 11/12/06 11:15 Page 19
CHAPTER 3
20
In Figure 13, 99.83% of the negative control (blue outline) is in R2.
28.14% of cells (red shade) ‘stain negative’ for F4/80 (R2) compared to
71.86% in the positive dataset (R3). Additional statistics about the peaks
(median and standard deviation) is also provided automatically here but this
will vary with the software. A similar type of analysis will be generated for
two-parameter histograms.
Two-parameter histograms
These are graphs that display two measurement parameters, one on the
x-axis and one on the y-axis, and the cell count as a density (dot) plot or
contour map. The parameters could be SSC, FSC or fluorescence. Some
examples of two-parameter histograms were illustrated in Figures 9 and 10.
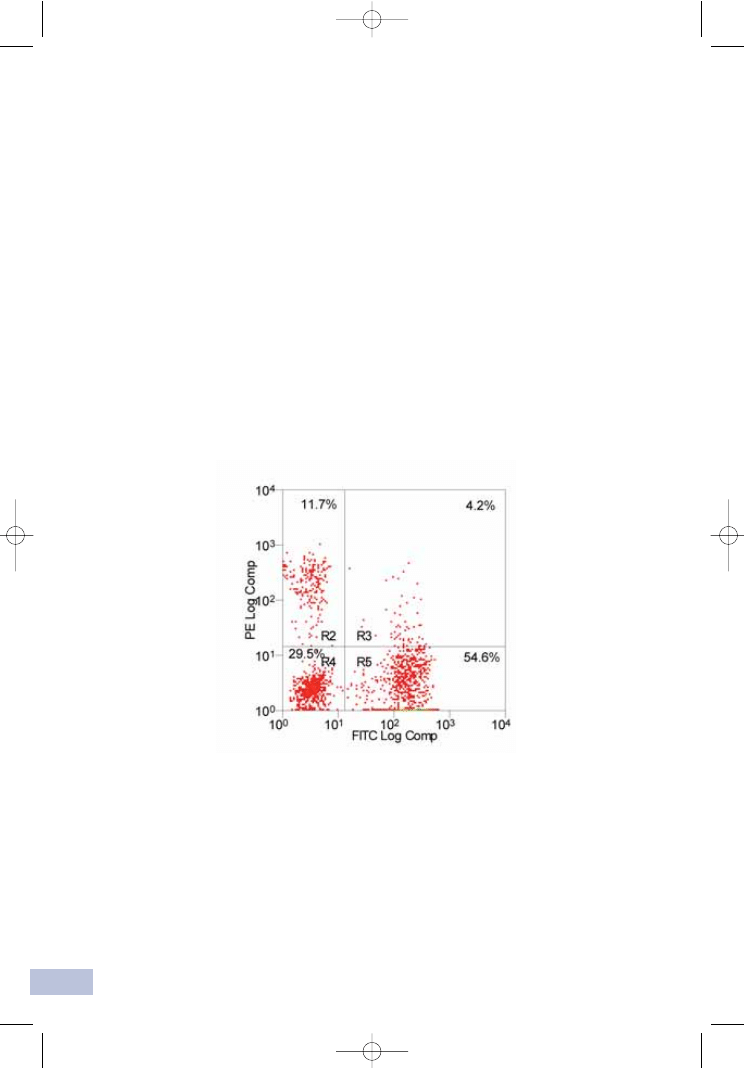
Another example is the dual-color fluorescence histogram presented below.
Lymphocytes were stained with anti-CD3 in the FITC channel (x-axis) and
anti-HLA-DR in the PE channel (y-axis). CD3 and HLA-DR are markers for
T cells and B cells, respectively.
In Figure 14, R2 encompasses the PE-labeled B cells – note their positive shift
along the PE axis. R5 contains the FITC-labeled T cells (positively shifted
along the FITC axis). The top right quadrant contains a few ‘activated T cells’
(about 4% in this sample) that possess some HLA-DR expression also.
As these stain with both antibody markers they are grouped in their own
region (R3). R4 contains cells negative for both FITC and PE (no shift).
FIGURE 14
Two-parameter (dual-color fluorescence) histogram
Flow Cytometry ipl.qxd 11/12/06 11:15 Page 20
Currently, flow cytometry can be performed on samples labeled with up to 17
fluorescence markers simultaneously
1
. Therefore a single experiment can yield
a large set of data for analysis using various two-parameter histograms.
Intracellular antigens
Staining intracellular antigens like cytokines can be difficult because
antibody-based probes cannot pass sufficiently through the plasma
membrane into the interior of the cell. To improve the situation, cells should
first be fixed in suspension and then permeabilized before adding the
fluorochrome. This allows probes to access intracellular structures while
leaving the morphological scatter characteristics of the cells intact. Many
commercial kits are available today that provide the reagents to carry out
these crucial steps e.g. Leucoperm
TM
(see Figure 15).
CHAPTER 3
21
1
Perfetto, S.
et al (2004) Seventeen colour flow cytometry: unravelling the immune system.
Nature Reviews Immunology 4:648–655
FIGURE 15
Leucoperm
TM
used in conjunction with an antibody that recognizes MOMA-2, an
intracellular antigen in mouse macrophages and monocytes. After fixation and
permeabilization (b), notice how distinctive the positive dataset becomes.
(a) BEFORE
(b) AFTER
Flow Cytometry ipl.qxd 11/12/06 11:15 Page 21
Immunophenotyping
All normal cells express a variety of cell surface markers, dependent on the
specific cell type and degree of maturation. However, abnormal growth may
interfere with the natural expression of markers resulting in overexpression of
some and under-representation of others. Flow cytometry can be used to
immunophenotype cells and thereby distinguish between healthy and
diseased cells. It is unsurprising that today immunophenotyping is one of the
major clinical applications of flow cytometry, and is used to aid the diagnosis
of myelomas, lymphomas and leukemias. It can also be used to monitor the
effectiveness of clinical treatments.
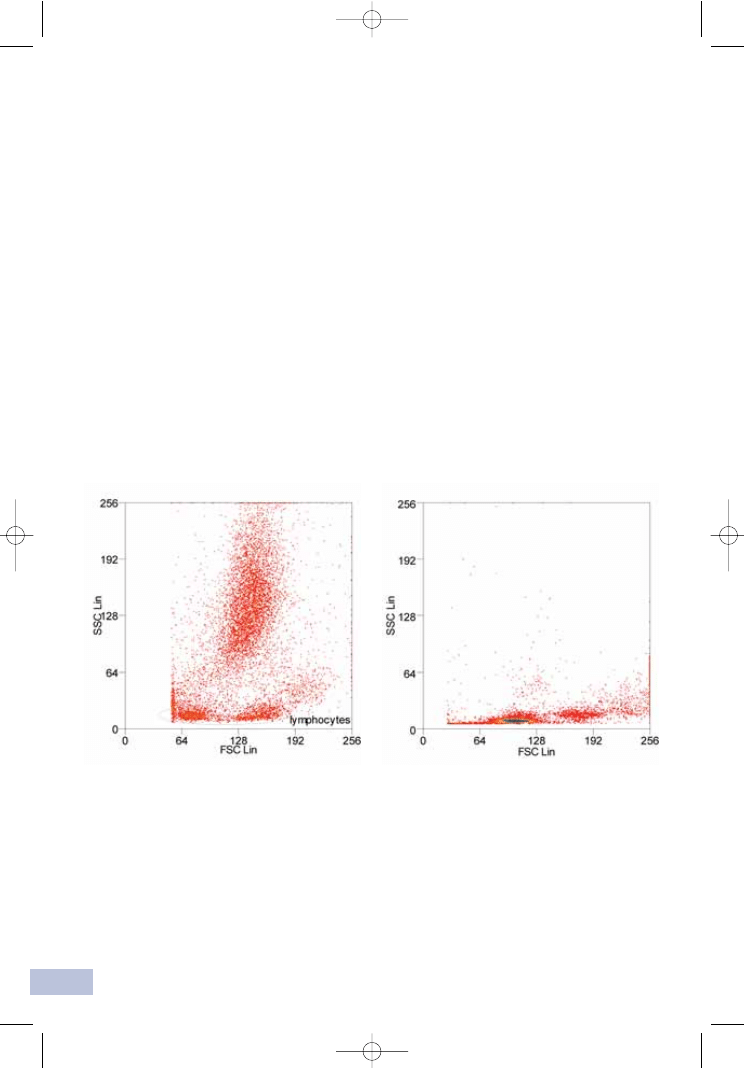
The differences between the blood profiles of a healthy individual and one
suffering from leukemia, for instance, are very dramatic. This can be seen
from the FSC v SSC plots in Figure 16. In the healthy person the cell types are
clearly defined, whereas blood from a leukemia patient is abnormal and does
not follow the classic profile.
CHAPTER 3
22
FIGURE 16
Immunophenotyping
Normal person
Leukemia patient
Flow Cytometry ipl.qxd 11/12/06 11:15 Page 22
CHAPTER 3
23
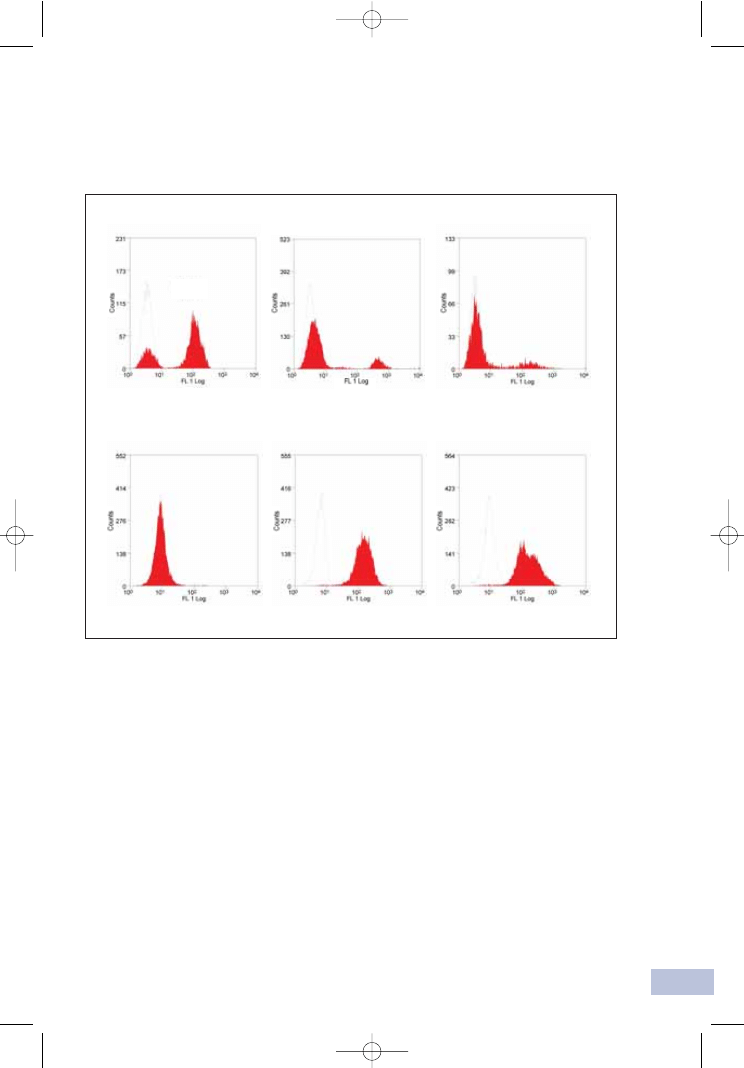
Testing the patient’s lymphocytes for specific cell surface markers also reveals
more about the condition.
CD3
A normal person has a significant proportion of CD3-positive lymphocytes.
In the patient with leukemia, staining for CD3 is absent.
CD20
In the leukemia patient there are a large number of cells staining positive for
CD20. In the healthy person only a few stain positive.
HLA-DR
The leukemia patient is HLA-DR-positive. In the normal person only a small
number of cells stain positive.
Being CD3-negative, CD20-positive and HLA-DR-positive, a clinician could
diagnose with certainty that this patient is suffering from a B cell lineage
leukemia or lymphoma. The precise classification of disease may be
determined using further antibodies.
Normal person
CD3
CD20
HLA-DR
CD3
CD20
HLA-DR
Leukemia patient
FIGURE 17
Diagnosing leukemia
Flow Cytometry ipl.qxd 11/12/06 11:15 Page 23

4
Common protocols
CHAPTER 4
24
Chapter
Sample preparation
Single cells must be suspended at a density of 10
5
–10
7
cells/ml to prevent
the narrow bores of the flow cytometer and its tubing from clogging up.
The concentration also influences the rate of flow sorting, which typically
progresses at 2000–20,000 cells/second. However, higher sort speeds may
decrease the purity of the preparation.
Phosphate buffered saline (PBS) is a common suspension buffer and the most
straightforward samples for flow cytometry include non-adherent cells from
culture, water-borne micro-organisms, bacteria and yeast. Even whole blood is
easy to use – red cells are usually removed by a simple lysis step; it is then
possible to quickly identify lymphocytes, granulocytes and monocytes by their
FSC/SSC characteristics (see page 16).
However, researchers may also wish to analyze cells from solid tissues
e.g. liver or tumors. In order to produce single cells, the solid material must be
disaggregated. This can be done either mechanically or enzymatically.
Mechanical disaggregation is suitable for loosely bound structures
e.g. adherent cells from culture, bone marrow and lymphoid tissue. It involves
passing a suspension of chopped tissue through a fine-gauge needle several
times, followed by grinding and sonication as necessary.
Enzymes are used to disrupt protein-protein interactions and the extracellular
matrix that hold cells together. Their action is dependent on factors including
pH, temperature and co-factors, so care must be taken when choosing an
enzyme. For example, pepsin works optimally between pH 1.5–2.5 but the
acidic conditions would damage cells if left unneutralized for too long, and
cell surface antigens of interest may be lost. Chelators like EDTA and EGTA
can remove divalent cations responsible for maintaining cell function and
integrity but their presence may inhibit certain enzymes, for instance,
collagenase requires Ca
2+
for activity. Enzymatic and mechanical
disaggregation is often a trial and error process to optimize the isolation of
the epitope under investigation.
To study intracellular components e.g. cytokines by flow cytometry, the
plasma membrane of the cell must be permeabilized to allow dyes or
EDTA Ethylenediaminetetraacetic acid
EGTA Ethyleneglycol-bis(2-aminoethylether)-N,N,N’,N’-tetraacetic acid
Flow Cytometry ipl.qxd 11/12/06 11:15 Page 24

25
CHAPTER 4
antibody molecules through while retaining the cell’s overall integrity. Low
concentrations (up to 0.1%) of non-ionic detergents like saponin are suitable. In
summary, the method for sample preparation will depend on the starting
material and the nature of the epitope. Although it is not possible to describe
every eventuality here, some standard protocols are given in this chapter.
1
Preparation of cells
(a) Cells stored in liquid nitrogen
1 Prepare PBS/BSA buffer (phosphate buffered saline pH 7.4 and 1% BSA).
2 Carefully remove cells from liquid nitrogen storage.
3 Thaw rapidly using PBS/BSA buffer and place into a 15 ml conical
centrifuge tube.
4 Centrifuge at 400
g for 5 minutes.
5 Discard supernatant and resuspend pellet in an appropriate amount of
PBS/BSA buffer.
(b) Tissue culture cell lines in suspension
1 Prepare PBS/BSA buffer (phosphate buffered saline pH 7.4 and 1% BSA).
2 Decant cells from tissue culture flask into 15 ml conical centrifuge tube(s).
3 Centrifuge at 400
g for 5 minutes.
4 Discard supernatant and resuspend pellet in 10 ml of PBS/BSA.
5 Centrifuge at 400
g for 5 minutes.
6 Discard supernatant and resuspend pellet in an appropriate amount of
PBS/BSA.
(c) Adherent tissue culture cell lines
1 Prepare PBS/BSA buffer (phosphate buffered saline pH 7.4 and 1% BSA).
2 Harvest cells by gentle scraping using 2 ml of PBS/BSA buffer.
3 Transfer cells to a 15 ml conical tube and add buffer up to 10 ml.
4 Centrifuge at 400
g for 5 minutes.
5 Discard supernatant and resuspend pellet in fresh PBS/BSA (10 ml).
6 Centrifuge at 400
g for 5 minutes.
7 Discard supernatant and resuspend pellet in an appropriate amount of
PBS/BSA buffer.
BSA Bovine Serum Albumin
Flow Cytometry ipl.qxd 11/12/06 11:15 Page 25

(d) Preparing cells from solid/lymphoid tissues
1 Place tissue on a sterile Petri dish. Remove cells by gently perfusing
the tissue using a syringe and needle containing approximately 15 ml
of PBS/BSA (phosphate buffered saline pH 7.4 and 1% BSA).
2 Transfer the cell suspension from the Petri dish into a 15 ml conical
centrifuge tube.
3 Centrifuge at 400
g for 5 minutes.
4 Discard the supernatant and resuspend the pellet in PBS/BSA.
5 Add 10 ml of ammonium chloride lysis buffer.
6 Mix and incubate for 2 minutes. DO NOT EXCEED THIS TIME.
7 Centrifuge at 400
g for 5 minutes.
8 Add 10 ml of PBS/BSA and mix.
9 Centrifuge again at 400
g for 5 minutes.
10 Discard the supernatant and resuspend the pellet to a final volume of
10 ml with PBS/BSA.
11 Count cells using a hemocytometer.
12 Adjust the cell suspension, if necessary, to give a final count of
0.7–1.2
× 10
7
cells/ml.
2
Direct immunofluorescence staining of cells and blood
This technique is applicable where the fluorochrome is directly linked to the
primary antibody e.g. PE, FITC and Alexa Fluor
®
conjugates.
Note. Specific methodology for blood appears in
[ ] brackets.
1 Prepare cells appropriately (see section 1). Adjust the cell suspension to a
concentration of 1
× 10
6
cells/ml with PBS/BSA buffer (phosphate
buffered saline pH 7.4 and 1% BSA).
[Whole blood samples may be used undiluted unless the cell count is high
e.g. as in leukemia. EDTA and heparin are preferred anti-coagulants].
2 Aliquot 100 µl of cell suspension
[whole blood] into as many test tubes
as required.
3 Add antibody at the recommended dilution (see specific datasheets).
Mix well and incubate at room temperature for 30 minutes.
4 Wash cells with 2 ml of PBS/BSA, centrifuge at 400
g for 5 minutes and
discard the resulting supernatant.
CHAPTER 4
26
Flow Cytometry ipl.qxd 11/12/06 11:15 Page 26

[To the blood suspension add freshly prepared red cell lysis buffer e.g. 2 ml of
AbD Serotec’s Erythrolyse and mix well. Incubate for 10 minutes at room
temperature. Centrifuge at 400 g for 5 minutes and discard the supernatant].
Resuspend cells in 0.2 ml of PBS/BSA or with 0.2 ml of 0.5%
paraformaldehyde in PBS/BSA if required.
Acquire data by flow cytometry. Appropriate standards should always be
included e.g. an isotype-matched control sample.
3
Indirect immunofluorescence staining of cells and blood
This technique is applicable where using unconjugated or biotin-conjugated
monoclonal and polyclonal antibodies. A secondary reagent must be used to
visualize the primary antibody e.g. avidin in the case of biotin.
Note. Specific methodology for blood appears in
[ ] brackets.
1
Prepare cells appropriately (see section 1). Adjust the cell suspension to a
concentration of 1
× 10
6
cells/ml with PBS/BSA buffer (phosphate
buffered saline pH 7.4 and 1% BSA).
[Whole blood samples may be used undiluted unless the cell count is high
e.g. as in leukemia. EDTA and heparin are preferred anti-coagulants].
2
Aliquot 100 µl of cell suspension
[whole blood] into as many test tubes
as required.
3
Add primary antibody at the recommended dilution (see specific
datasheets). Mix well and incubate at room temperature for 30 minutes.
4
Add 2 ml of PBS/BSA buffer, centrifuge at 400
g for 5 minutes and discard
the resulting supernatant.
5
Add an appropriate secondary reagent at the recommended dilution
(see specific datasheets). Mix well and incubate at room temperature for
30 minutes.
6
Wash cells with 2 ml of PBS/BSA, centrifuge at 400
g for 5 minutes and
discard the supernatant.
[To the blood suspension add freshly prepared red cell lysis buffer e.g.
2 ml of AbD Serotec’s Erythrolyse and mix well. Incubate for 10 minutes
at room temperature. Centrifuge at 400 g for 5 minutes and discard the
supernatant].
7
Resuspend cells in 0.2 ml of PBS/BSA or with 0.2 ml of 0.5%
paraformaldehyde in PBS/BSA if required.
8
Acquire data by flow cytometry. Appropriate standards should always be
included e.g. an isotype-matched control sample.
CHAPTER 4
27
AbD Serotec’s Erythrolyse (Product Codes BUF04 B/C)
Flow Cytometry ipl.qxd 11/12/06 11:15 Page 27

4
Staining lambda and kappa chains in whole blood
This method should be used with directly-conjugated dual-color reagents
recognizing human kappa and lambda immunoglobulin light chains.
Detection of immunoglobulin expression specifically on B lymphocytes
requires a procedure to remove blood serum immunoglobulins that would
otherwise cause interference.
1
Collect blood in an anti-coagulant e.g. EDTA, heparin or acid-citrate dextrose.
2
Aliquot 2–3 ml of whole blood into a 25 ml universal container. Then add
20–25 ml of PBS/BSA (phosphate buffered saline pH 7.4 and 1% BSA),
pre-warmed to 37
o
C, and mix well.
3
Centrifuge at 400
g for 5 minutes. Carefully aspirate the supernatant
taking care not to disturb the cell pellet. Resuspend the pellet in the
residual supernatant.
4
Repeat the wash (steps 2 and 3) twice.
5
Aliquot 100 µl of washed blood into the required number of test tubes.
Add antibody at the recommended dilution (see specific datasheet).
Mix well and incubate at room temperature for 30 minutes.
6
Add a red cell lysis buffer e.g. 2 ml of AbD Serotec’s Erythrolyse and mix
well. Incubate for 10 minutes at room temperature. Centrifuge at 400
g
for 5 minutes and discard the supernatant.
7
Wash cells with 2 ml of PBS/BSA, centrifuge at 400
g for 5 minutes and
discard the supernatant.
8
Resuspend cells in 0.2 ml of PBS/BSA or with 0.2 ml of 0.5%
paraformaldehyde in PBS if required.
9
Acquire data by flow cytometry. Appropriate standards should always be
included e.g. an isotype-matched control sample.
5
Whole blood protocol for analysis of intracellular
cytokines
This is a rapid and simple approach to the analysis of intracellular cytokines
by flow cytometry. It permits the analysis of small samples, and avoids any
possibility of generating artefactual results during the separation of
peripheral blood cells by density gradient centrifugation.
The stimulation conditions described are suitable for IFN gamma, IL-2 and
TNF alpha. Different conditions may be needed for other cytokines.
The procedure requires a reagent kit to fix and permeabilize cells. There are
several available but we recommend Leucoperm
TM
.
CHAPTER 4
28
Flow Cytometry ipl.qxd 11/12/06 11:15 Page 28

Note. All blood samples must be collected into heparin anti-coagulant. EDTA
interferes with the cell stimulation process and, therefore, must be avoided.
1
Aliquot 0.5 ml of blood separately into 2 tubes, then add 0.5 ml of cell
culture medium (without any additives) to each sample.
2
To one tube (the resting population), add monensin to a final
concentration of 3 mM.
3
To the other tube (activated cells), add PMA, ionomycin and monensin to
a final concentration of 10 ng/ml, 2 mM and 3 mM, respectively.
4
Incubate for 2–4 hours at 37
o
C in a 5% CO
2
atmosphere.
5
At the end of the incubation period aliquot 100 µl samples into the
appropriate number of tubes.
6
Add cell surface antibodies at this stage (if needed for your experiment)
and incubate for 15 minutes.
7
Add 100 µl of Leucoperm
TM
Reagent A per tube and incubate for
15 minutes. This reagent fixes cells in suspension.
8
Wash twice with PBS containing 0.1% sodium azide and 1% BSA.
9
Add 100 µl of Leucoperm
TM
Reagent B (permeabilizes cells) and the
required anti-cytokine antibodies.
10 Incubate for 20 minutes.
11 Wash twice using the PBS buffer, and analyze by flow cytometry.
6
Direct staining of intracellular antigens
The detection of intracellular antigens requires a cell permeabilization step
prior to staining. The method described below produces excellent results in
our hands; however other permeabilization techniques have been published,
and may also be successfully used for this application.
1
Harvest cells and determine total number present.
2
Wash twice in wash buffer (PBS containing 1% BSA and 0.1% sodium azide).
3
If required, perform staining of cell surface antigens using appropriate
directly conjugated monoclonal antibodies at this stage. Following
staining, wash cells once in PBS and discard the supernatant.
4
Resuspend cells in Leucoperm
TM
Reagent A (cell fixation agent) using
100 µl per 1
× 10
6
cells. Incubate for 15 minutes at room temperature.
CHAPTER 4
29
Leucoperm
TM
(Product Codes BUF09, BUF09 B/C)
PMA Phorbol 12-myristate 13-acetate
Flow Cytometry ipl.qxd 11/12/06 11:15 Page 29

5
Wash once in wash buffer.
6
Resuspend cells in Leucoperm
TM
Reagent B (cell permeabilization agent)
using 50 µl per 1
× 10
6
cells.
7
Aliquot 50 µl of cell suspension into the required number of tubes
containing directly-conjugated antibodies. Incubate for 30 minutes at
room temperature.
8
Wash once in wash buffer, and then resuspend in 0.25 ml of 0.5%
paraformaldehyde in PBS.
9
Store at 4
o
C until acquisition on the flow cytometer, preferably within
24 hours.
7
Direct staining of intracellular antigens: methanol method
Methanol modification is particularly suitable for the detection of some
nuclear antigens, such as PCNA and Ki-67.
Note. Phycoerythrin conjugates are not suitable for the detection of
cell surface antigens using this method.
1
Harvest cells and determine the total number present.
2
Wash twice in wash buffer (PBS containing 1% BSA and 0.1% sodium azide).
3. If required, perform staining of cell surface antigens using appropriate
directly conjugated monoclonal antibodies at this stage. Following
staining, wash cells once in PBS and discard the supernatant.
4
Resuspend cells in cold (2–8°C) Leucoperm
TM
Reagent A using 100 µl per
1
× 10
6
cells. Incubate for 10 minutes at 2–8°C.
5
Add 500 µl of cold absolute methanol, vortex and incubate for
10 minutes at 2–8°C.
6. Wash once in wash buffer.
7
Resuspend cells in Leucoperm
TM
Reagent B using 100 µl per 1
× 10
6
cells.
8
Aliquot 50 µl of cell suspension into the required number of tubes
containing directly conjugated antibodies. Incubate for 30 minutes at
room temperature.
9
Wash once in wash buffer, and resuspend in 0.25 ml of 0.5%
paraformaldehyde in PBS.
10 Store at 4
o
C until acquisition on the flow cytometer, preferably within
24 hours.
CHAPTER 4
30
PCNA Proliferating Cell Number Antigen
Flow Cytometry ipl.qxd 11/12/06 11:15 Page 30

5
Troubleshooting
CHAPTER 5
31
Chapter
If something doesn’t work check through the following list to resolve the
problem. If there are still difficulties and you have purchased an AbD Serotec
antibody our Technical Services Team will be happy to offer further advice.
Course of action
1 Ensure that all antibodies have been stored correctly according to
the manufacturer’s instructions.
2 Ensure that commercial antibodies have not exceeded their date
of expiration.
3 Ensure that appropriate primary or secondary antibodies have
been added.
4 Ensure that antibody is conjugated to a fluorochrome. If not,
ensure that appropriate fluorochrome-conjugated secondary is
being used.
5 Ensure that secondary antibody is active – has it been used
successfully with other primary antibodies?
6 Ensure that correct secondary antibody is being used, which will
recognize your primary antibody.
7 If the fluorochrome used is Phycoerythrin or Allophycocyanin-
based, ensure that the product has not been frozen.
8 Is the target antigen present on test tissue? Check literature for
antigen expression and incorporate a positive control of known
antigen expression alongside test material.
9 Does antibody recognize antigen in test species? Check that
antibody cross-reacts with species being used. Not all antibodies
will cross-react across species.
10 Ensure that correct laser is being used to excite fluorochrome, and
that correct channel is being used to analyze emissions.
1 PE conjugate may have been frozen. If so, purchase another vial
of antibody.
2 Paraformaldehyde (PFA) may be a problem. Breakdown of PFA
may release methanol, which will affect staining. Make up fresh
paraformaldehyde. Cells can be analyzed immediately without
fixing.
Problem
No staining
PE antibody does not stain
but same FITC antibody gives
good results
Flow Cytometry ipl.qxd 11/12/06 11:15 Page 31

CHAPTER 5
32
1 Non-specific staining may be due to autofluorescence. Solution:
check levels of autofluorescence by including a tube of cells only
(i.e. without any antibody) into your panel.
2 Certain cells express low affinity Fc receptors CD16/CD32, which
bind whole antibodies via Fc region. For mouse cells, dilute
antibody in SeroBlock FcR (Product Codes BUF041 A/B).
3 Non-specific staining may be due to the secondary antibody.
Select a secondary antibody that will not cross-react with target
tissue.
4 Ensure that sufficient washing steps have been included.
5 Titrate test antibody carefully. Non-specific staining may be
reduced at lower antibody concentrations.
1 Weak staining may be due to overdilution of antibodies. Ensure
that antibodies are used at the correct concentration by titrating
antibodies before use.
2 Weak staining in indirect staining systems may be due to
prozoning effect, where highly concentrated antibodies may give
weak results. Titrate antibodies carefully.
3 Weak staining may be due to an excess cell number. Adjust cell
population to recommended density.
4 Weak staining may be due to the antigen expression. Check
literature for expected levels of expression.
5 If antigen expression is weak, select an antibody that is
conjugated to a brighter fluorochrome.
6 Weak staining may be seen if using a cross-reacting antibody
rather than one specific for the target species.
7 Incubation time and temperature with either primary or
secondary antibody should be optimized.
1 Ensure that cells are used as fresh as possible. Profile may be
showing dead cells and debris.
2 Activation methods may affect scatter characteristics of cells.
3 If you are using lysing solution, ensure that this is fresh and has
been made up correctly.
1 Some reagents may affect certain antigens and, therefore, may
need reviewing e.g. EDTA will affect some platelet markers.
2 Lysing solutions may affect certain antigens. Select a method that
does not interfere with antigen detection.
3 Some antigens are expressed intracellularly and, therefore, cell
permeabilization methods may be required. Check manufacturer’s
datasheet for correct permeabilization reagent.
Weak staining
Unusual scatter profiles
Unexpected staining
Non-specific staining
Flow Cytometry ipl.qxd 11/12/06 11:15 Page 32

33
Recommended reading
Flow Cytometry: A Practical Approach, 3rd Edition. (Practical Approach Series).
Edited by M.G. Ormerod. Oxford University Press (2000)
Flow Cytometry: Clinical Applications.
Marion G. Macey. Blackwell Scientific Publications, Oxford (1994)
Flow Cytometry: First Principles, 2nd Edition.
Alice L. Givan. Wiley (2002)
The Handbook – A Guide to Fluorescent Probes and
Labeling Technologies, 10th Edition.
Richard P. Haugland. Invitrogen – Molecular Probes (2005)
Immunophenotyping. Carleton C. Stewart and Janet K.A. Nicholson, Editors.
John Wiley & Sons (2000)
Introduction to Flow Cytometry, First Paperback Edition.
James V. Watson. Cambridge University Press. (2004)
Practical Flow Cytometry, 4th Edition.
Howard M. Shapiro. Wiley Liss (2003)
Alexa Fluor
®
and Pacific Blue™ are trademarks of Molecular Probes Inc., OR, USA
Leucoperm
TM
is made for AbD Serotec by AN DER GRUB Bio Research GmbH
FACS
TM
(Fluorescence Activated Cell Sorter) is a trademark of Becton, Dickinson and Company, CA, USA
Flow Cytometry ipl.qxd 11/12/06 11:15 Page 33

Serotec Ltd Scandinavia
(Scandinavia & Baltic States)
Tel: +47 62 52 92 77
Email: sales.no@ab-direct.com
Serotec Inc
(USA & Canada)
Toll Free: 1-800-265-7376
Email: sales.us@ab-direct.com
Serotec Ltd
(UK, Ireland & worldwide)
Tel: +44 (0)1865 852700
Email: sales@ab-direct.com
Serotec GmbH
(Germany, Austria, Switzerland & Netherlands)
Tel: +49 (0)211 93 503 10
Email: sales.de@ab-direct.com
Serotec Ltd (France)
Tel: +33 1 34 25 83 34
Email: sales.fr@ab-direct.com
Your first choice for antibodies!
www.ab-direct.com
LIT.FLOW.MAR.2006.1 © Copyright Serotec Ltd 2006. All rights reserved. Published by Serotec Ltd. Endeavour House, Langford Business Park,
Langford Lane, Kidlington, Oxford OX5 1GF, UK. For research purposes only. Not for therapeutic or diagnostic use.
Flow Cytometry ipl.qxd 11/12/06 11:15 Page 34
Wyszukiwarka
Podobne podstrony:
derivation flow equation prof J Kleppe
Cytometria przepływowa
Power Source Current Flow Chart
cytometria przepływowa
brochure axial flow jan12
JBAIIC EC 08 Tactical Picture Flow 01 May 2008
Analiza finansowa AZF, ANSF03, ˙wiatowe standardy dopuszczaj˙ stosowanie metody bezpo˙redniej i po˙r
MATERIALY DO CWICZENIA BIOLOGIA CYTOMETR
cytomegalia wrodzona, Choroby zakaźne
cytometria w ostrych bia
2 Kontrola cytometruid 20477 ppt
cytometria w weterynarii
Flow pack poziomy
Jak osiągnąć stan flow (1)
Podstawy cytometrii przeplywowej oznaczanie subpopulacji komorek
Java for Beginners by Knowledge flow
Money Flow Index, giełda(3)
więcej podobnych podstron