
doi:10.1016/j.gca.2004.01.003
Trace element incorporation into quartz: A combined study by ICP-MS, electron spin
resonance, cathodoluminescence, capillary ion analysis, and gas chromatography
J
ENS
G ¨
OTZE
,
1,
* M
ICHAEL
P
L
¨
OTZE
,
2
T
ORSTEN
G
RAUPNER
,
3
D
IETER
K
LAUS
H
ALLBAUER
,
4
and C
OLIN
J. B
RAY
5
1
TU Bergakademie Freiberg, Department of Mineralogy, Brennhausgasse 14, D-09596 Freiberg, Germany
2
ETH Zu¨rich, IGT ClayLab, CH-8093 Zu¨rich, Switzerland
3
Universita¨t Wu¨rzburg, Department of Mineralogy, Am Hubland, D-97074 Wu¨rzburg, Germany
4
University of Stellenbosch, Department of Geology, Private Bag X1, Matieland 7602, Republic of South Africa
5
University of Toronto, Department of Geology, 22 Russell Street, Toronto, Ontario, M5S 3B1, Canada
(Received March 19, 2003; accepted in revised form January 6, 2004)
Abstract—Pegmatite quartz from different occurrences in Norway and Namibia was investigated by a
combination of ICP-MS, Electron Spin Resonance (ESR), Capillary Ion Analysis (CIA) and Gas Chroma-
tography (GC) to quantify trace elements in very low concentrations and to determine their position in the
quartz structure.
The studied quartz samples show similar geochemical characteristics with low contents of most trace
elements. Remarkable are the elevated concentrations of Al (36 – 636 ppm), Ti (1.6 –25.2 ppm), Ge (1.0 –7.1
ppm), Na (5.2 to
⬎50 ppm), K (1.6 to ⬎100 ppm) and Li (2.1–165.6 ppm). These elements are preferentially
incorporated into the quartz lattice on substitutional (Al, Ti, Ge) and interstitial (Li, Na, K) positions. Li
⫹
was
found to be the main charge compensating ion for Al, Ge and Ti, whereas some ppm of Na and K may also
be hosted by fluid inclusions. Ti may be incorporated as substitutional ion for Si or bound on mineral
microinclusions (rutile). The results of the ESR measurements show that there may be a redistribution of alkali
ions during irradiation. The diamagnetic [AlO
4
/M
⫹
]
0
center transforms into the paramagnetic [AlO
4
]
0
center,
whilst the compensating ions diffuse away and may be captured by the diamagnetic precursor centers of
[GeO
4
]
0
and [TiO
4
]
0
to form paramagnetic centers ([TiO
4
/Li
⫹
]
0
, [GeO
4
/Li
⫹
]
0
).
In general, fluid inclusions in pegmatite quartz can be classified as H
2
O-CO
2
-NaCl type inclusions with
water as the predominant volatile. Among the main elements hosted by fluid inclusions in quartz are Na, K,
NH
4
, Ca, Mg and the anionic complexes Cl
⫺
, NO
3
⫺
, HCO
3
⫺
and SO
4
2
⫺
. Gas analysis of trapped fluids shows
volatile components in the following order of abundance: H
2
O
⬎ CO
2
⬎ N
2
(
⫹) ⱖ CH
4
⬎ COS ⬎ C
2
and
C
3
hydrocarbons. Additionally, traces of Co, Ni, Zn, Pb, and Cu were detected by CIA in fluid inclusions of
some samples. There are indications that the REE and Rb are also bound in fluid inclusions, however, the
concentrations of these elements are too low to be measured by CIA. Assuming that the REE preferentially
occur in fluid inclusions, the typical chondrite normalized REE distribution patterns with tetrad effects and a
distinct negative Eu anomaly would reflect the composition of the mineralizing fluid.
For a number of elements, especially those with extremely low concentrations, the “type” of incorporation
in quartz could not directly be determined. We conclude that these ions either are too large to substitute for
the small Si
4
⫹
ion or they are not soluble in the mineralizing fluids to be hosted by fluid inclusions. Some of
these elements, which are concentrated in the specific mineralization of certain pegmatites, are not present in
elevated concentrations in the paragenetic pegmatite quartz itself. This was observed, for instance, for Be, Cs
and Rb in the Li (Be-Cs-Rb) pegmatites of Rubicon or for Nb and Ta for Nb-Ta bearing pegmatites from
Norway. It may be concluded that the concentrations of these trace elements in quartz do not reflect the
mineralization and that these elements thus, cannot be used as petrogenetic indicator.
Copyright © 2004
Elsevier Ltd
1. INTRODUCTION
Trace elements in minerals are considered important petro-
genetic indicators for interpreting the conditions of mineral
formation, to reveal the provenance of minerals, or to recon-
struct the genesis of ore deposits and the origin of metal-
bearing fluids. Because of the widespread occurrence of quartz
in igneous, metamorphic and sedimentary rocks, several at-
tempts have been made to use trace elements for genetic
interpretations (e.g.,
Bambauer, 1961; Dennen, 1964, 1966,
For detailed interpretation, different mechanisms of trace
element uptake into the quartz lattice have to be discussed.
Trace elements in quartz may generally be incorporated into the
crystal structure or bound to microinclusions (fluid or mineral
inclusions). Due to its structure and the small size of the Si
4
⫹
ion (0.42 A
˚ ), quartz is considered to incorporate only small
amounts of “foreign” elements into its crystal lattice. The
substitutional incorporation of Al, Ge, Ti, Ga, Fe, H and P into
the Si position is well established (e.g.,
). If
necessary, the charge deficit is compensated by cations, which
are distributed in structural channels parallel to the c-axis.
Cations which were detected on interstitial lattice positions are
* Author to whom correspondence should be addressed (goetze@
mineral.tu-freiberg.de).
Pergamon
Geochimica et Cosmochimica Acta, Vol. 68, No. 18, pp. 3741–3759, 2004
Copyright © 2004 Elsevier Ltd
Printed in the USA. All rights reserved
0016-7037/04 $30.00
⫹ .00
3741

commonly the alkali ions Li
⫹
, Na
⫹
, K
⫹
and H
⫹
, but also
include the ions of Cu, Ag, Al, Fe, Ti, Co, Cr, Ni (
For most elements in quartz, however, their capture by
microinclusions is most important (
suggested that only Al, B, Ge, Fe, H, K, Li, Na, P
and Ti are structurally incorporated, whereas Ca, Cr, Cu, Mg,
Mn, Pb, Rb and U occur in solid and liquid inclusions.
proved that Sr, Rb, Sm, Nd are mostly not
structurally incorporated into quartz and discussed the role of
fluid inclusions in hosting these elements.
showed a strong correlation of the elements Cl, Br, Na, Ca, Sr,
and Mn with the water content of fluid inclusions and con-
cluded that up to 100% of Cl, Br and I may be concentrated
there. Other elements which were detected in fluid inclusions of
quartz are Ag, Au, K, Li, F, Mg, Ba, Cs, B, Hg, Fe, Co, Cu, Pb,
Sb, Zn and U (e.g.,
Czamanske et al., 1963; Susˇcevskaya et al.,
). On the other hand,
found
that the elements K, Cs, Rb, Fe, Cr, Co, Al, Ba, Sc, W, U and
the REE can also be related to microscopic mineral inclusions
in quartz. This illustrates that the mechanisms of incorporation
may be variable, even for a specific element in a single crystal.
In general, it is difficult to quantify the amounts of differ-
ently incorporated trace elements, and it is impossible if only
one analytical method is used. Therefore, an attempt was made
in the present study to quantify the distribution of trace ele-
ments in quartz by a combination of ICP-MS, Capillary Ion
Analysis (CIA) and Electron Spin Resonance (ESR). ICP-MS
is a powerful method for the detection of the very low concen-
trations of many trace elements in bulk quartz specimens. CIA
can be applied to the analysis of a wide variety of cations and
anionic complexes in fluids in the lower ppb range. Thus, this
method enables to reveal separately the trace element concen-
trations bound in fluid inclusions of minerals. The application
of ESR enables the detection of such trace elements, which are
incorporated into the quartz lattice forming a paramagnetic
center. The combination of these methods provides more in-
formation about the mechanism of trace element uptake in
quartz than application of any single method could.
2. MATERIALS AND METHODS
2.1. Sample Material
The material investigated includes 18 samples of pegmatite quartz
from Norway and Namibia (
). Quartz from pegmatites was
selected to obtain enough sample material of pure quartz for the
different analytical techniques.
Both quartz and smoky quartz were sampled from the pegmatite
bodies of Frikstadt, Skavdalen, Brattekleiv, Vanne, Steli near Dalane
and Li, which all belong to the pegmatite complex of Evje-Iveland in
Southern Norway (
). The igneous activity in this region
took place
⬃1250 Ma ago and was associated with crustal extension
and formation of basic and felsic igneous rocks (
Large-scale emplacement of posttectonic undeformed plutons took
place at ca. 1000 Ma with massive granite, monzonite and diorite
emplacement. Geochronological studies of the Evje-Iveland pegmatites
provided an age of 852
⫾ 12 Ma based on Rb-Sr dating of K-feldspar
). The bodies of granitic pegmatites in Evje-Iveland
comprise classical zoned “chamber” pegmatites that mostly crystallized
as subvertical or subhorizontal dikes or sills, respectively (
). They rarely exceed 20 m in thickness and have lateral extent of
less than 100 m. It was suggested that the coarse-grained granitic
pegmatites of Evje-Iveland formed from progressively more differen-
tiated melts that were emplaced in a southward-propagating system of
vertical and horizontal faults and fractures within mafic host rocks
(amphibolite, norite, mafic gneiss) (
). The samples repre-
sent different localities of quartz in one pegmatite province, consisting
above all of quartz-feldspar(-mica) pegmatites that have partly REE-
Nb-Ta-Be (e.g., gadolinite, beryl, monazite, allanite, tantalite, magne-
tite, spessartine) mineralization.
Additional samples were taken from the quartz-feldspar pegmatite of
Drag, Norway and the pegmatite of Hitterø, Norway, which are char-
acterized by Nb-Ta(-Th) mineralization (
). The locality
of Drag is situated in the Tysfjord area in the northern part of Norway.
The pegmatite body was formed
⬃1800 million years ago, when
granites intruded 2500 Ma old gneisses. The zoned pegmatite of Drag
developed from a mixed pegmatite of feldspars, quartz and mica to
smoky quartz and coarse grained, pure quartz; the latter is partly
associated with fluorite (
). The granitic pegmatite of Hitterø on
Hidra Island belongs to the
⬃930 Ma old Rogaland anorthosite prov-
ince. Recent results have indicated that the melts of this large Protero-
zoic igneous complex derived from lower continental crust (
Schiellerup
Table 1. Pegmatite samples from different occurrences selected for the present study.
Sample
Location
Mineralization
Microscopic characteristics
Qz1a
quartz
Frikstad
quartz, feldspar, mica,
bottle-green cathodoluminescence (CL)
Qz1b
smoky quartz
Evje-Iveland, Norway
Nb/Ta, REE, gadolinite, garnet
bottle-green CL, subcrystals
Qz2a
quartz
Skavdalen
quartz, feldspar (graphic granite),
homogeneous bluish-green CL, fluid trails
Qz2b
smoky quartz
Evje-Iveland, Norway
monazite, garnet
homogeneous bluish-green CL, fluid trails
Qz3a
quartz
Brattekleiv
quartz, feldspar (amazonite),
bluish-green CL with dark fluid trails
Qz3b
smoky quartz
Evje-Iveland, Norway
beryl, Nb/Ta, garnet
bluish-green CL with dark fluid trails
Qz4a
quartz
Våanne
quartz, feldspar, mica,
homogeneous bottle-green CL, subcrystals
Qz4b
smoky quartz
Evje-Iveland, Norway
monazite, garnet
homogeneous bottle-green CL, fluid trails
Qz5a
quartz
Steli near Dalane
quartz, feldspar, mica, monazite,
homogeneous bottle-green CL
Qz5b
smoky quartz
Evje-Iveland, Norway
garnet (pseudomorphs after mica)
homogeneous bluish CL, chlorite
Qz6a
quartz
Li
feldspar (perthitic),
homogeneous bluish green CL, rutile
Qz6b
smoky quartz
Evje-Iveland, Norway
quartz
bluish-green CL, fluid trails, chlorite
Qz7a
quartz
Drag
quartz, feldspar (amazonite), mica,
greenish-blue CL, subcrystals, biotite
Qz7b
smoky quartz
Norway
fluorite, garnet, Nb/Ta, REE
homogeneous greenish-blue CL
Qz9a
quartz
Hittero
Hitra, Norway
quartz, feldspar, mica, Nb/Ta, Th, REE
bluish-green CL, fluid trails
Qz15a
quartz
Rubicon Mine
quartz, feldspar, (Li-) muscovite,
bluish CL, brighter luminescing fluid trails
Qz15b
smoky quartz
Namibia
petalite, lepidolite, garnet,
bluish CL, brighter luminescing fluid trails
Qz15c
rose quartz
amblygonite, columbite
bluish CL, brighter luminescing fluid trails
3742
J. Go¨tze et al.

). The mineralization of the pegmatite includes, besides
quartz, feldspars and mica, also Nb/Ta-, Th- and REE minerals.
Furthermore, material (quartz, smoky quartz and rose quartz) from
the Rubicon mine, located 30 km SE of Karibib, Namibia, was studied.
This pegmatite represents a group of Li-Cs-Be-Rb pegmatites that
belong to the Okongava granite, which intruded at 515 Ma ago (ca. 720
Ma) diorites of the Damara complex. Field observations and results of
mineralogical investigations indicated that the genesis of these pegma-
tites can be related to dome structures and diorites of the Goas Suite
(
). The gently dipping pegmatites developed from a prob-
ably prefractionated fluid-rich granite and occur on the margin of
diorites, which could have acted as a barrier for the fluids. Although the
pegmatites, in general, reached a high degree of alkali fractionation
(e.g., petalite, pollucite mineralization), the pegmatite of Rubicon itself
does not show intensive fractionation trends, which was interpreted to
reflect continuous metasomatic processes at high temperatures (
). In
the main mineralizations of the sampled pegmatites
are summarized.
The preparation of pure quartz samples was preceded by mineralog-
ical investigations on thin sections to reveal impurities in the quartz
material to be analyzed and to study possible internal structures. Fea-
tures such as strain domains, subgrain boundaries, and others, may
indicate areas of enhanced accommodation of fluid and mineral inclu-
sions. Polished thin sections were investigated by conventional polar-
ized microscopy, cathodoluminescence (CL) microscopy (hot-cathode
CL microscope HC1-LM), and scanning electron microscopy (SEM)
using a JEOL 6400 with a Noran EDX detector. The CL technique
proved to be particularly useful to identify minute inclusions of apatite,
fluorite, calcite and feldspar, because of their bright CL and character-
istic luminescence colors. The search for sheet silicates and Fe-Ti
oxides was done by SEM. The studies confirmed that the specimens
mainly consist of large zones of pure quartz that could be sampled by
hand-picking. Solid inclusions other than rutile are rare in the samples.
Rutile may occur as minute submicron-thick needles, which are dis-
persed throughout the quartz. Additionally, tiny inclusions of chlorite
(in sample Qz5b/6b), pyrophyllite (Qz6b), biotite and fluorite (Qz7a)
were detected; these were always arranged outlining secondary micro-
cracks. The quartz samples were crushed in an agate mortar, and pure
quartz grains without visible impurities were hand-picked under a
binocular microscope. The separated fractions were repeatedly washed
with 2 mol/L nitric acid and ultrapure water, and then air dried.
2.2. Analytical Procedure
The samples (400 –500 mg) for ICP-MS analysis were milled to a
grain size of
⬃30
m using a precleaned agate mortar. The powdered
sample was digested in a glassy carbon vessel with 5 mL concentrated
HF and 3 mL concentrated HNO
3
at 50°C (35 min). Rhenium solution
(1 mL of 100
g/L concentration) was added as an internal standard for
the ICP-MS measurements. The analysis was performed using a Perkin
Elmer Sciex Elan 5000 quadrupole instrument with a cross-flow neb-
ulizer and a rhyton spray chamber. The precision and accuracy of the
ICP-MS measurements were evaluated by analysis of the glass sand
reference material UNS-SpS. The relative standard deviations for most
analytes were below 10%. The ICP-MS results showed procedural
limits of detection ranging from 0.22 to 3.1
g L
⫺1
for Na, Mg, Al, K,
Ca and Ba. Elements such as Li, Mn and Sr had procedural limits of
detection of 0.02 to 0.04
g L
⫺1
, whereas these limits range from 1 to
7 ng L
⫺1
for the other elements investigated (
Fluid inclusions were examined using a Linkam THMS 600 heating-
freezing stage. Two synthetic fluid inclusion standards (SYN FLINC;
pure H
2
O, mixed H
2
O-CO
2
) were used to calibrate the equipment. The
precision of the system was
⫾2 °C for homogenization temperatures
(Th), and
⫾0.2 °C in the temperature range between ⫺60 and ⫹10 °C.
Analysis of trace elements in fluid inclusions was carried out by
Capillary Ion Analysis (CIA). The separation of different cations and
anionic complexes for analysis is based on the different electrophoretic
mobilities of the hydrated or complexed species, or their charge/mass
ratio in an electrolyte moving through a fused silica capillary in an
electric field. The detection is accomplished at the end of the capillary
by indirect UV detection (
CIA analyses were carried out using a WATERS Quanta 4000
instrument coupled with a digital to analog converter for computer-
aided data processing. Sampling of the UV detector output was set at
50 Hz intervals or 0.02 s intervals. All quantitative calculations are
based on peak area integrations. Detection limits in the ppb region can
be achieved using the electromigration mode (
A specific procedure for the extraction of fluid inclusions from
samples by crushing and leaching had to be designed because of the
behavior of fluid inclusions and the adsorption and consequent loss of
ionic species onto fresh fracture surfaces (
Bottrell et al., 1988; Yardley
). In the present study a crush and leach method, with
leaching in 2.5 mL of MQ water with Tetrabutylammonium Hydroxide
(TBA) with subsequent pass through a 0.47
m membrane filter, was
used (
). Deionized water supplied by a Milli-Q system
(Millipore, Bedford, MA, USA) was used for these experiments. The
water blank is routinely checked for contamination and varied between
0.5 and 1 ppb K, Na and Ca. A 10 mM pyridine electrolyte was used
for cation separations (60 cm capillary, 25 kV separation voltage) with
25 mM glycolic acid as a general complexing agent, resulting in a pH
value of
⬃4.5. To separate the comigrating cations of K and NH
4
, a
further addition of 1 mM “crown” ether (
) for
complexation of K cation was found to be sufficient.
For the determination of anionic species a separate capillary was
used and specially conditioned for use with an osmotic flow modifier
(OFM). A convenient co-ion and chromofore is chromate (
), which was prepared from sodium chromate tetra hydrate
as a 5 mM solution with a pH of
⬃8.0, adjusted by sulfuric acid. Best
separations were achieved at
⬃20 kV.
CL spectra were obtained on carbon-coated polished thin sections
using a CL microscope with an EG&G digital triple-grating spectro-
graph and a liquid nitrogen cooled CCD detector in the range 380 –
1000 nm (VIS-IR). To prevent distortion of the spectra by prolonged
exposure to the electron beam, all spectra were taken on nonirradiated
sample spots. Time-resolved (20
⫻ 5 s) CL spectra were measured on
selected samples to study the CL behavior of the minerals during
electron irradiation. In addition, spectral CL investigations were carried
out using a JEOL JSM 6400 SEM equipped with an Oxford MonoCL
system over the range 200 – 800 nm (UV-VIS). For CL investigations,
the accelerating voltage was set at 20 kV and the beam current in the
range 0.6 –1.6 nA.
Bulk volatile compositions of fluids trapped in inclusions were
analyzed by gas chromatographic (GC) analysis (
). A sample mass of
⬃1.2 g was used. To quantify
trace element ratios measured by CIA and to calculate the salinity of
the extracted fluids, the water content in the samples was calculated
using the results of the gas chromatographic analysis.
The paramagnetic centers of irradiated quartz powder samples were
investigated by Electron Spin Resonance (ESR) at frequencies of the
X-band (9.5 GHz) at 70 and 295 K. The quartz grains were carefully
crushed to a size
⬍ 200
m, in an agate mortar under ethanol and dried
at 25 °C. The samples were
␥-irradiated (
60
Co, 295 K, 1.4
⫻ 10
4
Gy
⫾
10%) to transform the trace element defects from the nonparamagnetic
precursor state into paramagnetic centers. Center saturation was
achieved at 1
⫻ 10
4
Gy for [GeO
4
⫺
/M
⫹
]
0
and [TiO
4
⫺
/Li
⫹
]
0
and at 1
⫻ 10
6
Gy for [AlO
4
]
0
Plo¨tze, 1995; Plo¨tze and Wolf, 1996
). Before
irradiation, the samples were heated at 400 °C for 5 h to anneal the
paramagnetic centers formed by natural irradiation. Spectra were re-
corded with a Bruker cw-spectrometer (ESP300E and ElexSys E500,
respectively). Sample temperature was controlled with a low temper-
ature unit based on a helium gas flow device (Oxford ESR 900A). The
influence of technical parameters such as modulation amplitude, mi-
crowave power, temperature, scan time, etc., on the spectra was
checked for the optimal settings for recording the spectra. These
settings (sample mass 150 mg, modulation field H
M
⫽ 1 G, temperature
T
⫽ 295 K, microwave power p ⫽ 10 mW for Fe
3
⫹
and [GeO
4
⫺
/M
⫹
]
0
centers and H
M
⫽ 1 G, p ⫽ 7 mW, T ⫽ 70 K for [AlO
4
]
0
and
[TiO
4
⫺
/Li
⫹
]
0
centers) were kept constant throughout all the measure-
ments to allow comparison between the signal intensities of different
spectra. The concentrations of the paramagnetic centers were deter-
mined as peak to peak or peak to base intensity at the analytical lines
(
). The specific peak positions of the paramagnetic
centers were drawn from simulated spectra and from data from the
literature. The program of
was used for
the powder spectra simulations. The variation of intensity detected by
repeated measurements of selected analytical lines is up to 10%. The
3743
Trace element incorporation into quartz

concentration of Al centers was quantified using a reference sample
with known [AlO
4
]
0
concentration (
). All other centers
were calculated in relative amounts.
3. RESULTS
3.1. Bulk Trace Element Composition
In general, quartz of pegmatitic origin is characterized by
uniform geochemical characteristics with low contents of most
trace elements (
and
). Remarkable are the elevated
concentrations of Al (41– 636 ppm), Ti (0.3–25.2 ppm), Ge
(1.0 –7.1 ppm), Na (5.2 to
⬎50 ppm), K (1.6 to ⬎100 ppm) and
Li (2.1–165.6 ppm). A characteristic feature of quartz from
pegmatites is a high Ge/Fe ratio (4.5– 0.1) compared to quartz
samples of other origin. According to
quartz of early crystallization stages is characterized by low
Ge/Fe ratios (high iron content), whereas this ratio is high in
quartz of late generations. Therefore, pegmatitic mineralization
has in general high Ge and low Fe contents and may show
Table 2. Trace-element composition of investigated quartz samples from pegmatites (results in ppm).
a
1a
1b
2a
2b
3a
3b
4a
4b
5a
5b
6a
6b
7a
7b
9a
15a
15b
Ag
0.019
0.003
0.003
0.002
0.002
0.008
0.017
0.011
0.002
0.002
0.001
0.001
0.001
0.011
0.001
0.002
0.001
Al
518
129
112
262
106
65
201
78
106
143
134
178
41
36
64
636
324
B
13.7
0.52
0.41
0.35
0.54
0.51
1.03
0.44
0.26
0.36
0.39
0.82
0.68
0.61
0.27
1.72
0.59
Ba
1.49
0.46
0.39
0.39
0.49
0.39
0.54
0.65
0.31
0.31
0.46
0.37
0.27
0.46
0.37
0.47
0.13
Be
0.22
0.14
0.18
0.38
0.16
0.15
0.39
0.26
0.11
0.18
0.03
0.34
0.13
0.06
0.12
0.37
0.06
Ca
31.9
10.4
11.2
9.54
8.34
7.38
30.8
17.6
10.5
6.78
8.07
13.5
6.04
7.01
20.4
8.34
8.59
Cd
0.007
0.001
0.002
0.002
0.002
nd
0.015
0.011
0.003
0.004
0.004
0.007
0.003
0.008
0.002
0.004
0.002
Co
0.052
0.026
0.017
0.027
0.022
0.022
0.027
0.028
0.008
0.007
0.012
0.007
0.006
0.011
0.008
0.011
0.027
Cr
0.86
0.16
0.16
1.09
0.51
0.18
0.39
0.27
0.09
0.08
0.12
0.11
0.11
0.18
0.09
0.16
0.09
Cs
2.03
0.28
0.043
0.019
0.21
0.17
1.84
0.15
0.003
0.021
0.009
1.12
0.004
0.006
0.034
0.045
0.048
Cu
4.29
1.35
0.72
0.69
0.62
11.9
4.52
3.98
0.76
0.91
1.12
0.59
0.45
1.53
0.32
1.09
2.99
Fe
nd
1.26
1.45
5.68
2.09
1.15
nd
3.75
2.17
5.11
2.26
2.95
5.42
13.6
5.73
6.46
3.41
Ga
0.062
0.019
0.034
0.066
0.026
0.039
0.27
0.046
0.038
0.026
0.024
0.059
0.022
0.024
0.018
0.053
0.017
Ge
7.12
5.67
1.42
2.03
3.24
2.57
2.05
3.44
1.49
1.66
0.97
2.79
1.59
1.24
1.89
5.58
5.15
Hf
0.006
0.005
nd
nd
nd
nd
0.029
nd
nd
nd
nd
nd
nd
nd
nd
nd
0.003
K
24.3
4.91
9.12
⬎100
11.2
6.63
⬎100
9.04
7.51
⬎100
5.35
29.8
4.53
5.02
6.81
2.37
1.64
Li
33.9
26.1
11.5
8.41
4.92
8.52
3.33
6.06
17.9
6.81
6.54
24.1
6.47
2.96
2.09
165.6
56.4
Mg
8.77
1.65
1.77
2.27
1.29
1.08
15.7
8.58
1.99
1.79
1.88
1.55
1.04
1.57
1.47
1.27
0.74
Mn
1.15
0.34
0.37
0.66
0.31
0.25
3.24
0.44
0.27
0.25
0.23
1.41
0.15
1.03
0.64
0.37
0.14
Na
30.3
9.78
12.3
13.4
19.1
11.2
⬎50
13.1
10.3
14.9
8.61
⬎50
4.14
12.1
⬎50
5.89
5.16
Nb
0.12
0.005
0.009
0.012
0.005
0.004
0.23
nd
0.015
0.031
0.003
0.012
0.009
0.006
nd
nd
nd
Ni
6.35
2.96
1.18
1.94
2.13
1.66
2.69
3.75
1.28
1.01
1.78
0.94
0.82
1.45
1.37
1.64
5.56
Pb
0.78
0.15
0.31
0.31
0.16
0.36
0.61
0.52
0.11
0.13
0.14
0.34
0.44
0.19
0.11
0.17
0.08
Rb
0.91
0.12
0.19
0.26
0.29
0.04
7.36
0.22
0.03
0.25
0.03
1.27
0.05
0.061
0.13
0.029
0.009
Sb
0.025
0.038
0.009
0.008
0.093
0.114
0.083
0.019
0.003
0.038
0.003
0.084
0.026
0.012
0.005
0.098
0.037
Sc
0.006
nd
nd
nd
nd
nd
nd
nd
0.003
0.002
nd
0.003
0.036
nd
nd
nd
nd
Sn
0.12
0.19
0.034
0.043
0.031
1.13
0.11
0.039
0.021
0.038
0.027
0.029
0.031
0.054
0.018
0.016
0.017
Sr
0.29
0.13
0.077
0.058
0.12
0.083
0.11
0.11
0.044
0.059
0.081
0.14
0.033
0.091
0.55
0.045
0.037
Ta
0.14
0.005
nd
nd
nd
nd
0.25
nd
0.003
0.002
nd
0.006
0.011
nd
nd
nd
nd
Th
0.026
0.003
0.003
0.004
0.004
0.003
0.036
0.003
0.004
0.114
0.011
0.008
0.004
0.011
0.002
0.001
0.002
Ti
10.3
3.62
14.5
22.1
5.28
8.66
14.5
13.1
5.59
4.55
24.4
25.2
6.35
2.05
8.68
1.59
0.34
U
0.018
0.011
0.008
0.004
0.006
0.003
0.044
0.001
0.008
0.014
0.003
0.008
0.004
0.012
0.006
0.0008
0.0023
V
0.075
0.009
0.013
nd
0.016
0.009
0.049
0.026
0.009
0.009
0.009
0.009
nd
nd
nd
nd
nd
Y
0.043
0.012
0.009
0.008
0.029
0.016
0.079
0.011
0.008
0.039
0.006
0.025
0.007
0.019
0.16
0.0045
0.0026
Zn
2.64
0.76
0.54
0.64
0.55
0.51
4.06
2.01
0.76
3.84
0.81
0.71
0.46
0.79
0.55
1.17
1.63
Zr
0.18
0.05
0.02
0.02
0.03
0.03
0.13
0.039
0.018
0.012
0.018
0.015
0.016
0.024
0.005
0.012
0.028
a
nd
⫽ below detection limit.
Table 3. Concentrations of REE (in ppb) and chondrite-normalized interelemental ratios of the investigated quartz samples.
a
1a
1b
2a
2b
3a
3b
4a
4b
5a
5b
6a
6b
7a
7b
9a
15a
15b
15c
La
62.2
16.1
15.9
12.5
17.1
14.9
32.4
14.4
9.7
55.4
15.2
19.1
6.2
10.3
10.3
7.8
4.3
5.1
Ce
134
31.1
30.9
27.4
43.2
36.3
96.8
33.2
24.1
162
31.4
40.8
15.2
14.3
33.2
16.2
7.2
9.9
Pr
11.8
2.1
2.4
2.1
3.8
2.8
13.1
2.8
1.9
22.4
3.5
3.9
1.3
2.1
4.1
1.3
0.7
0.9
Nd
42.6
7.1
9.1
6.2
13.9
9.8
53.1
8.6
6.2
93.9
13.2
13.0
4.0
6.8
16.8
3.7
2.0
2.9
Sm
8.8
1.5
1.4
1.2
3.8
2.5
23.4
2.1
0.8
32.8
2.8
3.2
1.2
1.4
8.0
0.8
0.5
0.7
Eu
1.6
0.2
0.2
0.2
0.3
0.2
0.3
0.1
0.06
0.1
0.1
0.1
0.1
0.2
0.9
0.1
0.06
0.1
Gd
9.5
1.6
1.2
1.2
3.3
1.9
19.1
1.7
1.0
18.1
1.7
3.3
1.0
1.9
11.6
0.5
0.3
0.5
Tb
1.7
0.3
0.3
0.2
0.7
0.4
3.3
0.3
0.2
0.2
0.3
0.4
0.2
0.4
2.8
0.1
0.06
0.07
Dy
9.8
1.7
1.3
1.2
3.9
1.9
15.8
1.5
1.4
11.2
1.5
3.2
1.6
2.7
19.7
0.6
0.3
0.3
Ho
1.9
0.3
0.3
0.3
0.7
0.4
2.1
0.3
0.3
1.4
0.2
0.7
0.4
0.7
4.2
0.1
0.08
0.07
Er
5.4
1.1
0.9
0.9
2.3
1.2
5.8
1.0
0.8
3.9
0.6
2.4
1.5
2.3
14.6
0.5
0.3
0.25
Tm
0.9
0.2
0.2
0.2
0.5
0.3
0.9
0.2
0.2
0.6
0.1
0.4
0.3
0.4
3.0
0.1
0.03
0.05
Yb
5.4
0.9
1.2
1.1
4.1
2.2
8.0
0.8
1.2
5.2
0.6
3.6
3.2
2.8
27.9
0.4
0.2
0.3
Lu
0.9
0.2
0.2
0.2
0.6
0.4
1.2
0.1
0.2
0.7
0.2
0.6
0.6
0.5
4.2
0.1
0.03
0.02
Eu/Eu*
0.57
0.42
0.50
0.54
0.27
0.30
0.05
0.17
0.33
0.03
0.15
0.10
0.29
0.40
0.31
0.51
0.84
0.5
La
n
/Yb
n
6.9
10.7
8.0
6.6
2.5
4.1
2.4
9.4
5.5
6.4
15.1
3.2
1.2
2.4
0.3
11.8
13.0
10.2
La
n
/Sm
n
4.4
6.7
7.1
6.2
2.8
3.8
0.8
4.2
7.6
1.1
3.4
3.7
3.5
4.9
0.9
6.1
5.4
4.6
Gd
n
/Yb
n
1.2
1.2
0.7
0.7
0.6
0.6
1.6
1.3
0.6
2.4
1.9
0.6
0.2
0.5
0.3
0.8
1.0
1.1
a
The normalization is based on data given by
; the Eu anomaly is defined as Eu/Eu*
⫽ Eu
n
/(Sm
n
· Gd
n
)
0.5
.
3744
J. Go¨tze et al.
variations of the Ge/Fe ratio which relate to the crystallization
sequence.
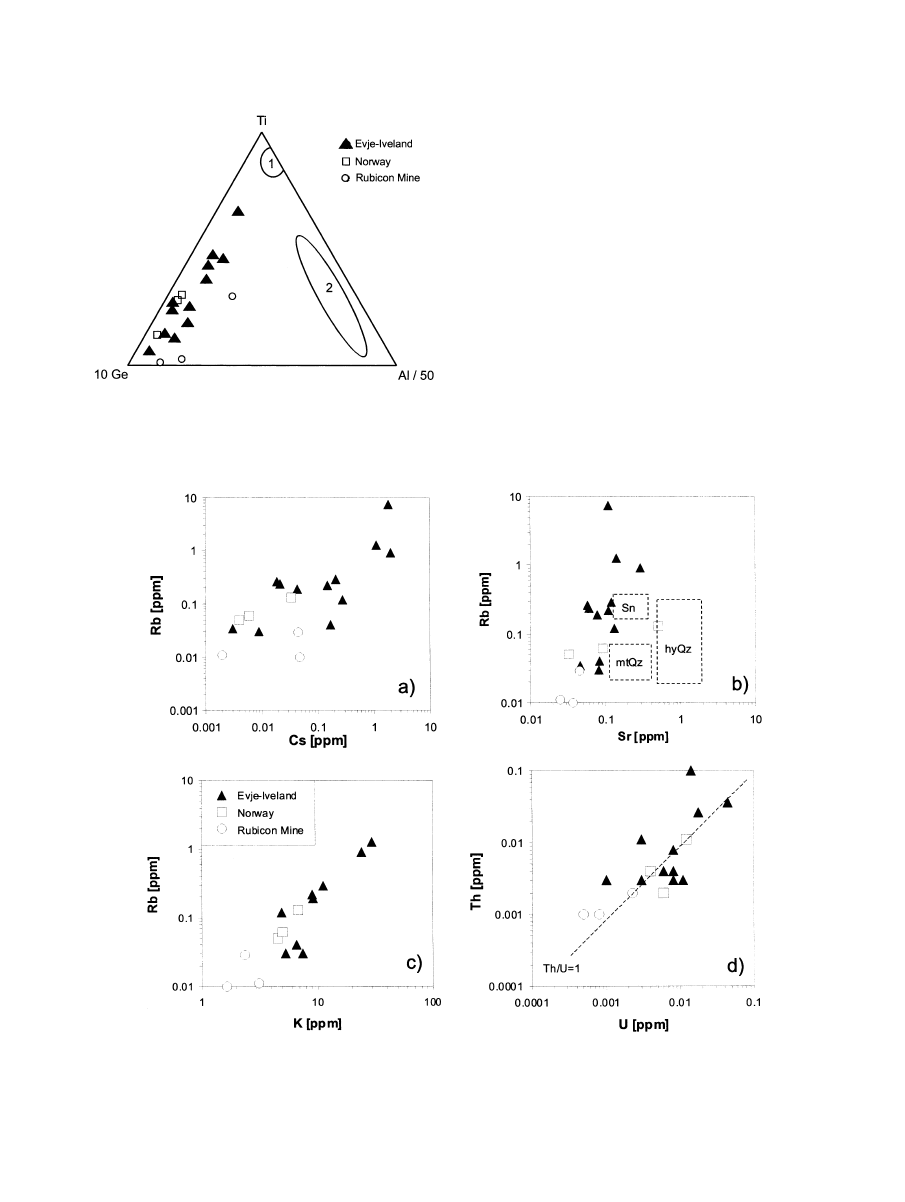
The Ge speciation is also illustrated in the 10Ge-Al/50-Ti
diagram (
) The samples plot within a field far from the
trace element composition of granite and rhyolite quartz, re-
spectively. The high Ge content is a characteristic feature of
quartz from pegmatite bodies and was also observed in quartz
from pegmatites of other regions (
Although the quartz samples from the different occurrences
vary in absolute concentrations of several trace elements, they
show some general trends in trace element ratios (
). The
quartz samples from the Li (Be-Cs-Rb) pegmatite of Rubicon
have high contents of Al, Li and Ge, but, in contrast, contain
very low concentrations of K, Na, Rb, Sr, Cs, U and Th. The
concentrations of Nb, Sc and Ta are below the detection limit
of the trace element analysis. This is interesting in so far as the
Be-Cs-Rb mineralization of the pegmatite does not seem to
influence the trace element composition of the quartz. A similar
observation was made for some of the pegmatites from Norway
Fig. 1. 10Ge-Al/50-Ti diagram after
. The
pegmatite quartz samples of this study plot within a field far from the
trace element composition of quartz from rhyolites (1) and granites (2).
Fig. 2. Selected trace-element correlations of the investigated pegmatite quartz samples. The legend is the same for all
diagrams. The fields in the Sr/Rb diagram (b) mark positions for the trace element composition of hydrothermal quartz from
Sn deposits (Sn), for metamorphic quartz (mtQz), and hydrothermal quartz from Au deposits (hyQz), after
3745
Trace element incorporation into quartz
with Nb/Ta mineralization, which revealed no detectable con-
centrations of Ta in quartz.
The Rb contents of pegmatite quartz range from 9 to 7360
ppb, which is in the same range as for Cs (
). In contrast,
the concentrations of Sr only scatter over a small range (around
0.1 ppm) and are very low in general. The comparison of Rb/Sr
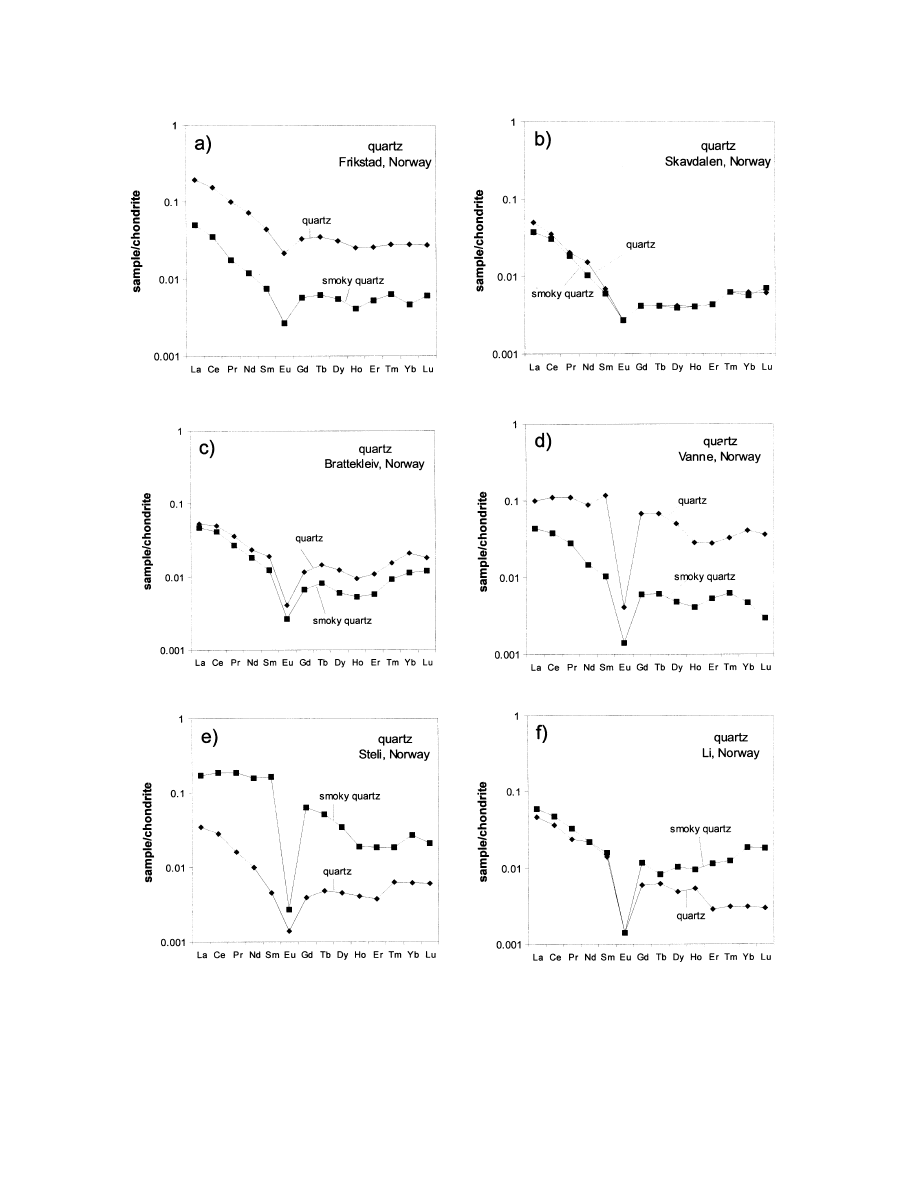
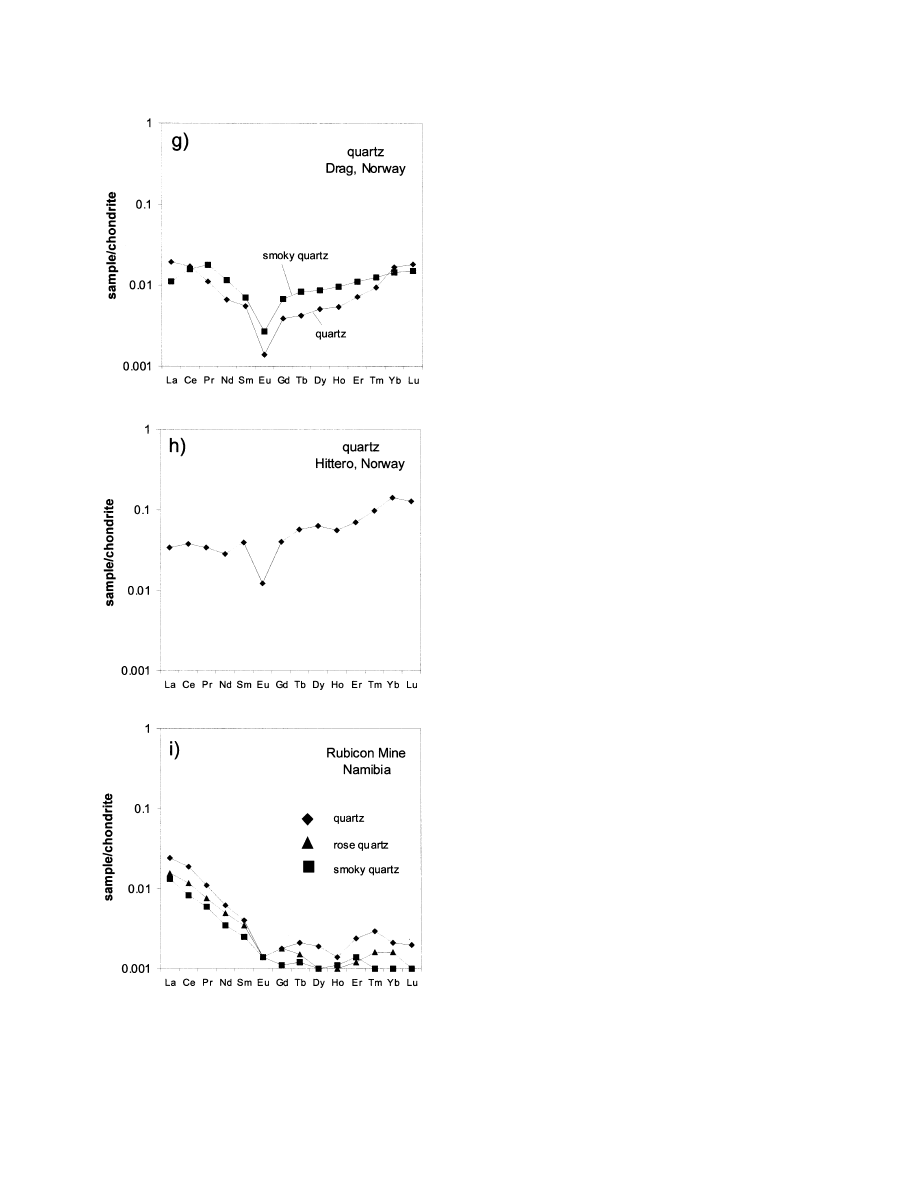
Fig. 3. Chondrite-normalized REE distribution patterns of pegmatite quartz samples from different localities (normal-
ization according to data of
). Note that the shape of the REE distribution patterns is almost identical for these
sample pairs and do only differ in absolute concentrations.
3746
J. Go¨tze et al.
ratios with data of quartz from other origins (
) illustrates
that the pegmatite quartz plots outside the fields for hydrother-
mal quartz from tin and gold deposits and quartz of metamor-
phic origin, as reported by
. However,
these results have only preliminary character due to the limited
number of samples analyzed. More data points are needed to
confirm that this statement is generally valid.
The Th/U ratios of pegmatite quartz significantly differ from
the average of 3.8 in the upper continental crust (
). Although the absolute concentrations of
both elements are in general below 0.1 ppm, the Th/U ratios are
fairly similar and scatter around Th/U
⫽ 1 (
The chondrite normalized REE patterns show pronounced
negative Eu anomalies (Eu/Eu*
⫽ 0.03–0.84) and “tetrad ef-
fects” (
). The term “tetrad effect” refers to the subdivision
of the REE series into four groups (four concave-upward seg-
ments) that was first reported by
and
. The normalized REE concentrations
decrease from La to Sm (La
n
/Sm
n
⫽ 1.1–7.6 with exception of
sample Qz9a), whereas the shape of the REE patterns is almost
horizontal from Gd to Yb, or slightly increasing (Gd
n
/Yb
n
⫽
0.2–2.4). This is especially valid for the samples Qz7a/b from
Drag and Qz9a from Hitterø, which show elevated concentra-
tions of the heavy REE (HREE) (La
n
/Yb
n
of sample Qz9a
⫽
0.3). This phenomenon is probably caused by the primary
composition of the mineralizing fluids, which could have been
enriched in Y and HREE.
3.2. Electron Spin Resonance
The results of the ESR analysis in this study provide infor-
mation concerning the abundance and distribution of paramag-
netic lattice defects and trace elements, which are incorporated
and produce a paramagnetic center in the quartz structure. In
general, the pegmatite quartz samples show different center
distribution from that of quartz from igneous and metamorphic
rocks (
Plo¨tze, 1995; Go¨tze and Plo¨tze, 1997
). No relationship
could be detected between the concentration of paramagnetic
centers and coloration of the samples. In all pegmatite quartz
samples the following, varied paramagnetic centers were de-
tected (
Generally, the abundance of O
2
3
⫺
centers (silicon vacancy)
and E
1
’ centers (oxygen vacancy) in pegmatite quartz is very
low. The [SiO
3
]
3
⫺
center (E’
1
center) consists of an unpaired
electron bound on a O
2
⫺
vacancy (e.g.,
). This center could not be detected. The O
⫺
and O
2
3
⫺
centers represent different types of defect electrons on O
2
⫺
in
tetrahedra with silicon vacancy (e.g.,
). The low content of lattice defects
associated with oxygen or silicon vacancies points to slow
growth of quartz crystals from a parental fluid, without super-
saturation under constant physicochemical conditions.
The substitutional and interstitial incorporation of trace ele-
ments into the quartz lattice resulted, especially, in the forma-
tion of paramagnetic centers associated with Al, Ge and Ti. The
[AlO
4
]
0
center was the most intense in the ESR spectra of the
quartz samples studied. This center is caused by substitution of
Al
3
⫹
for Si
4
⫹
with an electron hole trapped by a nonbonding
2p orbital at one of the four nearest O
2
⫺
ions, forming O
1
⫺
). The precursor state for this center is the
diamagnetic [AlO
4
/M
⫹
]
0
associated with an adjacent charge
compensating cation M
⫹
(H
⫹
, Li
⫹
, Na
⫹
). During
␥-irradiation
of quartz at 295 K the M
⫹
-ion may diffuse away yielding the
paramagnetic [AlO
4
]
0
). For polycrys-
Fig. 3. (Continued)
3747
Trace element incorporation into quartz

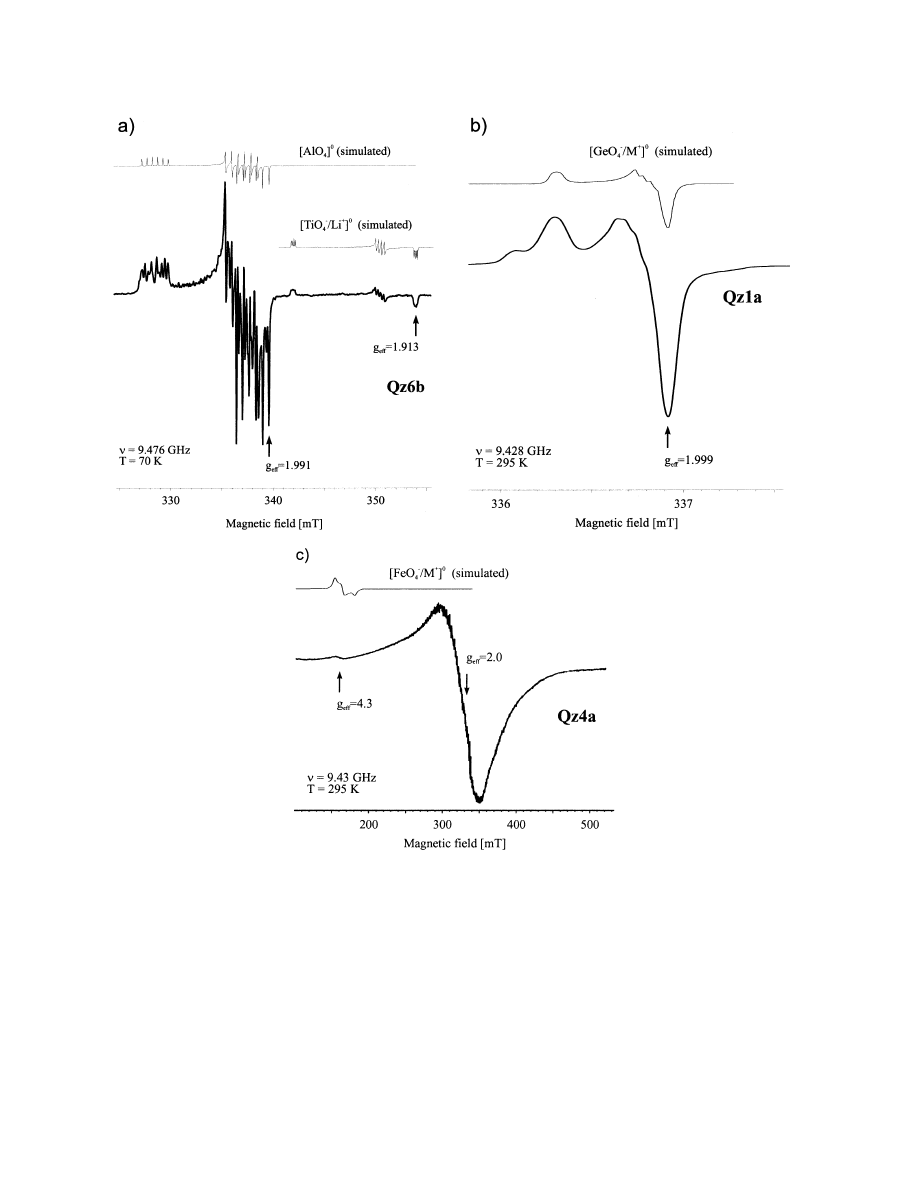
talline samples the ESR spectrum of [AlO
4
]
0
exhibits a multi-
line spectrum of superimposed 6-line hyperfine patterns (
). The concentration of the Al centers was quantified using a
reference sample with known [AlO
4
]
0
concentration (
). This allowed a comparison of the concentration of
structurally incorporated Al with the content of bulk trace Al
(10
16
spins/g Al
⫽ 1 ppm Al). The results show that the
concentration of bulk “trace Al” is higher than structural “ESR
Al” (
Centers of the type [TiO
4
/Li
⫹
]
0
, which were detected in
quartz of the different pegmatites (
), are produced by
irradiation of the diamagnetic precursor [TiO
4
]
0
(Ti
3
⫹
, i.e.,
electron center at Ti
4
⫹
). This precursor is formed by substitu-
tion of Ti
4
⫹
for Si
4
⫹
at the Si position, where charge compen-
sation is achieved by Li
⫹
ion at a channel position nearby
Wright et al., 1963; Rinneberg and Weil, 1972
). A typical
spectrum is shown in
The Ge-center is of the same type as the Al-center. Substi-
tution of Si
4
⫹
by Ge
4
⫹
causes formation of the diamagnetic
precursor [GeO
4
]
0
, which transforms to the paramagnetic
[GeO
4
]
⫺
during
␥-irradiation. At room temperature, these cen-
ters can bind diffusing M
⫹
cations, preferentially forming
[GeO
4
/Li
⫹
]
0
and [GeO
4
/H
⫹
]
0
). The hyperfine structure is only poorly
resolved (
). The probable charge compensation ion
might be Li
⫹
(4 lines at the signal at g
⫽ 2.000). Relatively
high signal intensities of [GeO
4
/M
⫹
]
0
centers were found,
which corresponds to the elevated concentrations of Ge de-
tected in some of the samples.
Some Fe
3
⫹
paramagnetic centers may occur in quartz. One of
these centers is characterized by substitution of Fe
3
⫹
for Si
4
⫹
with
charge compensation by alkali ions or protons, so-called S centers
[FeO
4
/M
⫹
]
0
Stegger and Lehmann, 1989; Mineeva et al., 1991
The signal at g
eff
4.3 is characteristic of substitutional Fe
3
⫹
centers
in quartz
). The bulk concentration of Fe in the pegmatite
quartz samples is very low, and structural Fe
3
⫹
could only be
detected in samples Qz1b and Qz4a (
). The comparison of
the Fe
3
⫹
-center concentration with chemically determined Fe con-
tents does not show any correlation. However, the intense, very
broad line at g
eff
⬃ 2, which is in general assigned to ferromag-
netic inclusions or center clusters with strong spin-spin interac-
tion— usually of transition metal ions (e.g., Fe
2
⫹
, Fe
3
⫹
)— could
be a sign for incorporation of iron into the quartz as center clusters
or submicroscopic inclusions.
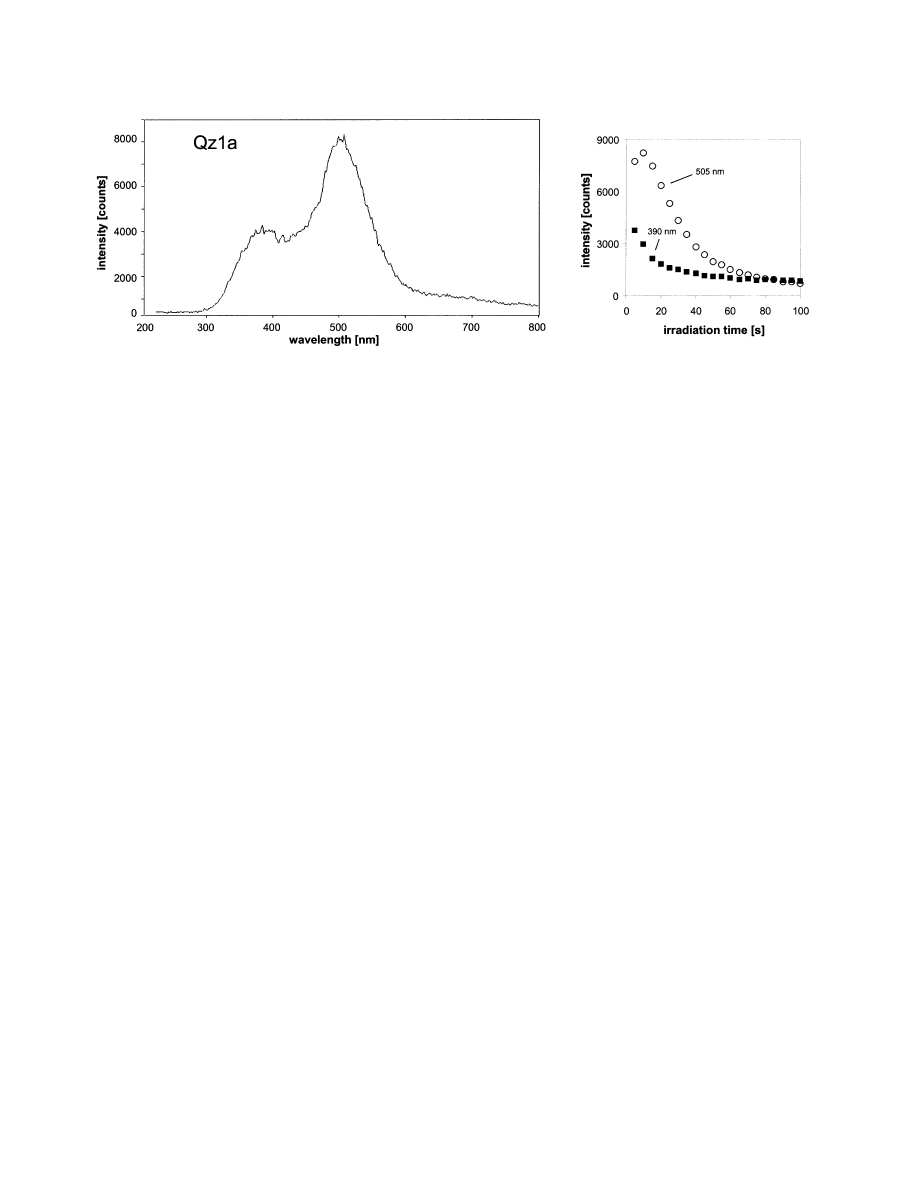
3.3. Cathodoluminescence (CL) Microscopy and
Spectroscopy
The visible CL of all samples is more or less homogeneous
bluish-green (
); primary internal structures (e.g., growth
zoning) were not found. The CL is caused by two broad
emission bands at 505 nm (2.45 eV) and 390 nm (3.18 eV) (
). The intensity ratio of these emission bands causes the more
bluish or greenish tint of the visible CL color. In most samples
the 505 nm band (greenish) dominates the CL emission.
The transient CL disappears after 60 –100 s of electron
irradiation, and almost no stable component of the emission
remains. This transient CL behavior results in a disappearance
of the visible CL. The two emission bands show slightly
different decay kinetics (
). In contrast to hydrothermal
quartz, a very weak CL emission band in the red spectral region
(650 nm,
⫺1.9 eV) was detected only in a few samples (2a, 4a,
5a, 6a, 7a). This emission was only visible after electron
irradiation due to the decreasing intensities of the two domi-
nating emission bands, which covered the red band. Moreover,
other characteristic CL emissions occurring in quartz of igne-
ous and hydrothermal origin (e.g., 450 nm, 580 nm), which are
associated with lattice defects (oxygen or silicon vacancies),
are also lacking.
3.4. Fluid Inclusion Petrography and Microthermometry
Although the analytical techniques used for chemical char-
acterization of the fluid inclusions only allow bulk analysis,
different types of inclusions were described by fluid inclusion
microscopy and microthermometry. In general, the coarse
Table 4. Results of ESR analysis of quartz samples from different pegmatites (amplitude intensities in arbitrary units).
a
Sample
Fe
3
⫹
at
g
⫽ 4.3 a.u.
signal at
g
⫽ 2 a.u.
O
2
3
⫺
at
g
⫽ 2.005 a.u.
[GeO
4
⫺
/M
⫹
]
0
at
g
⫽ 1.999 a.u.
[TiO
4
⫺
/Li
⫹
]
0
at
g
⫽ 1.913 a.u.
[AIO
4
]
0
at
g
⫽ 1.991 a.u.
10
17
spins/g
ppm
Qz1a
nd
2000
nd
52300
195
27740
2.41
24
Qz1b
50
32000
200
23700
75
27430
2.39
24
Qz2a
nd
11000
nd
3300
110
4740
4.12
4
Qz2b
nd
60000
1000
4800
90
19770
1.72
17
Qz3a
nd
40000
nd
2900
nd
15450
1.34
13
Qz3b
nd
18000
500
8200
75
23480
2.04
20
Qz4a
100
9000
nd
700
8
7440
6.48
6
Qz4b
nd
5000
200
3700
22
13240
1.15
11
Qz5a
nd
37000
200
4700
119
32380
2.82
28
Qz5b
nd
4000
2000
2300
nd
19320
1.68
17
Qz6a
nd
3000
500
1000
35
28800
2.51
25
Qz6b
nd
3500
200
9800
380
41380
3.60
36
Qz7a
nd
4000
500
900
8
32910
2.86
29
Qz7b
nd
4000
nd
500
nd
18780
1.63
16
Qz9a
nd
17000
nd
900
nd
3610
3.14
3
Qz15a
nd
12500
nd
21700
44
15360
1.34
13
Qz15b
nd
19000
500
12800
nd
32810
2.85
28
Qz15c
nd
23000
nd
12000
474
28660
2.49
25
a
nd
⫽ below detection limit.
3748
J. Go¨tze et al.
quartz grains hosting the fluid inclusion assemblages are only
weakly affected by secondary deformation; evidence for sig-
nificant recrystallization of the mineral could not be observed.
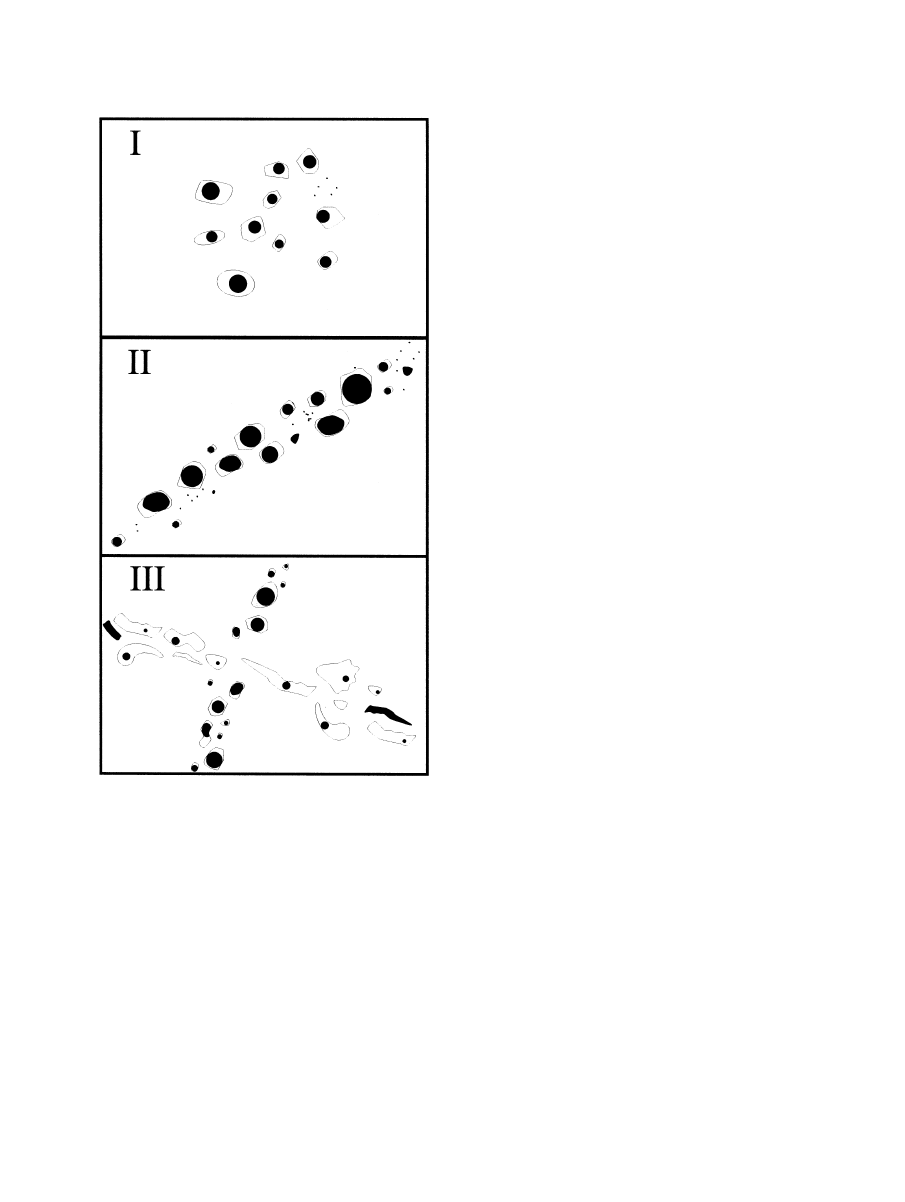
The fluid inclusions are classified according to their distribution
characteristics in the host quartz samples (
) into three
types:
Type I inclusions occur as irregular clusters or as groups
with no planar orientation. The quartz hosting the inclusions
does not show evidence of growth zoning; however, the occur-
rence of inclusions of Type I in small three-dimensional groups
well separated from other inclusions may suggest a primary or
early pseudosecondary origin for them (cf.
Type II inclusions occur in short trails or in lineations cut by
later microstructures. These inclusions could also be pseudo-
secondary. And Type III inclusions occur in trails cross-cutting
older fluid inclusion assemblages and grain boundaries. Incon-
sistent liquid/vapor-ratios owing to fluid inclusion necking are
frequent. These inclusions clearly represent secondary forma-
tions.
The pegmatite quartz samples were subdivided into three
groups using the fluid inclusion types present and the bulk
compositions of the trapped fluids at room temperature.
Fig. 4. Selected ESR spectra of trace element centers (a
⫽ [AlO
4
]
0
and [TiO
4
⫺
/Li
⫹
]
0
; b
⫽ [GeO
4
⫺
/M
⫹
]
0
; c
⫽
[FeO
4
⫺
/M
⫹
]
0
) in pegmatite quartz, in comparison with simulated spectra; arrows mark analytical lines.
3749
Trace element incorporation into quartz
3.4.1. Group 1: Quartz dominated by low-salinity
H
2
O-CO
2
inclusions
The majority of the samples (most quartz from Evje-Iveland,
Norway, and from Rubicon mine, Namibia) belong to a first
group that is characterized by a predominance of Type II and
III H
2
O-CO
2
-inclusions. Type I CO
2
-bearing inclusions and
Type III pure aqueous fluid inclusions were found to occur in
subordinate numbers in some of these samples.
H
2
O-CO
2
-inclusions contain two or three immiscible
phases at room temperature in the studied samples. They
show predominantly isometric to longish forms. Negative
crystal shapes also occur frequently. CO
2
-bearing aqueous
inclusions mostly have an intermediate degree of fill (F
⬃
0.50 to
⬃ 0.85) and rather homogeneous H
2
O/CO
2
-rich
phase ratios in most inclusions of one group or trail. How-
ever, there was a considerable variation in the degree of fill
between different samples. Assemblages of Type II CO
2
-
bearing fluid inclusions showing a very variable degree of
filling (F:
⬃ 0.40 to 0.95) have been found in the quartz
sample from Vanne, Evje-Iveland. No leaking or necking
down is indicated for these inclusions.
Microthermometric data for H
2
O-CO
2
-inclusions are sum-
marized in
. The temperatures of first melting of ice
(Tfm) ranged from
⫺27 to ⫺20 °C (
). This indicates a
predominance of NaCl as the salt component in the fluid. The
temperature of final melting of ice (TmIce) could not be mea-
sured for CO
2
-bearing inclusions in the investigated samples.
Final melting of solid phases always occurred at temperatures
above 0°C, which is interpreted to represent the temperature of
dissociation of clathrates (TmCLA;
). The measured
temperatures of final melting of CO
2
(TmCO
2
;
) only
show a rather limited variability for all investigated samples.
The mostly insignificantly lowered TmCO
2
values indicate the
presence of almost pure CO
2
as the nonaqueous volatile (triple
point of pure CO
2
:
⫺56.6 °C); however, the existence of small
amounts of volatiles such as CH
4
and N
2
in the fluid is sug-
gested for the smoky quartz from Vanne by the slightly lower
TmCO
2
data (
3.4.2. Group 2: Quartz dominated by low-salinity aqueous
inclusions
Only pure aqueous inclusions have been trapped in samples
of the second group (quartz from Steli and Drak, Norway).
Most of them can be clearly identified to belong to the Type III;
however, some fluid inclusions occur in short trails.
In general, the pure aqueous inclusions are Type II and III
two-phase inclusions at room temperature; however, poorly
healed late fluid inclusion trails are often outlined by Type III
mono- and two-phase aqueous inclusions showing flat and
highly irregular shapes. The Tfm values ranged from
⫺33 to
⫺25 °C in these inclusions (all samples studied;
). This
suggests a predominance of NaCl as the salt component in the
fluid. The TmIce values were measured in the range from
⫺5.0
to
⫺7.0 °C for inclusions in all investigated samples (
Final melting of solid phases at temperatures above 0 °C could
not be observed for these inclusions.
3.4.3. Group 3: Quartz dominated by brine inclusions
The third group of samples (three samples from Evje-Ive-
land, Norway) is formed by quartz that is dominated by Type
II and, less frequently, Type III multiphase aqueous inclusions.
Furthermore, Type III two-phase pure aqueous inclusions with
high degrees of fill were observed in the latter group of samples
(mono-phase liquid inclusions also occur).
A large number of Type II and III brine inclusions containing
one or more daughter minerals was found in three of the
investigated samples. The inclusions show isometric to longish
forms; negative crystal shapes were also observed. One of the
daughter minerals could be identified as NaCl (cubes; isotropic
under crossed polars); in addition, tabular crystals often occur.
First melting of ice could only be observed for two inclusions.
The Tfm values range from
⫺33 to ⫺30 °C (
). The
presence of traces of CO
2
in multiphase aqueous inclusions is
indicated by final melting of solid phases at temperatures above
0 °C in one of the measured samples (smoky quartz 1b, Frik-
stadt;
In general, a high percentage of the investigated samples is
characterized by a predominance of fluid inclusions containing
Fig. 5. CL emission spectrum of the quartz sample from Frikstad, Norway showing two main emission bands at 505 nm
(2.45 eV) and 390 nm (3.18 eV). The time-dependent behavior of the CL emission during irradiation (right) shows different
kinetics for the two main emission bands.
3750
J. Go¨tze et al.
a fluid of a similar composition. In addition to this dominant
fluid type, probably late, pure aqueous fluid inclusions occur in
variable amounts.
3.5. Fluid Inclusion Bulk Chemistry (Capillary Ion
Analysis)
The results of the capillary ion analysis of inclusions in
pegmatite quartz (
) show several elements to be present
within the fluids. Besides the major elements K, Na, Ca and
Mg, trace contents of Li and of the transition metals Co, Ni, Zn,
Pb and Cu were detected in some of the pegmatite quartz
samples.
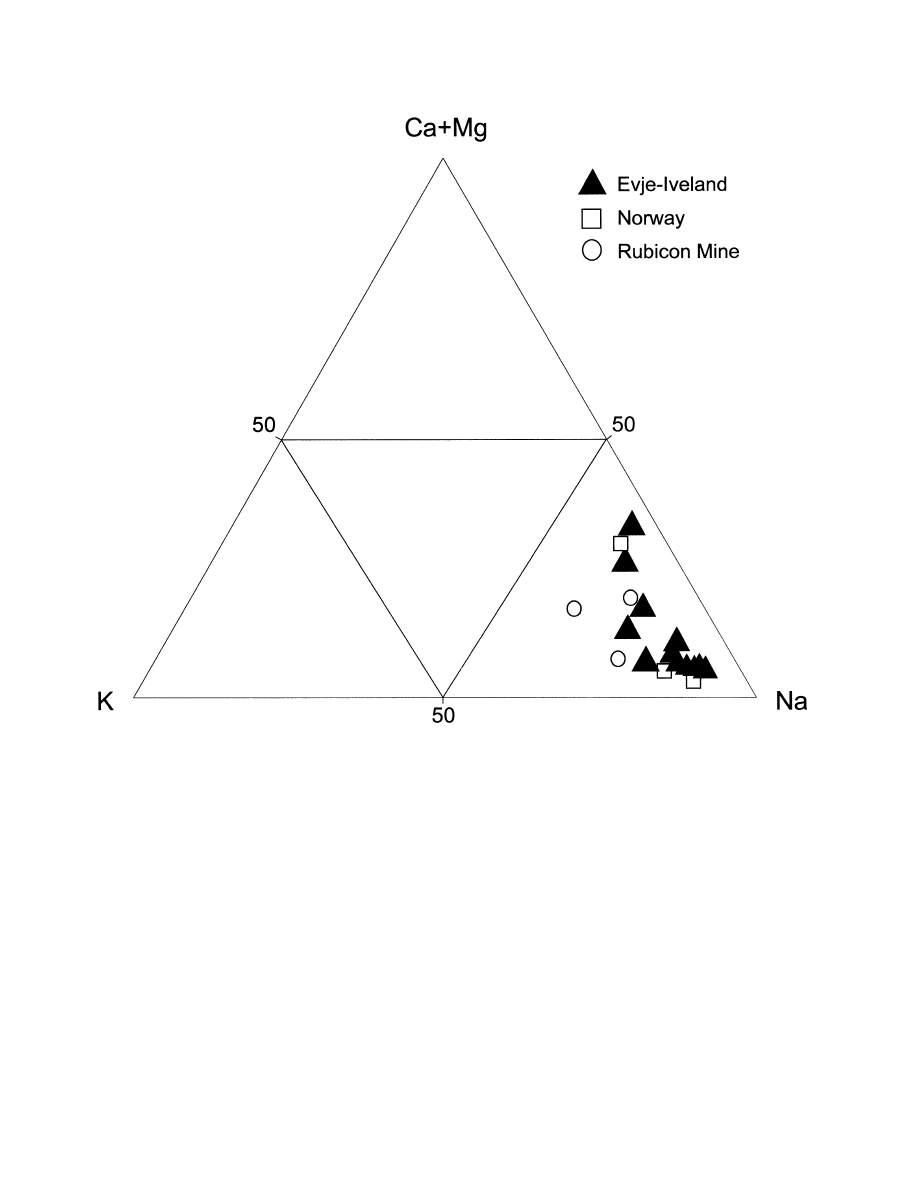
According to their chemical composition, the fluid inclusions
in most samples can be classified as H
2
O-CO
2
-NaCl type
inclusions (
). The Ca, Mg and Li contents are
predominantly low. The K/Na ratios in fluid inclusions of the
pegmatite quartz samples vary only slightly (0.07– 0.33). Fur-
thermore, NH
4
⬎ K was found for all samples except sample
Qz15a. Among the anionic complexes, NO
3
⫺
, HCO
3
⫺
and
SO
4
2
⫺
were analyzed in considerable amounts, besides Cl
⫺
. In
contrast, F
⫺
seems to play a subordinate role and was only
detected in significant amounts in sample Qz1 from Frikstad,
Norway. Additionally, the organic ligands acetate and propi-
onate were detected (
). The origin of these organic
ligands is unclear (
3.6. Bulk Fluid Inclusion Volatile Composition (Gas
Chromatography)
The results of the gas chromatographic analysis are summa-
rized in
. Gas analysis shows volatile components in the
following order of abundance: H
2
O
⬎ CO
2
⬎ N
2
(
⫹) ⱖ CH
4
⬎ COS ⬎ C
2
and C
3
hydrocarbons. Water is the predominant
volatile with
⬎90 mol % in most samples. CO
2
concentrations
range from
⬍ 0.1 to ⬃ 8 mol % for almost all specimens.
Samples Qz2a and Qz15c contain strongly elevated CO
2
con-
tents of 19.7 and 40.8 mol %, respectively. N
2
(
⫹) and CH
4
concentrations were always between
⬃0.02 and 0.8 mol %. The
other volatile components are significantly below 0.1 mol per-
cent.
4. DISCUSSION
Although quartz of pegmatitic origin is characterized by low
contents of most trace elements (
and
), some ele-
ments (e.g., Al, Na, K, Li, Ti, Ge) may be concentrated in
remarkable concentrations. The elevated concentrations of K
and Na in some samples may suggest the presence of submi-
croscopic inclusions of muscovite and/or feldspar. However,
analyses of the sample material by cathodoluminescence and
scanning electron microscopy did not reveal impurities of such
minerals. Therefore, we assume that these elements are mostly
distributed in the structural channels parallel to the c-axis or
bound on aqueous inclusions.
This is confirmed by the correlation of Al versus charge
compensating cations in the quartz samples (
). There are
only a few samples that do not fit along this almost linear
correlation. Although the contents of Na and K were above the
upper calibration limit of the used analytical method in some
samples (
), the high Al contents indicate that they also
behave like the other samples.
The results of the ESR measurements revealed that trace Al
is indeed incorporated into the quartz structure, as indicated by
the good correlation of Al with the compensating alkali ions
(
⌺Li ⫹ Na ⫹ K) (
). However, the comparison of the
chemically determined trace contents of Al with the contents
measured by ESR lacks such good correlation. This is caused
by the fact that not all substitutional Al is present in the form
of paramagnetic centers. The radiation dose was too low to
transform the trace element defects from the nonparamagnetic
Fig. 6. Main types of fluid inclusions observed in pegmatite quartz of
different occurrences. Type I: inclusions occur as irregular clusters or
as groups with no planar orientation; Type II: inclusions occur in short
trails or in lineations cut by later microstructures; Type III: inclusions
occur in trails cross-cutting older fluid inclusion assemblages and grain
boundaries; inconsistent L/V-ratios owing to fluid inclusion necking
are frequent.
3751
Trace element incorporation into quartz
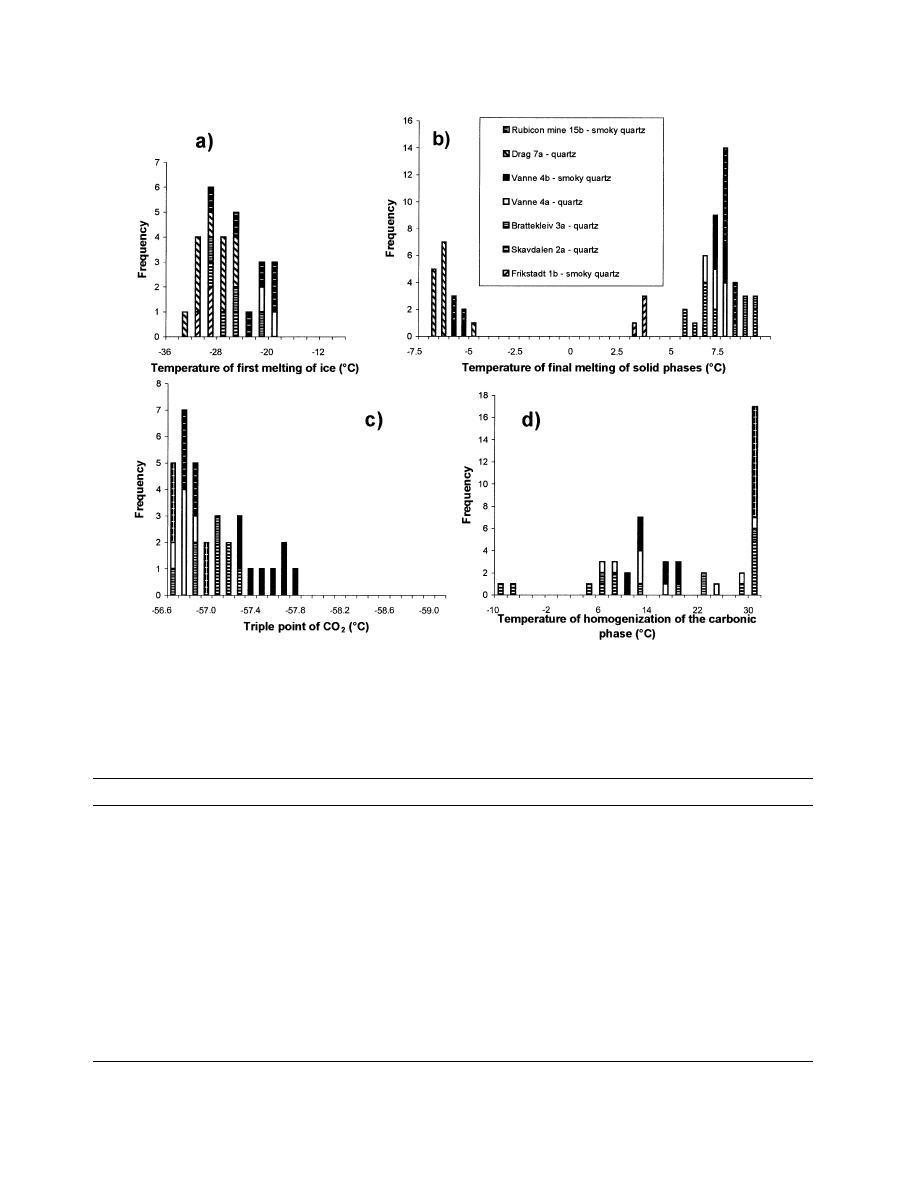
Fig. 7. Diagrams showing the results of the microthermometric investigations on pegmatite quartz samples. (a)Tempera-
ture of first melting of ice (Tfm); (b) Temperature of final melting of solid phases (temperature of dissociation of clathrates
TmCLA). (c) Triple point of CO
2
(final melting of CO
2
TmCO
2
). (d) Temperature of the homogenization of the carbonic
phase.
Table 5. Results of capillary ion analysis of fluid inclusions in quartz samples from different pegmatites (all data in mol%).
a
Sample
NH
4
K
Na
Li
Ca
Mg
Co
Ni
Zn
Pb
Cu
Cl
⫺
F
⫺
NO
3
⫺
HCO
3
⫺
SO
4
2
⫺
Acetate
b
Propioate
b
Qz1a
6.45
1.29
9.52
0.17
2.89
0.71
nd
0.44
2.19
nd
1.25
24.75
15.49
8.11
2.75
11.05
0.59
1.08
Qz1b
2.99
1.18
8.06
0.41
1.48
0.42
nd
nd
nd
nd
nd
19.84
3.59
3.63
4.16
3.76
nd
nd
Qz2a
1.63
0.72
9.28
0.22
0.45
0.13
nd
nd
nd
nd
1.08
14.22
1.18
3.00
7.90
2.76
nd
1.71
Qz2b
1.51
0.62
5.03
0.26
0.30
0.09
nd
nd
nd
nd
nd
7.22
—
2.35
7.35
2.53
nd
2.09
Qz3a
1.19
0.33
4.63
—
2.18
0.08
nd
nd
nd
nd
nd
5.72
0.89
2.05
4.05
1.65
0.33
0.18
Qz3b
1.20
0.47
4.74
—
0.49
0.08
nd
nd
nd
nd
nd
9.23
0.35
3.10
4.74
1.42
nd
nd
Qz4a
1.39
1.32
6.94
—
0.47
0.07
nd
nd
nd
nd
nd
10.86
—
1.90
6.90
2.03
nd
nd
Qz4b
1.39
1.07
11.26
0.19
0.64
0.14
nd
nd
nd
nd
nd
19.35
—
3.37
7.75
3.66
nd
nd
Qz5a
0.81
0.52
2.59
—
0.36
0.07
nd
nd
nd
nd
nd
2.69
—
2.25
4.97
1.95
nd
nd
Qz5b
1.08
0.52
4.69
0.12
0.21
0.11
nd
nd
nd
nd
nd
7.30
—
4.52
8.12
2.70
nd
nd
Qz6a
1.02
0.68
5.59
—
0.45
0.08
nd
nd
nd
nd
nd
10.44
—
2.99
4.55
1.45
nd
nd
Qz6b
1.16
0.67
8.31
0.16
0.41
0.11
nd
nd
nd
nd
nd
13.19
—
1.44
8.35
1.38
nd
nd
Qz7a
0.60
0.36
2.42
0.03
0.16
—
nd
nd
nd
nd
nd
1.21
—
1.86
7.16
0.68
nd
nd
Qz7b
1.35
1.04
11.24
0.07
0.38
0.08
nd
nd
nd
nd
nd
9.12
—
2.63
13.52
2.69
nd
nd
Qz9a
1.37
1.20
10.46
0.12
4.15
0.59
nd
nd
nd
nd
nd
25.86
—
1.26
5.08
4.09
nd
0.83
Qz15a
0.96
0.77
2.91
0.19
0.25
0.06
nd
nd
nd
nd
nd
4.62
0.83
2.77
8.14
1.02
nd
nd
Qz15b
0.72
1.16
3.46
—
0.86
0.06
0.09
nd
nd
0.67
nd
6.39
—
6.71
26.47
3.19
nd
nd
Qz15c
1.12
0.54
3.43
0.09
0.42
0.51
nd
nd
nd
nd
0.32
1.54
0.34
1.84
11.81
1.62
1.20
nd
a
nd
⫽ below detection limit (Rb, Sr, Ba, Mn, Br, oxalate, butyrate, WO
4
, and HPO
4
were below detection limit in all samples).
b
Acetate CH
3
-COO
⫺
; propionate CH
3
-CH
2
-COO
⫺
.
3752
J. Go¨tze et al.
precursor state into paramagnetic centers. Al-center saturation
is achieved at 1
⫻ 10
6
Gy. With the applied dose of 1.4
⫻ 10
4
Gy only
⬃30% of the Al-defects were transformed into the
paramagnetic state (
). The incomplete conversion
of diamagnetic precursors into paramagnetic centers and the
existence of diamagnetic defects (e.g., interstitial Al) may be a
possible explanation for this phenomenon. On the other hand,
there is no evidence from our results that Al is hosted by
microinclusions.
Germanium is another trace element that is enriched in
pegmatite quartz compared to quartz from other geological
settings. The relatively high Ge content may be explained by
the higher solubility of GeO
2
in water than SiO
2
at a higher
temperature. Therefore, Ge is enriched in late magmatic and
hydrothermal fluids (
) and can substitute for Si in
the lattice because of the similar ionic radius, which was also
reported from agate (
) or hydrothermal
quartz (e.g.,
Schro¨n et al., 1982; van Moort et al., 1990
). The
detection of paramagnetic centers of the type [GeO
4
/M
⫹
]
0
in
quartz of the different pegmatites corresponds to the elevated
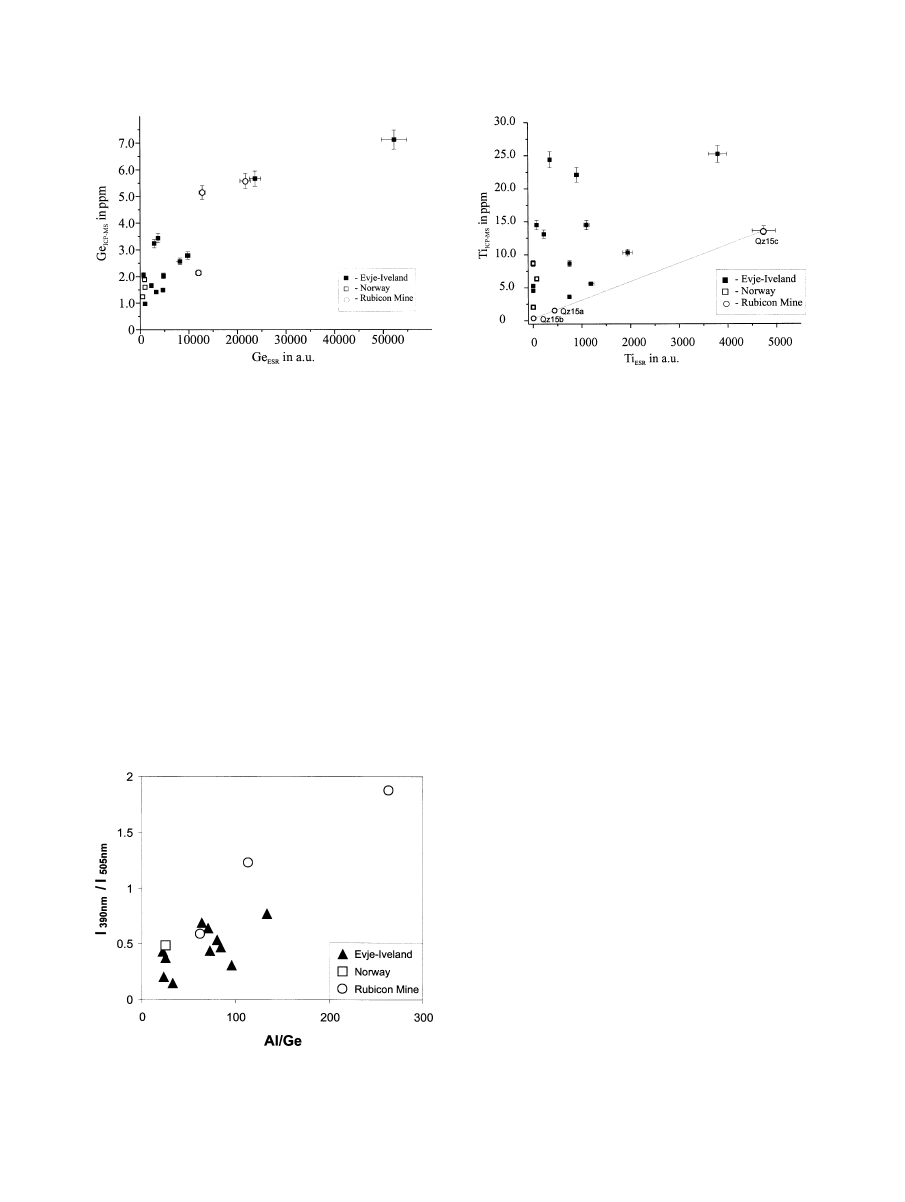
concentrations of Ge in these samples (
). The correlation
between “ESR-Ge” and the chemically analyzed bulk Ge con-
tents indicates that the largest part of the Ge is structurally
incorporated.
The results of trace element analysis and ESR measurements
indicate that the CL emission of pegmatitic quartz can be
strongly related to such structural trace-element centers (
). Especially the alkali (or hydrogen) compensated
centers of Al and Ge ([AlO
4
/M
⫹
]
0
, [GeO
4
/Li
⫹
]
0
) may be
responsible for the detected emission bands at 390 and 505 nm,
respectively. These transient emissions are sensitive to irradi-
ation damage and can probably be attributed to the recombi-
nation of a hole trapped adjacent to a substitutional, charge-
compensated center. The rapid attenuation of the CL emission
under the electron beam may result from the dissociation and
electromigration of the charge compensating cations out of the
interaction volume under the influence of the irradiation in-
duced electrical field (
Fig. 8. K-Na-(Ca
⫹ Mg) diagram for pegmatite quartz samples from different occurrences; the data emphasize the
predominance of Na in the inclusion fluids.
3753
Trace element incorporation into quartz
The comparison of the intensities of the 390 and 505 nm CL
emissions with the concentration of trace element centers
shows a correlation of the intensity of the 390 nm CL emission
with the trace content of Al, whereas the intensity of the 505
nm emission band correlates with the concentration of the
[GeO
4
/Li
⫹
]
0
center (
). Because of the varying
intensity ratios of the two emission bands in the different quartz
samples, we plotted this intensity ratio versus the element ratio
Al/Ge (
). Although there is no strong linear correlation
between these two parameters, the general trend supports our
assumption concerning the association of alkali compensated
Al and Ge centers with the CL emission bands at 390 and 505
nm, respectively, and would confirm earlier results of
and
. Moreover, CL microscopy
revealed a more or less homogeneous distribution of lumines-
cence active trace element centers in the investigated quartz
samples. In contrast to most hydrothermal quartz and also some
volcanic quartz crystals, where the spatial distribution of Al and
compensating cations can vary drastically within one crystal
(e.g.,
Perny et al., 1992; Watt et al., 1997
), the pegmatite quartz
samples show a homogeneous cathodoluminescence. Only sec-
ondary fluid trails were revealed, where the luminescence can
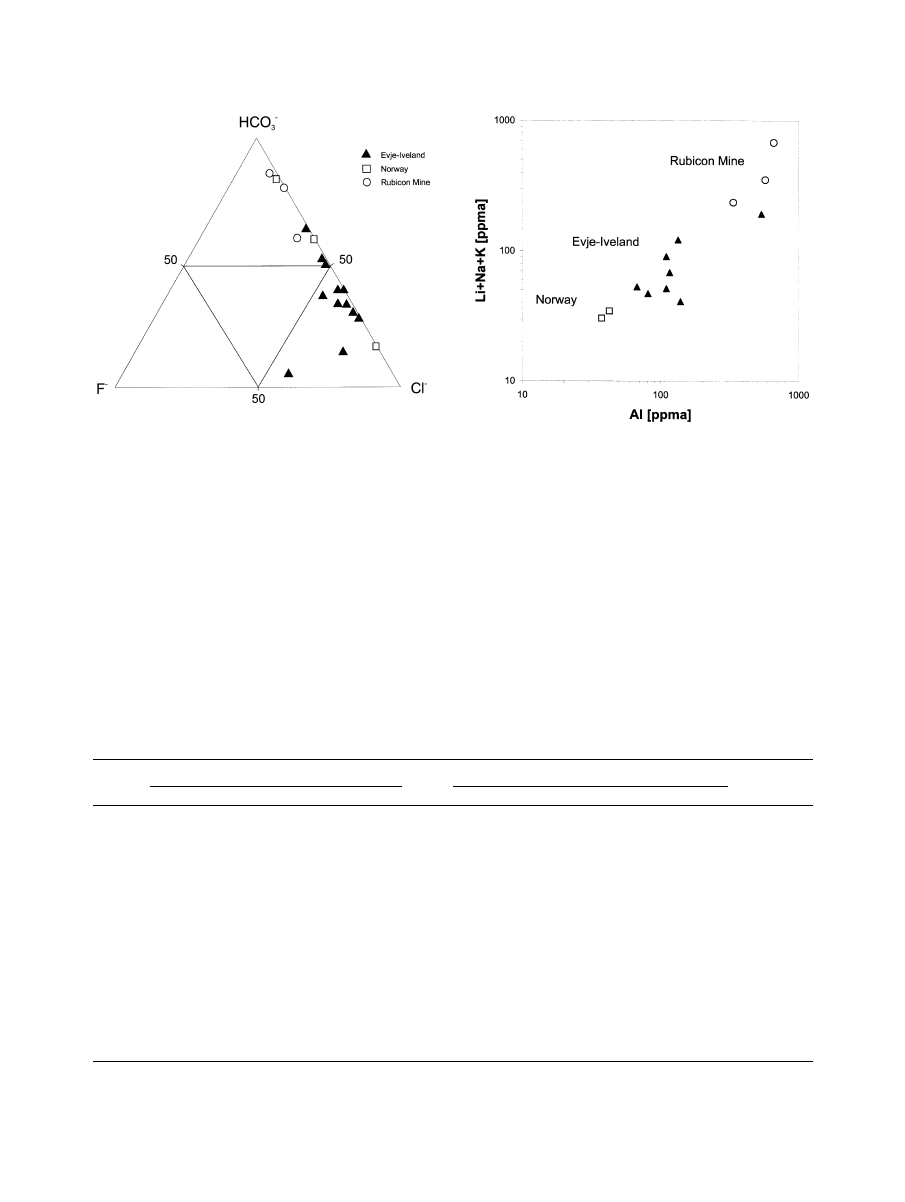
Fig. 9. F
⫺
-Cl
⫺
-HCO
3
⫺
diagram for pegmatite quartz samples from
different occurrences; the inclusion fluids of quartz samples from the
Evje-Iveland district, Norway are characterized by high Cl
⫺
contents,
whereas the other samples also show significant concentrations of
HCO
3
⫺
.
Table 6. Results of gas chromatography of inclusions in quartz samples from different pegmatities
a
.
Sample
H
2
O
N
2
(
⫹)
CH
4
CO
2
COS
C
2
H
4
C
2
H
6
(
⫹)
C
3
H
6
10
⫺6
mol
H
2
O/g quartz
mo %
ppm (molar)
Qz1a
99.52
0.03
0.19
0.26
nd
nd
nd
nd
2.33
Qz1b
99.95
0.02
0.04
nd
nd
nd
nd
nd
4.05
Qz2a
80.16
0.09
0.02
19.71
152
1.3
9
nd
16.48
Qz2b
94.23
0.05
0.03
5.68
26
1.0
10
nd
6.69
Qz3a
91.79
0.09
0.27
7.82
176
2.5
45
1.5
4.03
Qz3b
99.69
0.03
0.07
0.21
nd
1.9
27
2.3
4.66
Qz4a
97.39
0.04
0.02
2.54
nd
1.7
20
nd
10.43
Qz4b
95.55
0.08
0.04
4.37
84
1.4
29
0.8
7.99
Qz5a
99.36
0.12
0.22
0.30
nd
nd
nd
nd
0.59
Qz5b
98.96
0.10
0.09
0.84
nd
3.4
42
nd
2.81
Qz6a
97.73
0.03
0.05
2.19
nd
1.1
31
nd
4.27
Qz6b
96.84
0.04
0.02
3.09
nd
1.0
16
nd
8.11
Qz7a
98.45
0.02
0.83
0.69
nd
nd
92
nd
0.67
Qz7b
94.30
0.03
0.04
5.63
11
1.4
22
1.0
11.86
Qz9a
98.40
0.08
0.04
1.48
17
1.3
15
1.0
8.37
Qz15a
97.10
0.03
0.08
2.79
nd
nd
nd
nd
3.17
Qz15b
92.63
0.05
0.11
7.21
nd
nd
nd
nd
2.61
Qz15c
58.54
0.31
0.25
40.81
911
nd
73
5.1
1.22
a
nd
⫽ below detection limit (C
3
H
4
and C
3
H
8
were below detection limit in all samples). N
2
(
⫹) and C
2
H
6
(
⫹) mean that N
2
(
⫾CO; ⫾Ar; ⫾O
2
)
and C
2
H
6
(
⫾C
2
H
2
) are maximum concentrations.
Fig. 10. Correlation of Al versus the sum of charge compensating
cations Li
⫹ Na ⫹ K in the investigated pegmatite quartz samples (the
contents are given in ppma
⫽ atoms/10
6
atoms Si). The data of samples
2b, 4a, 5b, 6b, and 9a were not plotted into the diagram, as the contents
of Na and K, respectively, were above the upper calibration limit of the
used analytical method (
3754
J. Go¨tze et al.
be enhanced or quenched by the redistribution of such lumi-
nescence active elements or recrystallization processes during
the migration of fluids through the quartz lattice (
Paramagnetic centers of the type [TiO
4
/Li
⫹
]
0
were also
detected in quartz of the different pegmatites and evidenced the
structural incorporation of Ti into the quartz lattice. However,
the comparison of Ti center concentration versus bulk Ti con-
tent in all quartz samples in
reveals that in most
samples these values do not correlate. Three types of quartz
samples may be distinguished: (1) The quartz samples from the
Rubicon Mine (Qz 15a,b,c) show a perfect linear correlation
with zero intercept on the Ti axis indicating a complete struc-
tural incorporation of Ti into the quartz lattice. Interestingly,
the rose quartz sample (Qz15c) shows the highest concentration
of structurally incorporated Ti. Although
proposed that the rose color in quartz is caused by the occur-
rence of dumortierite-like microfibers, the recent results indi-
cate the role of structural Ti as source for the color in rose
quartz, as earlier suggested by
. (2) Quartz
from the pegmatites of Drag (Qz7a/b) and Hitterø (Qz9a),
Norway have Ti contents between 2.05 and 8.68 ppm without
measurable structural Ti. We interpret this as resulting from the
occurrence of Ti exclusively in mineral micro-inclusions
(rutile). (3) The third group includes most of the pegmatite
quartz from the Evje-Iveland district. In these samples both
types of Ti occurrence exist. Increasing amounts of structural
Ti may, in general, cause increasing bulk Ti contents, but a
general apparent nonzero intercept on the Ti axis indicates the
occurrence of nonstructurally incorporated Ti. A lack of cor-
relation in samples with high Ti contents may be due to rutile
inclusions. The height over the line, as defined by the samples
Qz 15a,b,c in
, gives an indication of the amount of
titanium that is not structurally bound in quartz.
The presence of rutile inclusions in quartz may be explained
by the temperature dependence of the trace-element incorpora-
tion. Because of its ionic radius, Ti
4
⫹
is in general sixfold
coordinated by O
2
⫺
. Only at elevated temperatures titanium
can substitute as Ti
4
⫹
in fourfold coordination for Si
4
⫹
result-
ing in exsolution of TiO
2
during cooling (
). Therefore, rutile microinclusions in magmatic quartz
may be frequent.
A different behavior is also observed for the alkali elements
in quartz, which may be both structurally incorporated on
interstitial positions in the quartz lattice and hosted in fluid
inclusions. The results of the ESR measurements show that
there may be a redistribution of interstitial alkali ions in the
quartz lattice during irradiation. The diamagnetic [AlO
4
/M
⫹
]
center transforms into the paramagnetic [AlO
4
]
0
center,
whereas the compensating ions diffuse away under the influ-
ence of irradiation. In contrast, the diamagnetic precursor cen-
ters of [TiO
4
]
0
and [GeO
4
]
0
may capture an electron and
Fig. 11. Plot of bulk Ge content in pegmatite quartz analyzed by
ICP-MS versus concentration of structurally incorporated Ge deter-
mined as paramagnetic [GeO
4
/M
⫹
]
0
centers by ESR measurements.
Fig. 12. Plot of the ratio of the CL emission intensities of the 390 and
505 nm emission bands, respectively, versus the ratio of the trace
element contents of Al and Ge (symbols as in
Fig. 13. Plot of bulk Ti content in pegmatite quartz analyzed by
ICP-MS versus concentration of structurally incorporated Ti deter-
mined as paramagnetic [TiO
4
/Li
⫹
]
0
centers by ESR measurements (the
error bar for low concentrations is in the range of the symbol size).
Only for the quartz samples from the Rubicon Mine, Namibia (circles),
the data show a linear correlation with zero intercept that indicates a
complete presence of Ti as structural substituent for Si. All other
samples have, at least partly, a contribution of Ti from mineral micro-
inclusions (e.g., rutile).
3755
Trace element incorporation into quartz
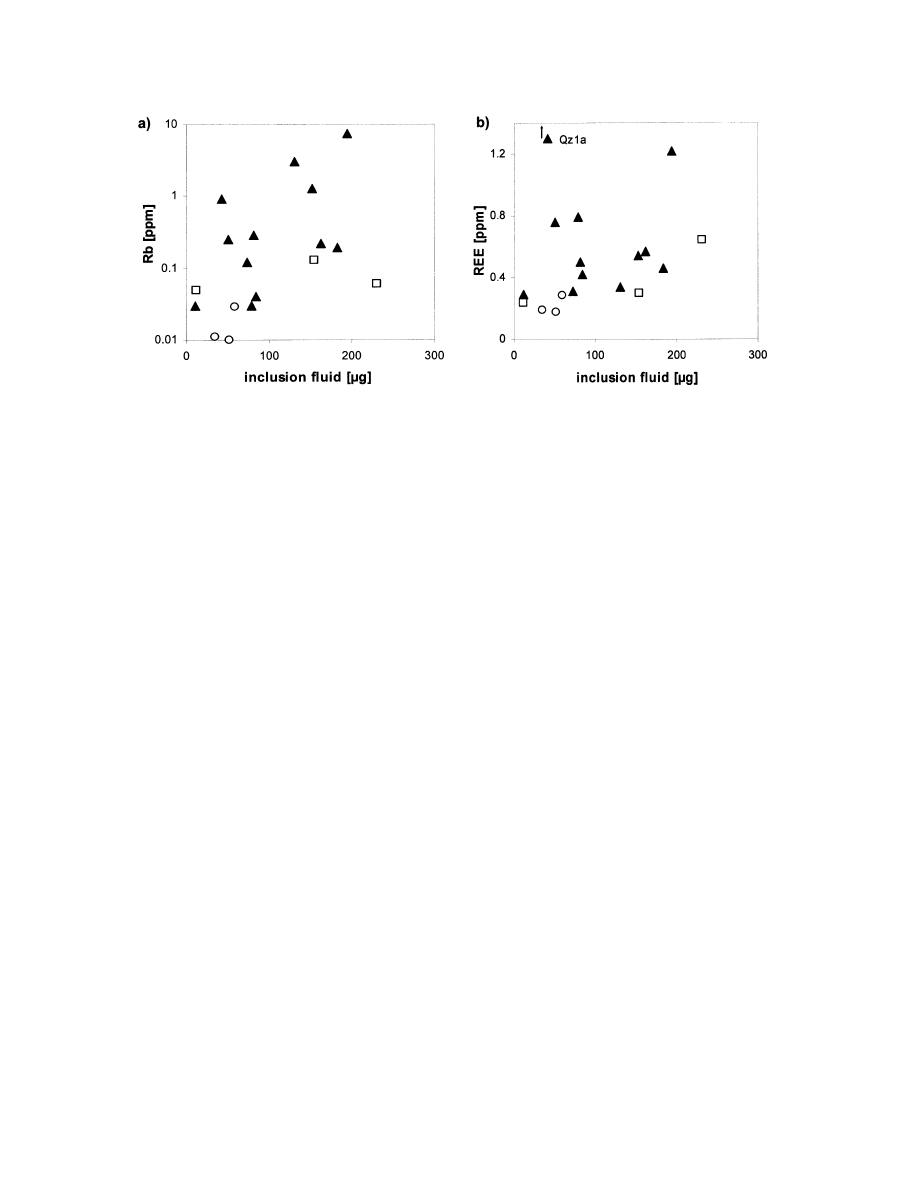
diffusing ions for charge compensating, and form paramagnetic
centers. This is the reason why some of the sample pairs from
single deposits (e.g., samples Qz1, Qz3, Qz15) show good
correlations between bulk element contents and concentrations
analyzed by ESR, whereas others do not. In the latter case, the
Li content is probably not sufficient to compensate all Ti-
related defects and to convert all diamagnetic precursors.
The bulk concentration of Fe in the pegmatite quartz samples
is very low and hardly any structural Fe
3
⫹
could be detected.
This finding is in good agreement with the characteristic high
Ge/Fe ratio (4.5– 0.1) of quartz from pegmatites, compared to
quartz samples of other origin.
In general, the contribution of the fluid inclusions to the bulk
trace element composition may be estimated by using the
volatile content of the quartz samples. The results illustrate that
some trace elements in quartz (in particular K, Na, Ca and Mg)
can be concentrated in fluid inclusions at the ppm level. In
conclusion, not all Na and K may act as charge balancing
cations for Al, as indicated from the correlation in
Several ppm of Na
⫹ K may also be hosted by fluid inclusions.
Interestingly, the Li concentrations in fluid inclusions are gen-
erally very low, even in the quartz samples from Li pegmatites;
the bulk Li content in quartz may reach more than hundred
ppm. In contrast to the other alkali elements, Li seems to be
exclusively incorporated into the structural channels of the
quartz lattice as charge balancing cation for Al, Ge and Ti. This
result confirms previous suggestions of
who proposed a dominant role of Li as charge balancing cation
for Al in granite and pegmatite quartz, compared to the other
alkali earths Na, K, Rb and Cs.
K and Rb show in general a similar geochemical behavior
), but the K/Rb ratio is not constant for quartz and ranges
over an order of magnitude for the investigated samples (
⬃200
for low Rb contents, and
⬃20 for high Rb concentrations).
Thus, Rb must be treated as an individual element and not as an
element “camouflaged” by potassium, a fact that was already
reported for feldspar minerals by Smith (1983). This may
emphasize the conclusion of
and
that rubidium is mainly hosted in fluid
inclusions in quartz although we could not directly analyze it.
The correlation of Rb versus the fluid content (
) illus-
trates the general trend of increasing Rb contents with increas-
ing amounts of inclusion fluid.
Other studies have revealed that fluid inclusions may host a
wide range of other elements (e.g.,
). Results of
Rossman et al. (1987), Ghazi et al. (1993)
and
suggested that besides Rb and Sr, also the lanthanides
are preferentially hosted by the fluid inclusions. Although the
concentrations of these elements could not directly be analyzed
in the present study, there are some indications which support
these conclusions.
The sample pairs (quartz-smoky quartz) in each of the de-
posits show more or less identical chondrite-normalized REE
distribution patterns; however, the absolute concentrations are
different in some cases (e.g., samples Qz1, Qz4, Qz5). Assum-
ing that the REEs are preferentially bound in fluid inclusions,
these differences may be explained by varying abundance of
aqueous inclusions in the quartz samples. Although the abso-
lute concentrations of REE in the inclusion fluids are too low to
be quantified by capillary ion analysis, the results of SEM
studies and GC measurements support this hypothesis. In sam-
ples with high concentrations of
⌺REE, the content of fluid
inclusions and the absolute water content of the samples was
higher than in those with low
⌺REE contents (
). These
results may emphasize the role of fluid inclusions in hosting
REE in quartz. Consequently, the REE contents in quartz may
reflect the chemistry of mineral-forming fluids.
Despite some differences in the chondrite-normalized REE
distribution, most samples show similar patterns with pro-
nounced negative Eu anomalies (Eu/Eu* 0.03– 0.84) and “tet-
rad effects” (
). Recent results of
showed that the convex tetrad effect in samples from magmatic
environments can most likely be explained by formation within
the magma-fluid system before emplacement in the subvolcanic
Fig. 14. Plots of Rb (a) and
⌺REE (b) versus total amount of inclusion fluids in investigated pegmatite quartz samples
(symbols as in
). The diagrams show a general trend of increasing Rb and REE contents, respectively, with increasing
amount of inclusion fluid, indicating that these elements are preferentially hosted by fluid inclusions in quartz. The scatter
may be explained by different absolute concentrations of these elements in the inclusion fluids of the individual samples.
3756
J. Go¨tze et al.

environment, where phase separation causes a split of this
system into fluid and magma subsystems. The negative Eu
anomaly is also assumed to be a characteristic feature of late
magmatic fluids (especially in evolved granitic systems), al-
though there is no relationship between the intensity of the Eu
anomaly and the development of tetrad effects (
For a number of elements the “type” of incorporation in
quartz could not directly be determined. These are especially
those elements that are present in extremely low concentrations
(e.g., U, Th, Nb, Ta, Cs) in quartz. We conclude that these ions
are either too large to substitute for the small Si
4
⫹
ion (0.42A
˚ )
or that they are not soluble in the mineralizing solutions to be
incorporated in fluid inclusions.
con-
cluded that elements such as Be, Nb or Ta are mainly mobile as
gaseous chloro- or fluoro-complexes, because of their low
solubility in aqueous solutions. Probably, traces of these ele-
ments are situated on interstitial places in the lattice or bound
on submicroscopic mineral inclusions (e.g., on grain bound-
aries) that were not detectable during sample preparation.
Some elements, which are concentrated in the specific min-
eralization of certain pegmatites, are not present in elevated
concentrations in the paragenetic pegmatite quartz itself. This
was observed, for instance, for the elements Be, Cs and Rb in
the Li (Be-Cs-Rb) pegmatites of Rubicon or for Nb and Ta for
Nb-Ta bearing pegmatites from Norway. Because of the parti-
tioning effects during crystallization, the concentration of these
trace elements in quartz does not reflect the mineralization and,
thus, cannot be used as petrogenetic indicator.
5. CONCLUSIONS
Trace elements in minerals are important petrogenetic indi-
cators in geosciences. In the present study pegmatite quartz
from different geological settings was analyzed to obtain in-
formation on the general trace element composition and the
different mechanisms of incorporation of certain elements. For
this reason, an analytical combination of ICP-MS, Capillary
Ion Analysis (CIA), Gas Chromatography (GC) and Electron
Spin Resonance (ESR) was chosen. Each of these analytical
techniques provided specific information about the trace ele-
ment uptake in quartz. Because of the very low concentrations
of most elements in quartz, special emphasis was placed on
careful sample selection and preparation. Therefore, the inves-
tigations were accompanied by light and cathodoluminescence
microscopy, fluid inclusion studies and scanning electron mi-
croscopy.
In general, the pegmatite quartz samples show similar geo-
chemical characteristics with low contents of most trace ele-
ments. Only the elements Al, Ti, Ge, Na, K, and Li have
appreciable concentrations in quartz. The results of the ESR
studies, as well as the linear correlation of Al with the charge
compensating cations Li, Na and K, revealed that these ele-
ments are preferentially incorporated on the Si position (Al, Ti,
Ge) or in structural channels parallel to the c-axis (Li, Na, K)
in the quartz lattice. Whereas Li is almost exclusively structur-
ally incorporated and plays the most important role in compen-
sating Al in the quartz structure, some ppm of Na and K may
also be hosted by fluid inclusions. Ti may both be incorporated
as substitutional ion for Si and bound on mineral microinclu-
sions (rutile). In different samples varying proportions of these
two types of trace element input were detected.
Considerable amounts of Na, K, NH
4
, Ca and Mg can be
hosted in fluid inclusions in pegmatite quartz. Additionally,
traces of the metals Co, Ni, Zn, Pb, and Cu were detected by
CIA in fluid inclusions of some samples. Furthermore, there are
indications that the REE and Rb are also bound in fluid inclu-
sions, but the concentrations of these elements are too low to be
measured by CIA. According to their chemical composition,
the fluid inclusions in pegmatite quartz can, in general, be
classified as H
2
O-CO
2
-NaCl type inclusions, with water as the
predominant volatile. Among the anionic complexes, Cl
⫺
,
NO
3
⫺
, HCO
3
⫺
and SO
4
2
⫺
were detected.
For a number of elements the “type” of incorporation in
quartz could not directly be determined. Because of their ex-
tremely low concentrations, the position of these elements in
the quartz lattice could not be revealed by the analytical tech-
niques used. Other sophisticated techniques (e.g., ICP-MS of
inclusion fluids) have to be further developed to provide more
detailed information (e.g.,
For genetic interpretations it has to be concluded that differ-
ent trace elements in quartz behave in very contrasting ways.
Elements such as Al, Ge, Li, REE or element ratios of Ge/Fe or
Th/U seem to be reliable indicators of specific geological
settings. Concentrations of other elements (e.g., Be, Cs, Nb, Ta)
do not reflect the specific mineralization and, thus, cannot be
used as petrogenetic indicators. This fact has to be considered
if trace elements in quartz should be used as pathfinder ele-
ments for geochemical processes.
Acknowledgments—We gratefully acknowledge analytical efforts by
G. Bombach, W. Klemm and B. Ho¨ppner (ICP-MS) and thank A.
Schweiger (Zurich), who made the ESR spectrometer available for
analysis. We also express our gratitude for fruitful discussions with and
comments from U. Kempe and Th. Monecke. Reviews by M. Pagel and
an anonymous reviewer considerably improved an earlier draft of this
article. Editorial handling by U. Reimold is gratefully acknowledged.
Associate editor: U. W. Reimold
REFERENCES
Alonso P. J., Halliburton L. E., Kohnke E. E., and Bossoli R. B. (1983)
X-ray induced luminescence in crystalline SiO
2
. J. Appl. Phys. 54,
5369 –5375.
Bambauer H. U. (1961) Spurenelemente und
␥-Farbzentren in Quarzen
aus Zerrklu¨ften der Schweizer Alpen. Schweiz. Min. Petrogr. Mitt.
41, 335–367.
Baranova N. N., Kozerenko S. V., Grigorian S. S., Daryna T. G., and
Saveljev B. V. (1980) Experimental results about concentrations of
gold and silver in hydrothermal solutions (in Russian). Geokhimiya
8, 146 –157.
Bershov L. V., Marfunin A. S., and Speranskij A. V. (1978) A new
stable radiogenic center in quartz (in Russian). Izv. AN SSSR, ser.
Geol. 11, 106 –116.
Bjørlykke K. (1934) The mineral paragenesis and classification of the
granite pegmatites of Iveland, Satesdal, South Norway. Norsk Ge-
ologisk Tidsskrift. 14, 211–311.
Blankenburg H.-J., Go¨tze J., Schulz H. (1994) Quarzrohstoffe. Deut-
scher Verlag fu¨r Grundstoffindustrie.
Bottrell S. H., Yardley B. W. D., and Buckley F. (1988) A modified
crush-leach method for the analysis of fluid inclusion electrolytes.
Bull. Miner. 111, 279 –290.
Bray C. J., Spooner E. T. C., and Thomas A. V. (1991) Fluid inclusion
volatile analysis by heated crushing, on line gas chromatography:
Applications to Archean fluids. J. Geochem. Explor. 42, 167–193.
3757
Trace element incorporation into quartz

Channer D. M. DeR. and Spooner E. T. C. (1992) Combined gas and
ion chromatographic analysis of fluid inclusions from quartz and
determination of Cl-Br-I ratios in trapped fluids. In Program and
Abstracts of the Pan-American Conference on Research on Fluid
Inclusions, 4:21. University of California.
Channer D. M., DeR., Bray C. J., and Spooner E. T. C. (1999)
Integrated cation-anion/volatile fluid inclusion analysis by gas and
ion chromatography; methodology and examples. Chem. Geol. 154,
59 – 82.
Czamanske G. K., Roedder E., and Burns F. (1963) Neutron activation
analysis of fluid inclusions for copper, manganese, and zinc. Science
140, 401– 403.
Dennen W. H. (1964) Impurities in quartz. Geol. Soc. Am. Bull. 75,
241–246.
Dennen W. H. (1966) Stochiometric substitution in natural quartz.
Geoch. Cosm. Acta 30, 1235–1241.
Dennen W. H. (1967) Trace elements in quartz as indicators of prov-
enance. Geol. Soc. Am. Bull. 78, 125–130.
Fidelis I. and Siekierski S. (1966) The regularities in stability constants
of some rare earth complexes. J. Inorg. Nucl. Chem. 28, 185–188.
Gerler J. (1990) Geochemische Untersuchungen an hydrothermalen,
metamorphen, granitischen und pegmatitischen Quarzen und deren
Flu¨ssigkeitseinschlu¨ssen. PhD thesis. University Go¨ttingen.
Gerler J. and Schnier C. (1989) Neutron activation analysis of liquid
inclusions exemplified by a quartz sample from the Ramsbeck Mine,
FRG. Nucl. Geophys. 3, 41– 48.
Ghazi A. M., Vanko D. A., Roedder E., and Seeley R. C. (1993)
Determination of rare earth elements in fluid inclusions by induc-
tively coupled plasma-mass spectrometry (ICP-MS). Geochim. Cos-
mochim. Acta 57, 4513– 4516.
Goreva J. S., Ma Ch., and Rossman G. R. (2001) Fibrous nanoinclu-
sions in massive rose quartz: The origin of rose coloration. Am.
Mineral. 86, 466 – 472.
Go¨tze J. and Lewis R. (1994) Distribution of REE and trace elements
in size and mineral fractions of high purity quartz sands. Chem. Geol.
114, 43–57.
Go¨tze J. and Plo¨tze M. (1997) Investigation of trace-element distribu-
tion in detrital quartz by Electron Paramagnetic Resonance (EPR).
Eur. J. Miner. 9, 529 –537.
Go¨tze J. and Zimmerle W. (2000) Quartz and silica as guide to
provenance in sediments and sedimentary rocks. In Contrib. Sed.
Geol.21. Schweizerbart-sche Verlagsbuchh. Na¨gele & Obermiller
Stuttgart. 91 pp.
Go¨tze J., Tichomirowa M., Fuchs H., Pilot J., and Sharp Z. D. (2001a)
Geochemistry of agates: A trace element and stable isotope study.
Chem. Geol. 175, 523–541.
Go¨tze J., Plo¨tze M., and Habermann D. (2001b) Origin, characteristics
and practical applications of the cathodoluminescence (CL) of
quartz: A review. Mineral. Petrol 71, 225–250.
Go¨tze J., Plo¨tze M., and Trautmann T. (2004) Structure and lumines-
cence characteristics of quartz from pegmatites. Amer. Mineral. (in
press).
Griffiths J. H. E., Owen J., and Ward I. M. (1954) Paramagnetic
resonance in neutron-irradiated diamond and smoky quartz. Nature
173, 439 – 442.
Hallbauer D. K. (1992) The use of selected trace elements in vein
quartz and quartz pebbles in identifying processes of formation and
source rocks (abstract). In Geol. Soc. South Africa 24th Congress,
Bloemfontein,157–159.
Hallbauer D. K. (1997) The application of capillary ion analysis to the
geochemistry of natural aqueous fluids and in particular to the
analysis of fluid inclusions in minerals. Proc. 30th Int. Geol. Congr.
9, 409 – 424.
Hallbauer D. K. and Kable E. J. D. (1982) Fluid inclusions and trace
element content of quartz and pyrite pebbles from Witwatersrand
conglomerates; their significance with respect to the genesis of
primary deposits. In Orogenesis: The State of the Art (eds. Amstutz
et al.), pp. 742–752. Springer-Verlag.
Heynke U., Leeder O., and Schulz H. (1992) On distinguishing quartz
of hydrothermal or metamorphogenic origin in different monomin-
eralic veins in the eastern part of Germany. Miner. Petrol 46,
315–329.
Jandik P. and Bonn G. (1993) Capillary Electrophoresis of Small
Molecules and Ions. VCH Publishers.
Jung L., ed. (1992) High Purity Natural Quartz. Part I: High Purity
Natural Quartz for Industrial Use. Part II: High Purity Natural
Quartz Markets for Suppliers and Users. Quartz Technology.
Keller P. (1999) Herkunft, Fraktionierung und Mineralisation der Peg-
matite des Karibib-Belts, Namibia. Eur. J. Mineral 11, 120.
Klemm W. (1994) Chemical evolution of hydrothermal solutions dur-
ing Variscan and post-Variscan mineralization in the Erzgebirge,
Germany. In Metallogeny of Collosional Orogens (eds. R. Seltmann,
H. Ka¨mpf and P. Mo¨ller), pp. 150 –;158. Czech Geological Survey.
Larsen R. B. (2002) The distribution of rare-earth elements in K-
feldspar as an indicator of petrogenetic processes in granitic pegma-
tites: Examples from two pegmatite fields in southern Norway. Can.
Mineral 40, 137–151.
Larsen R. B., Polve´ M., and Juve G. (2000) Granite pegmatite quartz
from Evje-Iveland: Trace element chemistry and implications for
high-purity quartz formation. Norges Geologiske Undersøkelse Bul-
letin 436, 57– 65.
Lyakhovich V. V. (1972) Trace Elements in Rock-Forming Minerals of
Granitoides (in Russian). Izd. Nedra, Moscow, 200 pp.
Malinko S. V., Berman I. B., Rudnev V. V., and Stolyarova A. N.
(1976) Inclusions of boron-bearing hydrothermal solutions in quartz
crystals based on (n,
␣) radiography (in Russian). Dokl. Akad. Nauk
SSSR 228, 117–120.
Mason B. (1979) Cosmochemistry, Part I. Meteorites. In Data of
Geochemistry (ed. M. Fleischer). Professional Paper 440-B1. U.S.
Geological Survey.
Mackey J. H. (1963) EPR study of impurity-related color centers in
germanium-doped quartz. J. Chem. Phys. 39, 74 – 83.
Mineeva RM., Bershov LV., and Petrov I. (1991) EPR of surface-
bound Fe
3
⫹
ions in polycrystalline quartz (in Russian). Dokl. AN
SSSR. 321, 368 –372.
Moiseev B. M. (1985) Natural Radiation Processes in Minerals. Izd.
Nedra, Russian, in.
Monecke T., Kempe U., Petersen S., Go¨tze J., Herzig P. and Wolf D.
(1999) Trace element characteristics of quartz from the TAG hydro-
thermal mound (Mid-Atlantic Ridge at 26E08
⬘N). In Mineral De-
posits: Processes to Processing, pp. 551–554. Balkema.
Monecke T., Bombach G., Klemm W., Kempe U., Go¨tze J., and Wolf
D. (2000) Determination of trace elements in the quartz reference
material UNS-SpS and in natural quartz samples by ICP-MS.
Geostand. Newsl. 24, 73– 81.
Monecke T., Kempe U., and Go¨tze J. (2002a) Genetic significance of
the trace element content in metamorphic and hydrothermal quartz:
A reconnaissance study. Earth Planet. Sci. Lett. 202, 709 –724.
Monecke T., Kempe U., Monecke J., Sala M., and Wolf D. (2002b)
Tetrad effect in rare earth element distribution patterns: A method of
quantification with application to rock and mineral samples from
granite-related rare metal deposits. Geochim. Cosmochim. Acta 66,
1185–1.
Morey G. W. (1957) The solubility of solids in gasses. Econ. Geol. 52,
225–251.
Mu¨ller A., Wiedenbeck M., Van den Kerkhof A. M., Kronz A., and
Simon K. (2003) Trace elements in quartz—A combined electron
microprobe, secondary ion mass spectrometry, laser-ablation ICP-
MS, and cathodoluminescence study. Eur. J. Miner. 15, 747–763.
Naumov G. B., Mironova O. F., Saveleva N. I., and Danilova T. V.
(1984) Concentration of uranium in hydrothermal solutions obtained
from investigations of fluid inclusions (in Russ.). Dokl. Akad. Nauk
SSSR 279, 1486 –1488.
Nettar D. and Villafranca J. J. (1985) A programm for EPR powder
spectra simulation. J. Magn. Res. 64, 61.
Nuttall R. H. D. and Weil J. A. (1981) The magnetic properties of the
oxygen-hole aluminium centers in crystalline SiO
2
. I. [AlO
4
]
0
. Can.
J. Phys. 59, 1696 –1708.
Oftedahl Ch. (1980) Geology of Norway. Norges Geol. Undersøkelse
Bull. 357, 1–114.
Pedersen S. (1981) Rb/Sr age determinations on the late Proterozoic
granitoids from the Evje area, South Norway. Bull. Geol. Soc.
Denmark 29, 129 –143.
3758
J. Go¨tze et al.

Peppard D. F., Mason G. W., and Lewey S. (1969) A tetrad effect in the
liquid-liquid extraction ordering of lanthanide(III). J. Inorg. Nucl.
Chem. 31, 2271–2272.
Perny B., Eberhardt P., Ramseyer K., Mullis J., and Pankrath R. (1992)
Microdistribution of Al, Li, and Na in
␣-quartz: Possible causes and
correlation with short-lived cathodoluminescence. Am. Miner. 77,
534 –544.
Pickney D. M. and Haffty J. (1970) Content of zinc and copper in some
fluid inclusions from the Cave-in-Rock district, South Illinois. Econ.
Geol. 65, 451– 458.
Plo¨tze M. (1995) EPR-Untersuchungen an Quarz, Scheelit und Fluorit
aus hochthermalen Seltenmetallvererzungen. Ph.D. thesis. TU Ber-
gakademie Freiberg.
Plo¨tze M. and Wolf D. (1996) EPR- und TL-Spektren von Quarz:
Bestrahlungsabha¨ngigkeit der [TiO
4
⫺
/Li
⫹
]
0
-Zentren. Eur. J. Miner.
8, 217.
Poutivcev M., Kempe U., Go¨tze J., Monecke Th., Wolf D. and Kreme-
netsky A. (2001) Constraints on the genesis of quartz pebbles in
Au-U bearing and barren Witwatersrand conglomerates from CL
microscopy and trace element analysis (abstract). In Cathodolumi-
nescence in Geosciences: New Insights from CL in Combination with
Other Techniques, pp. 71–72. Freiberg.
Rakov LT., Milovidova ND., Kuvshinova KA., and Moiseev BM.
(1985) EPR investigations of germanium centers in natural polycrys-
talline quartz (in Russian). Geokhimiya 9, 1339 –1344.
Rinneberg H. and Weil J. A. (1972) EPR studies of Ti
3
⫹
-H
⫹
centers in
X-irradiated alpha-quartz. J. Chem. Phys. 56, 2019 –2028.
Roedder E. (1984) Fluid Inclusions. Review in Mineralogy 12 646 pp.
Mineralogical Society of America.
Rossman G. R., Weis D., and Wasserburg G. J. (1987) Rb, Sr, Nd and
Sm concentrations in quartz. Geochim. Cosmochim. Acta 51, 2325–
2329.
Schiellerup H., Lambert D. D., Prestvik T., Robins B., McBride J. S.,
and Larsen B. (2000) Re-Os isotopic evidence for a lower crustal
origin of massif-type anorthosites. Nature 405, 781–784.
Schro¨n W., Baumann L., and Rank K. (1982) Zur Charakterisierung
von Quarzgenerationen in den postmagmatogenen Erzformationen
des Erzgebirges. Z. Geol. Wiss. 10, 1499 –1521.
Schro¨n W., Schma¨dicke E., Thomas R., and Schmidt W. (1988a)
Geochemische Untersuchungen an Pegmatitquarzen. Z. Geol. Wiss.
16, 229 –244.
Schro¨n W., Oppermann H., Ro¨sler H. J., and Brand P. (1988b) Fest-
Gas-Reaktionen als Ursache geo- und kosmochemischer Mobil-
isierungs- und Anreicherungsprozesse. Chem. Erde. 48, 35–54.
Serebrennikov A. I., Valter A. A., Mashkovtsev R. I., and Shcherba-
kova M., Ya.. (1982) The investigation of defects in shock-meta-
morphosed quartz. Phys. Chem. Miner. 8, 153–157.
Smith J. V. (1983) Some chemical properties of feldspars. In Feldspar
Mineralogy. Reviews in Mineralogy 2 (ed. P. H. Ribbe) pp. 281–296.
Mineralogical Society of America.
Stavrov O. D., Moiseev B. M., and Rakov L. T. (1978) Investigation of
the relation between the concentration of aluminium centers and
alkali elements in natural quartz (in Russian). Geokhimiya 3, 333–
339.
Stegger P. and Lehmann G. (1989) The structures of three centers of
trivalent iron in alpha-quartz. Phys. Chem. Miner. 16, 401– 407.
Stockmarr P. (1994) A description of pegmatites at A
˚ vesland and Evje,
South Norway (in Danish). M.Sc. thesis. University of Copenhagen,
Denmark.
Susˇcevskaya T. M., Sinjakova S. I., and Markova I. V. (1970) Results
of studies about the concentration of ore elements in hydrothermal
solutions (in Russian). Geokhimiya 6, 693–700.
Suttner L. and Leininger R. K. (1972) Comparison of the trace element
content of plutonic, volcanic and metamorphic quartz from South-
western Montana. Geol. Soc. Am. Bull. 83, 1855–1862.
Taylor S. R. and McLennan S. M. (1985) The Continental Crust: Its
Composition and Evolution. Blackwell.
Van den Kerkhof A. M. and Hein U. F. (2001) Fluid inclusion petrog-
raphy. Lithos 55, 27– 47.
Van Moort J. C., Nand A. S., Cohen D. D., Newman S. and Aung P.
(1990) The use of electron paramagnetic resonance spectroscopy and
trace element content of vein quartz in mineral exploration. In
Exploration Geochemistry 1990 (ed. F. Mrna), pp. 221–228. Proc.
3rd Int. Joint Symp. IAEG and AEG, Geol. Survey, Prague.
Walenczak Z. (1969) Geochemistry of minor elements dispersed in
quartz. Arch. Mineral. 28, 189 –335.
Watt G. R., Wright P., Galloway S., and McLean C. (1997) Cathodolu-
minescence and trace element zoning in quartz phenocrysts and
xenocrysts. Geochim. Cosmochim. Acta 61, 4337– 4348.
Weeks R. A. (1956) Paramagnetic resonance of lattice defects in
irradiated quartz. J. Appl. Phys. 27, 1376 –1381.
Weil J. A. (1984) A review of electron spin spectroscopy and its
application to the study of paramagnetic defects in crystalline quartz.
Phys. Chem. Miner. 10, 149 –165.
Weil J. A. (1993) A review of the EPR spectroscopy of the point
defects in
␣-quartz: The decade 1982–1992. In Physics and Chem-
istry of SiO
2
and the Si-SiO
2
Interface, Vol. 2 (eds. C. R. Helms
and B. E. Deal), pp. 131–144. Plenum Press.
Wright P. M., Weil J. A., Buch T., and Anderson J. H. (1963) Titanium
colour centers in rose quartz. Nature 197, 246 –248.
Yardley B. W. D., Banks D. A., and Bottrell S. H. (1993) Post-
metamorphic good-quartz veins from NW Italy: The composition
and origin of ore fluids. Min. Mag. 57, 407– 422.
3759
Trace element incorporation into quartz
Document Outline
- Trace element incorporation into quartz: A combined study by ICP-MS, electron spin resonance, cathodoluminescence, capillary ion analysis, and g
- INTRODUCTION
- MATERIALS AND METHODS
- RESULTS
- DISCUSSION
- CONCLUSIONS
- Acknowledgments
- REFERENCES
Wyszukiwarka
Podobne podstrony:
Solid phase microextraction as a tool for trace element spec
Trace Element Levels in Hashimoto Thyro Patients with Subclinical Hypothyroidism
Intraindividual stability in the organization and patterning of behavior Incorporating psychological
The incorporation of carboxylate groups into temperature responsive poly(N isopropylacrylamide) base
Intraindividual stability in the organization and patterning of behavior Incorporating psychological
Incorporating Technical Analysis into
Wyk 02 Pneumatyczne elementy
Mars Incorporated
Elementy prawa prawo administracyjne
7 Mikro i makro elementy naszej diety
Wykład 4 Elementarne zagadnienia kwantowe
Elementy klimatu
7 Sposób montażu charakterystycznych elementów
Elementy fizyki jądrowej
Doradztwo i jego prawny element procesu decyzyjnego
więcej podobnych podstron