
The Journal of Undergraduate Neuroscience Education (JUNE), Spring 2004, 2(2):A41-A49
J
UNE is a publication of Faculty for Undergraduate Neuroscience (FUN) www.funjournal.org
Measuring Salivary Cortisol in the Behavioral Neuroscience Laboratory
Brian A. Kalman and Ruth E. Grahn
Department of Psychology, Connecticut College, New London, CT 06320
It is often difficult for instructors teaching laboratory
courses in behavioral neuroscience to find appropriate
experiments that can ethically examine biological
parameters in human participants. In most instances,
the default experiments that allow students to act as
both experimenter and subject tend to be
electrophysiological in nature (e.g., EEG, GSR, etc.).
We report here the use of an experiment module that
utilizes an easily-obtained enzyme immunoassay (EIA) kit
to measure human salivary cortisol. Cortisol is a
hormone of the adrenal cortex that can be used as a
peripheral indicator of hypothalamic neural activity.
Plasma (and salivary) cortisol levels rise due to circadian
influences as well as perturbations in the organism’s
environment (i.e., stressors). The involvement of the
hypothalamic-pituitary-adrenal (HPA) axis in the
pathophysiology of depression makes this an appealing
module to students in behavioral neuroscience
laboratories. Measurement of salivary cortisol takes
advantage of a simple, painless, non-invasive sampling
procedure. The assay can be performed successfully by
anyone with access to a plate reader, a shaker or rotary
mixer, and a few commonly used pipettors. A single
plate assay can be completed in two to three hours.
Students in our behavioral neuroscience laboratory class
have utilized this kit successfully to examine the
circadian cortisol rhythm as well as the effect of
stress/relaxation on cortisol levels.
Key words: neuroscience education, teaching
methods, cortisol, glucocorticoids, stress, circadian
rhythm, depression, anxiety
As instructors who teach laboratory courses in
biological psychology/behavioral neuroscience, we have
often been at a loss to find appropriate experiments
where students are able to play both the role of
experimenter and subject. The difficulty arises because
there are few biological parameters representing CNS
activity that can ethically be examined in human
participants. As a result, the go-to experiments that
allow students to act as both experimenter and subject
tend to be electrophysiological in nature (e.g., EEG,
GSR, etc.). It was our desire to create a laboratory
module that would allow students to collect and analyze
a biochemical measure of human neural activity. We
report here the development of an experiment module
that utilizes an easily obtainable enzyme immunoassay
(EIA) kit (nearly identical to the ELISA) to measure
human salivary cortisol.
Cortisol is a hormone of the adrenal cortex that
can be used as a peripheral indicator of hypothalamic
neural activity. Plasma (and salivary) cortisol levels rise
due to circadian influences as well as perturbations in
the organism’s environment (i.e., stressors) that make it
possible to detect rather robust experimental effects.
Also, there has been much debate on the role of cortisol
and hypothalamic-pituitary-adrenal axis dysregulation in
the pathophysiology of depression making for a clinically
relevant extension to the lecture portion dealing with the
“stress axis” (hypothalamic-pituitary-adrenal or HPA axis).
Collection of salivary cortisol is simple, painless,
and non-invasive and can be performed at any time the
subject desires. Sample storage is convenient as the
samples can be kept in a home freezer. Repeated
freeze-thaws do not adversely affect the determination
of cortisol levels, so the students can just bring them in
on the day of the assay without need of in-transport
refrigeration or instructor/student coordination. The
assay can be performed successfully by anyone with
access to a plate reader and a few commonly-used
laboratory items. A single plate assay can be completed
in two hours (two to three hours by an inexperienced
group of students under supervision).
With the available cortisol kit, our students have
examined both circadian effects and stressor/relaxation
effects on salivary cortisol levels in a laboratory class
setting. The module has been employed twice and we
intend to include it in each semester that the course is
taught. One further impact of the module is that
students have available another avenue of research to
pursue as individual studies or honors thesis projects.
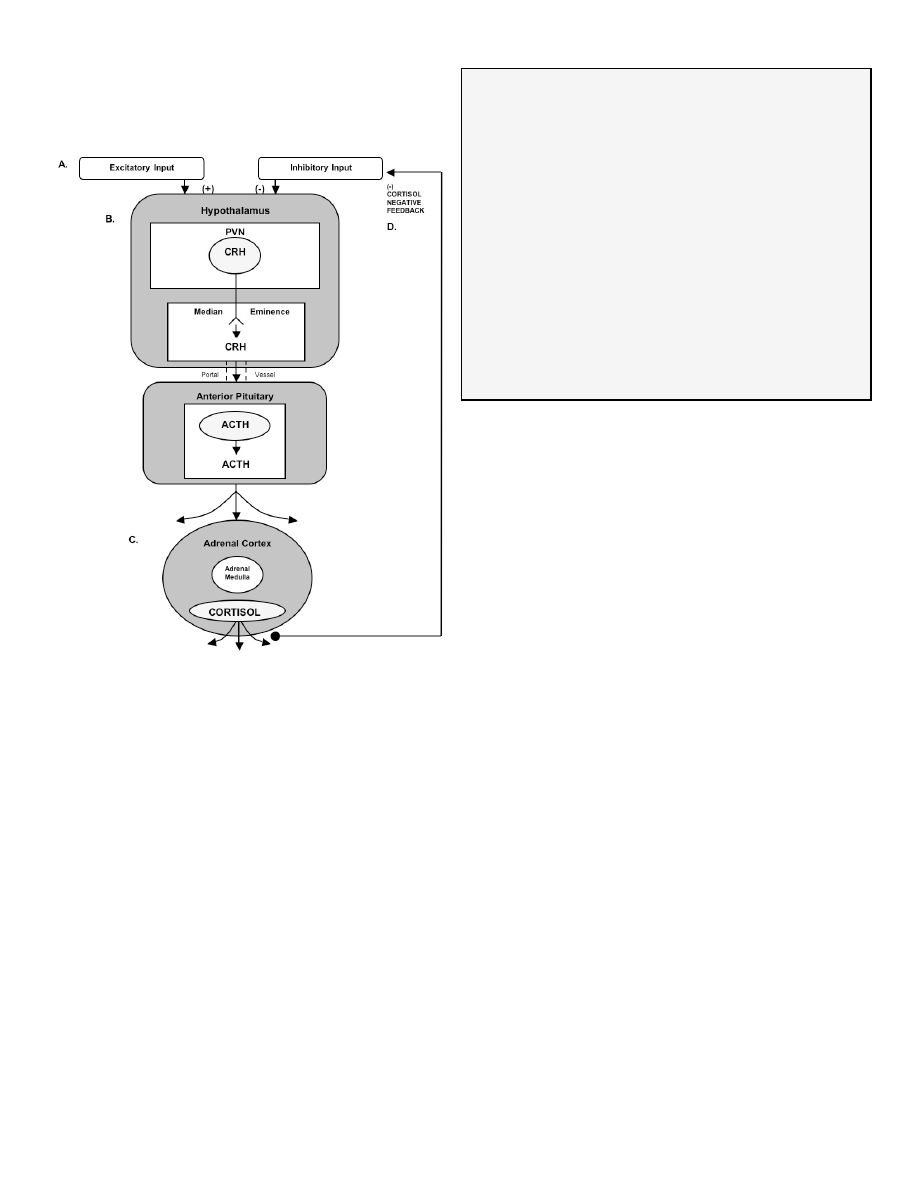
What is the “stress axis”?
The chief components of the “stress axis” (the
hypothalamic-pituitary-adrenal or HPA axis) are the
paraventricular nucleus of the hypothalamus (PVN), the
anterior portion of the pituitary, and the cortex of the
adrenal glands. Cells in the PVN release corticotrophin
releasing hormone (CRH) in response to circadian drive,
a variety of pharmacological agents, trauma, or
psychosocial perturbations (i.e., stressors; Fig. 1). CRH,
traveling in a portal vascular system, binds to
corticotrophs in the anterior pituitary causing the
synthesis/release of adrenal corticotrophin hormone
(ACTH) into the general circulation. In turn, circulating
ACTH binds to receptors on adrenocortical cells resulting
in the synthesis/release of cortisol into the bloodstream
(reviewed by Miller and O’Callaghan, 2002). The typical
circadian pattern of cortisol secretion shows an increase
in the early morning hours that peaks at or slightly before
the time of waking. However, depending on the strength
of the stimulus (e.g., stressor), cortisol levels in the
afternoon and evening can be elevated above those of
the circadian peak. Cortisol exerts its effects throughout
Kalman & Grahn Measuring Salivary Coritsol A42
the brain and periphery primarily through binding to two
known types o f
corticosteroid receptors—the
glucocorticoid receptor and the mineralocorticoid
receptor.
Figure 1. Components and Secretagogues of the HPA Axis.
A. With sufficient input, neurons in the paraventricular nucleus
(PVN) of the hypothalamus release corticotrophin releasing
hormone (CRH) into the portal system connecting the anterior
pituitary (B.), causing adrenal corticotrophin hormone (ACTH) to
be released into the general circulation. C. Adrenal cortical
cells respond to ACTH by producing and releasing the steroid
cortisol, which is distributed throughout the body via the
general circulation. D. One of cortisol’s many functions is to
provide negative feedback through receptors located in the
hypothalamus and pituitary, thus keeping HPA axis activity in
check.
The HPA Axis and Depression
For some time, it has been known that a
significantly higher percentage of depressed patients
suffer from hypercortisolism than the general population
and many other depressed patients who do not show
classic hypercortisolism respond poorly to clinical
challenges to this system such as the dexamethasone
suppression test (DST). The increased incidence of
hypercortisolism or abnormal response to a
glucocorticoid suppression test observed in depressed
patients has lead to hypotheses suggesting that
depressed patients have a decreased sensitivity to the
negative feedback effects of cortisol brought about by a
decrease in responsiveness or number of corticosteroid
receptors (reviewed by Holsboer, 2000).
What is the Dexamethasone Suppression Test?
Dexamethasone is a synthetic corticosteroid that
has similar activity/effects to those of cortisol but is
structurally unique enough that it does not confound the
measurement of plasma/salivary cortisol levels when
administered to patients. In the dexamethasone
suppression test (DST), a small dose of dexamethasone
is taken at bedtime. In a normal individual, the morning
plasma concentration of cortisol (which would normally
be high—remember this is the circadian peak) will be
diminished due to the negative feedback effects exerted
on the axis by the exogenously administered
dexamethasone. In a subpopulation of depressed
patients (and patients with certain other medical
disorders), morning cortisol levels remain elevated. This
finding suggests that these patients have a
dysfunctional HPA axis negative feedback mechanism.
More recently, the DST has been combined with a CRH
challenge further increasing the sensitivity of the test to
HPA axis.
What Does the Assay Kit Measure?
Researchers have argued over whether the HPA
axis dysfunction observed in depression is simply an
epiphenomenon or is causally implicated in the
pathophysiology of the disorder (Krieg, 1994). Those
arguing for a causal role of hypothalamic-pituitary-
adrenal disturbance in depression may point to many
lines of evidence including: 1) hypothalamic-pituitary-
adrenal axis disturbance often precedes other
depressive symptoms or resolves with antidepressant
treatment days or weeks prior to relief of depressive
symptomology; 2) "at risk" first degree relatives of
depressed patients who have not yet had a depressive
episode have an increased incidence of hypothalamic-
pituitary-adrenal axis dysregulation; 3) individuals on
steroid therapy for other disorders often suffer from
"steroid psychosis" and 4) in a few studies, direct steroid
manipulation in depressed patients has alleviated
symptomology (reviewed by Holsboer, 2000; Holsboer
and Barden, 1995). Whether the association between
HPA axis and depression is causal, epiphenomenal, or
both, it is known that processes altered in depressed
patients (e.g., mood, cognitive ability, sleep patterns,
eating behavior with weight changes, immune function,
and activity levels) are known to be affected by
administration or removal of corticosteroids.
Why Measure Cortisol as a Laboratory Exercise?
1. The primary interest in systemic cortisol levels is that
they provide an indirect readout of CNS
function/activity. Working backwards, an increase in
plasma (or salivary) cortisol levels logically implies that
circulating ACTH levels have increased as a result of
the increase in activity of CRH-containing neurons in
the hypothalamus.
2. The sampling procedure is simple, non-invasive, and
can be done easily outside the laboratory at the
convenience of the students
and under naturalistic
conditions.
The Journal of Undergraduate Neuroscience Education (JUNE), Spring 2004, 2(2):A41-A49. A43
3. The HPA axis is highly responsive. The effects are
robust enough that both circadian effects and
stressor effects should be observable in the
laboratory classroom setting.
4. The relationship between psychological disorders
(e.g., depression) and increased cortisol levels or
HPA axis dysfunction has been hotly debated (i.e.,
cause or epiphenomenon). This adds texture to the
lecture portion of the class dealing with HPA axis
function and we have found that this aspect is of
great interest to the students (many of whom will go
on to clinical pursuits).
The assay kit measures the amount of free
cortisol present in saliva. Circulating cortisol is largely
bound by globulins (cortisol is generally not thought to
interact with corticosteroid receptors while in this bound
state). With some assays, total cortisol is measured but
because large molecules (e.g., binding globulins) cannot
penetrate the acinar cells of the salivary gland, all
cortisol in the saliva is thought to be in a free state.
Correlation (r) between free salivary cortisol and free
plasma cortisol levels are widely reported to be
approximately 0.90 (Kirschbaum and Hellhammer, 1989;
1994).
MATERIALS AND METHODS
Materials Needed
Table 1 shows the materials needed/suggested
to perform this assay. The left-most column illustrates
the best-case scenario (including requirements listed by
DSL Laboratories). We have included other less-
desirable options, some of which we actually used in our
own class demonstration (in italics), and other options
that we believe will work but have not been tested.
Instructors should arrange to perform a pilot study with
one of the kits to make sure that your
equipment/supplies are compatible with the kit.
Table 1. Materials Needed
Most Desirable
Least Desirable
Dual Wavelength Plate
Reader
(450 nm and 600 or 620 nm
correction)
Single
Wavelength
Plate Reader
(450 nm)
Automatic Plate Washer
Hand Vacuum-
Type Plate
Washer
P 1000 Adjustable
Pipetter or squeeze
bottle
Pipette to deliver 25 ml
Multichannel Repeater to
deliver 100 ml
Single Tip
Repeater to
deliver 100 ml
P 200 or P 250
Adjustable Pipette
Microtitration Plate Shaker
Rotary Mixer
Agitate by hand
Absorbent Bench Paper
Paper Towels
Deionized Water
Vortex Mixer
Salivettes
Microfuge Tubes
and Cotton Balls
Centrifuge Capable of
Spinning Salivettes
No centrifuge
needed if cotton
is employed
Cortisol Kit (1 plate per 2-8
students
Disposable Latex Gloves
The Mechanics of Sample Collection
If using microfuge tube and cotton
We have found that using a standard microfuge
tube and cotton ball (we utilized real cotton rather than
synthetic puffs) works well, is significantly cheaper than
using the Salivettes™ (Sarstedt, Newton, NC;
www.sarstedt.com), does not require centrifuging, and
the cotton balls actually have a less objectionable taste
than the standard Salivette™ gauze plug (they do offer
flavored plugs but we believe these add to the already-
substantial cost of the Salivette™). At the point the
student wishes to collect the sample, he/she should
simply pop the cotton ball into his/her mouth. The
students should roll the cotton ball around with their
tongue and gently chew to stimulate salivation. The
goal is to completely saturate the cotton with saliva. This
will take about one minute. If a student has a
particularly dry mouth that will make it difficult to obtain a
sample, he/she can chew on an inert substance (like
Parafilm™ squares) for a few seconds to stimulate
salivation (do not use gum or any other food-type
product).
When the cotton is saturated, the student can
pop open the lid to the microfuge tube and, with clean
hands or while wearing latex gloves, squeeze contents
of the cotton ball into the microfuge tube. Any mucus
should stay trapped in the cotton and the saliva sample
should look clear with no wispy precipitate. Two hundred
µl is sufficient.
The cortisol in saliva is remarkably stable and
would probably survive a month or more at room
temperature. However, the saliva will grow mold and
acquire a disgusting smell within a few days. So, given
that repeated freeze-thaw cycles are not a problem with
this molecule, students should get their samples (in their
microfuge tubes) into a freezer (theirs or yours) at the
earliest opportunity (within three days, maximum).
Unless part of the experimental manipulation
(e.g., hungry vs. sated), it’s probably best if students do
not eat or drink an hour or two before sampling.
Students should absolutely not drink an acidic beverage
(like fruit juice) just prior to sampling. The reduction in pH
will give an artificially high reading for cortisol in this
assay. If they do drink something acidic, they must wait
at least a half-hour before sampling. Even water should
not be drunk immediately prior to sampling as it may
dilute the sample.
If using the Salivette™
After saturating the gauze cylinder it is placed
into the upper chamber of the tube and the cap is
snapped in place. Samples in these tubes can also be
frozen as is. On the day of the assay, Salivette™
samples can be thawed and then spun at low speed to
separate the saliva sample from the gauze.
The Salivary Cortisol Assay
Figure 2 shows the steps involved and the
reagents used in the salivary cortisol kit produced by
Diagnostics Systems Laboratories, Inc. (DSL, Webster,
Texas; www.dslabs.com). The assay includes all
necessary reagents including known cortisol
concentrations for creating the standard curve. The
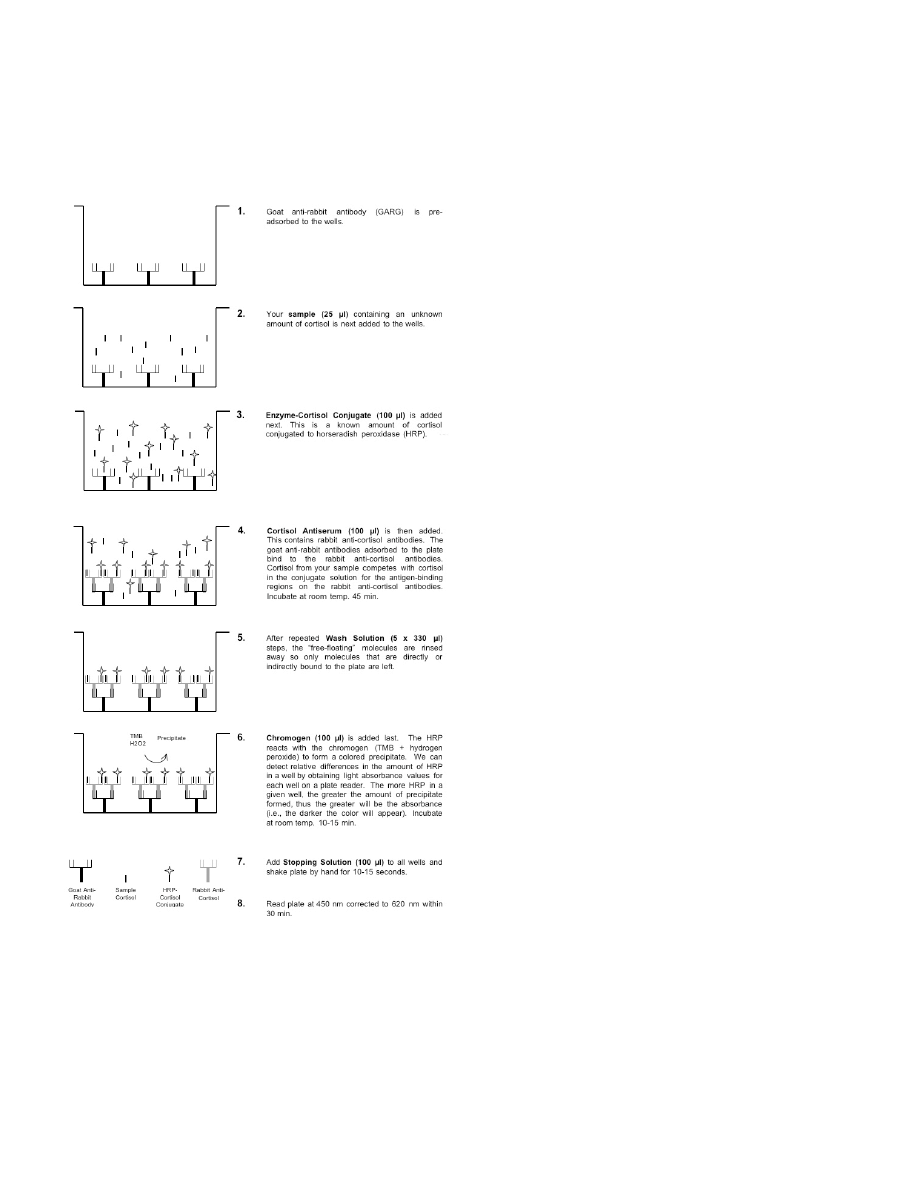
Kalman & Grahn Measuring Salivary Coritsol A44
assay takes about two hours to complete (a little longer
for inexperienced students under direct supervision). A
single, one-time-use, 96-well plate (12 individual strips of
eight wells) costs about a hundred dollars at the time of
this writing. A similar kit for a similar price is made by
Salimetrics (State College, PA; www.salimetrics.com), but
we have no direct experience with the Salimetrics kit.
Figure 2. Steps of the salivary cortisol enzyme
immunoassay (EIA). The kit obtained from DSL contains 96
wells to which solutions are addeds as described for each step
(1-8) in the figure.
Experimental Design
There are essentially two types of studies that
can be performed. The first examines cortisol levels with
respect to circadian periodicity. It compares samples
that the students take in the early morning to those
taken later in the day. The second type is a planned
experiment where the students can play a role in
determining what the hypothesis and independent
variable will be. With eight students per plate (what we
feel is the maximum), each student can run four
separate samples (in duplicate). The design that we
employed was to have students collect two samples for
each type of study. Each student was provided with a
“sampling kit,” a plastic bag containing labeled microfuge
tubes, small cotton balls, latex gloves, and a coded data
sheet (for maintaining privacy).
Study Type 1: Examining Circadian Periodicity Using
The Whole Class
For this type of study, the student should obtain
one sample around the time of the expected circadian
peak (generally thought to be upon—or just prior
to—waking). Again, a college student may be different
than other members of the population in that a given
student may set their alarm for 7:00 AM on Monday,
Wednesday, and Friday, 9:00 AM on Tuesday and
Thursday, and, after being relatively sleep-deprived
during the course of the week, wake up at noon without
the aid of an alarm on the weekend. For these reasons,
the best one can do is to have students take the AM
sample upon waking (6:00 - 9:00 AM). Students should
keep the sample kit on their nightstand so they can do it
immediately upon awakening. Participants will likely take
this sample at different times based on their schedule so
there will probably be representation at several time
points around a theoretical peak.
Students should obtain a second sample at
some point within a noon - 10:00 PM window (the exact
time should be left to the student; it does not matter
what the rest of the group is doing and it does not have
to be taken on the same day as the AM sample). It
should be taken when they feel pretty relaxed and have
not been going at a hectic pace for several hours.
There should be no alcohol in their system, etc. They
should be clearly instructed to not, for instance, take this
sample while they are bustling through classes at school.
If there is an evening when they plan to watch three
hours of television to unwind and have no pressing
engagements the next day (such as having to give a
presentation), this would be a good time to obtain the
PM baseline sample.
Study Type 2: Small Group Experiment
Individual groups of students (four to eight) can
conduct a within-subjects experiment of their choosing
(within appropriate limits). Students can design it as a
group and write a proposal with specific methods of
collection, concise description of the independent
variable, and instructions to participants. For instance, a
group may wish to see if there is a difference between
their at-class cortisol levels and their away-from-class
cortisol levels. The samples should be taken on different
days but at a similar time-point within each day. Thus, a
student may take a 1:00 PM sample at school on
Thursday, then take a 1:00 PM sample at home the
following Saturday. For examples of the types of
manipulations that have produced changes in cortisol,
Kirschbaum and Hellhammer (1994) provide a
The Journal of Undergraduate Neuroscience Education (JUNE), Spring 2004, 2(2):A41-A49. A45
comprehensive table of published experimental
manipulations and their effect on cortisol levels.
The Assignment
After a general explanation of the lab module,
HPA axis background, and sample collection
instructions, students can divide up into small groups
(four to eight students). Each group can meet and
decide on an experiment and write a small proposal. This
can be handed in to be approved and/or modified by the
instructor. Allow a minimum of several weeks between
the handing out of sampling kits and the actual running
of samples in the laboratory. During the actual
laboratory meeting, we used the downtime during
incubation steps to show students what they would be
doing with their raw data once the assay was completed.
Students can be given a worksheet and graph paper
(such as those generated using Graph Paper Printer™
software obtained from www.hotdownloads.com) and
instructed in their use during this downtime. Once the
assay is completed and the plate for a particular group
has been read (we had groups sign up for specific assay
times staggered throughout two days), students can be
asked to do the following:
1. Take the raw optical density values from the plate
reader printout and manually transform standards
and sample optical density values to “proportion of
zero absorbance” using the worksheet (logit values
cannot be ≥ 1 so are best presented as the percent
of some standard). For instance, if the absorbance
for the zero standard had an optical density of 1.82,
a sample having a raw absorbance of 1.43 would
have a proportion of zero absorbance of: 1.43 ÷ 1.82
= 0.79.
2. Manually plot the standard curve (using the
proportion-of-zero values and omitting the zero point
from the curve) and estimate the level of cortisol in
your samples on three types of graphs by visual
interpolation:
Linear: shows the student what an exponential
dose-response function looks like and the
inherent difficulty in predicting sample levels
based on a curved line.
Log-Linear: shows how exponential data can be
transformed into a relatively straight line utilizing a
concept (common logarithms) with which the
student is already familiar.
Log-Logit: shows another type of straight-line
transformation and allows students to visualize
what our spreadsheet calculates.
Although students were responsible for hand-
calculating cortisol values for their own samples,
because of time and resource constraints, we entered all
student raw data into the spreadsheet ourselves and
gave students a copy of all data at the next class
meeting. The spreadsheet we created for data
reduction utilized a log-logit transformation but any
curve-fitting program will do and even manual data
reduction via the graph printouts should provide usable
data. Once students have been given the data for the
entire class, they can be asked to:
• Create a scatter plot of each student’s (i.e., the
entire class) AM value and PM baseline value (or the
lowest of their PM values). Cortisol levels should be
plotted against time of day. Alternatively, a
categorical column graph of AM vs. PM could be
generated.
• Perform a regression analysis on the circadian data
or (alternatively, based on level of sophistication)
divide the data into discrete groups (i.e., AM vs. PM)
and perform the proper t-test on the group means.
• Create at least one figure and perform at least one
analysis on their experimental “group” data.
• Write an APA style paper (including figures and
analyses above) with Study #1 being the “Circadian
Periodicity” part of the lab and Study #2 being the
“Group Experiment” aspect. The three graphs (linear,
log-linear, and log-logit) and hand-calculated cortisol
estimates using each graph type can be attached to
the paper as an appendix.
RESULTS AND DISCUSSION
Professors’ Pilots of Circadian Periodicity (within-
subjects, N=2)
When the kits were first received, we ran a pilot
to identify any potential glitches with the assay and to
make certain that we could obtain quality results with the
equipment and supplies that we had on hand. Our first
pilot (Table 2) showed a reasonable time-of-day effect
(values shown below are means of duplicates expressed
as µg/dl of free cortisol) with the AM samples (near the
time of the suspected circadian peak) clearly elevated.
Table 2. Professors’ Pilot #1
Subject
AM Sample At Home
PM At Home
#1
0.63
0.47
#2
0.66
0.17
A month later (long after the saliva collection kits
and collection instructions had been handed out to
students), we thawed and re-assayed the original
samples to check for between-assay precision after a
freeze/thaw cycle but we also collected impromptu PM
samples while at school. We ran these along with the
original samples. Data from this assay are shown in
Table 3.
Table 3. Professors’ Pilot #2
Subject
AM Sample At Home
PM At Home
PM At School
#1
0.68
0.43
0.81
#2
0.67
0.19
0.83
In addition to observing high assay precision in
samples that had undergone freeze-thaw (0.68 vs. 0.63
for Subject #1 and 0.67 vs. 0.66 µg/dl for Subject #2),
we also observed (somewhat surprisingly) a clear “effect
of school” on cortisol levels. Cortisol levels for subjects
#1 and #2 were two and four times higher respectively in
those samples collected at school vs. the samples taken
Kalman & Grahn Measuring Salivary Coritsol A46
at a similar time of day at home. In fact, they were
higher than either AM sample. This was our first
suspicion that students might have difficulty obtaining
low PM baseline samples.
Class Data
The data shown below are examples of actual
data gathered by students in our Behavioral
Neuroscience class. Students were given their sampling
kits and instructions for sampling three to four weeks
before we were scheduled to run the samples in lab.
Students were allowed to divide up into groups of four to
eight and design an experiment. Each student was
allowed to collect and assay four different samples. Two
of these samples were used for the circadian periodicity
portion of the assignment and data for the entire class
was pooled. Two were used for an experimental
manipulation of each group’s choosing/design. In some
cases, the PM circadian sample was used as the
experimental control.
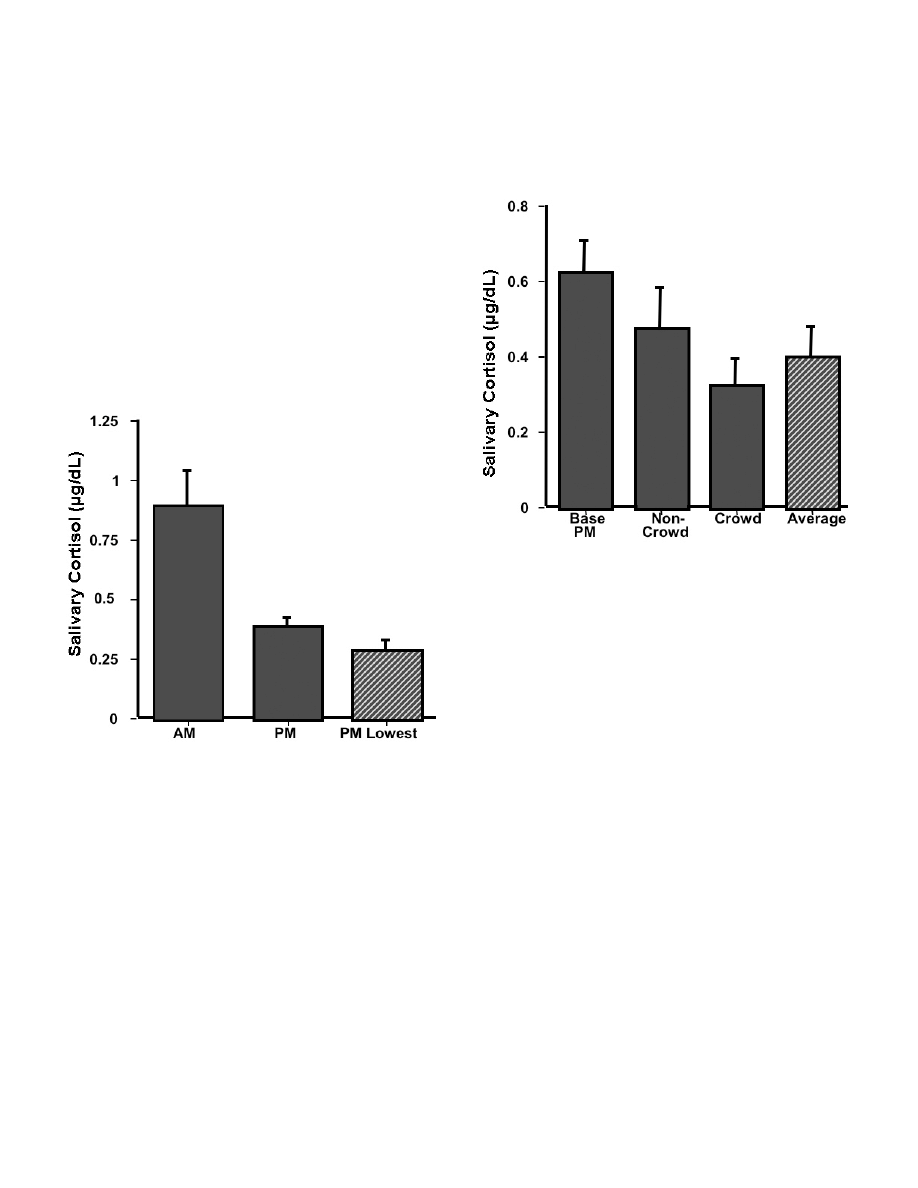
Figure 3. Circadian Periodicity Study. AM and PM cortisol
samples were obtained by the entire class (N=21). One
morning sample was collected between 6 and 9 in the morning
(AM) immediately upon waking.
1. Circadian Periodicity Study (within-subjects design,
N=20, entire class)
All students were told to obtain one sample
immediately upon waking (AM Sample; 6:00 - 9:00 AM)
while the other sample (supposed no-stress PM control;
Noon - 10:00 PM) was to be taken while they were
relaxed, had not been going at a hectic pace for a
couple of hours, and had no pressing engagement
(such as a class presentation) in the near future. Figure
3 shows that a circadian rhythm was observed, with AM
cortisol levels significantly greater than PM levels (t(19)=
2.97, p < 0.01).
The magnitude difference between AM and PM
cortisol levels in a previous class (data not shown) was
not as robust as the present data. We had observed
that students’ chosen PM control often did not represent
subjects’ lowest PM value taken (i.e., there was a large
difference between mean PM control and mean of their
lowest PM sample of all samples taken). We have
included in Figure 3 the mean lowest PM value of the
current group of subjects for comparison. The very
negligible difference illustrates that this group of
students did a much better job of obtaining PM samples
under “basal” conditions.
Figure 4. Effect of Exercise. Cortisol samples were collected
by four students who were interested in the effect of exercise
in crowded and uncrowded conditions on cortisol levels. They
collected samples immediately after completing four weight-
lifting exercises, once when the athletic center was crowded
and once when it was uncrowded. Their PM circadian sample
was used as a baseline. Data are presented as mean µg/dL +
SEM.
2. Group Experiment: Effect of Exercise in a
Crowded Athletic Center (within-subjects, N=4)
This group tried to determine the effect of
exercising in a crowded athletic center on cortisol levels.
They collected saliva samples under two exercise
conditions: once when the athletic center was crowded
and once when it was relatively uncrowded. Their
hypothesis was that exercise itself would increase
cortisol levels and that the crowded condition would be
more stressful than without the crowd, adding to the
exercise-induced cortisol level. They collected the
samples immediately after completing a rotation of four
exercises and compared the cortisol levels from that to
their PM circadian sample. As shown in Figure 4, their
hypothesis was not supported. Not only did exercise
seem to reduce cortisol levels, but the crowded condition
produced the lowest levels. The group offered the
following interpretation: the low levels observed in the
crowded condition were due to the social support that
the group members offered each other which was not
present in the uncrowded condition.
Perhaps a more parsimonious explanation is that
any exercise regime is really part of an unrealized
“decompression” strategy and cortisol samples taken
during this time tend to reflect a point at which cortisol
The Journal of Undergraduate Neuroscience Education (JUNE), Spring 2004, 2(2):A41-A49. A47
levels tend to be lower (Average bar represents a single
mean exercise level for each subject rather than
separate crowded and non-crowded levels and when
compared to PM Base t(3)=9.09, p < 0.01.) Notice the
relatively high basal PM levels for subjects in this group.
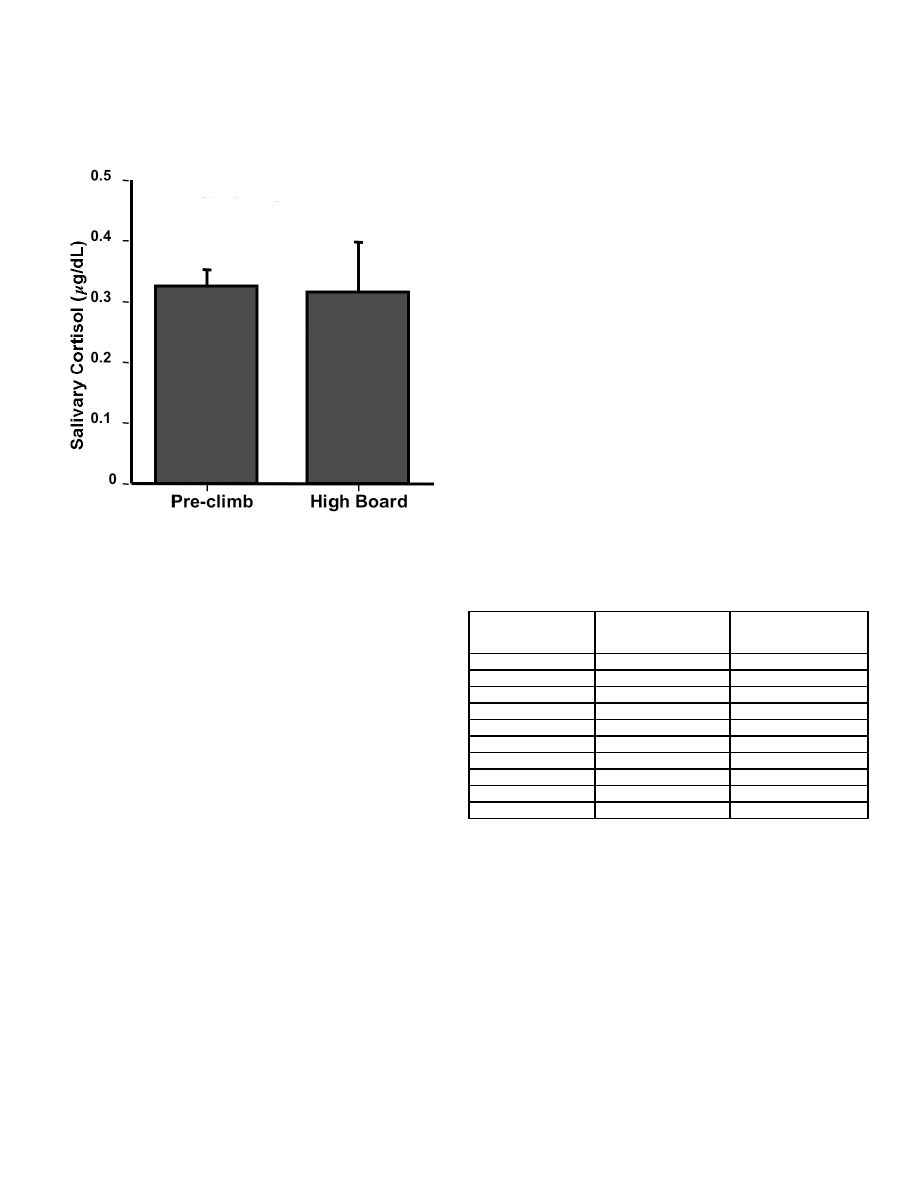
Figure 5. Effect of High Dive Exposure. Four students
collected saliva samples before and after a two minute
exposure to the high dive. Data are presented as mean µg/dL
+ SEM.
3. Group Experiment: Effect of High Dive Exposure
(within-subjects, N=4)
Although no significant effects were observed by
this group, this experiment illustrates the free creative
process that students really seem to enjoy with this
paradigm. This group was interested in examining the
effect of being on the high dive on cortisol levels. They
hypothesized that exposure to the high dive would serve
as an acute stressor and would produce a significant
increase in salivary cortisol, which would be especially
noticeable in the group members who did not have
experience on the high dive (two were experienced, two
did their best to avoid heights and had never been on
the high dive). They went to the athletic center as a
group and collected a sample at the base of the high
dive (pre-climb). Then each participant individually
ascended the ladder and went to the end of the diving
board, remaining there for two minutes. Another saliva
sample was collected two minutes after climbing down
from the board. As Figure 5 shows, there was no effect
of high dive exposure. The group members were
surprised by these data, as heart rate data collected at
the same time showed a marked increase. One
possibility that they offered was that the anticipation of
doing the experiment may have been a stressor itself,
stimulating the negative feedback system and producing
low cortisol levels. This is certainly a feasible contributor
toward lower cortisol levels. Another possibility is that
their sampling schedule did not allow for cortisol to reach
peak levels in the saliva, and that the sample should
have been taken 10-20 minutes after the diving board
exposure.
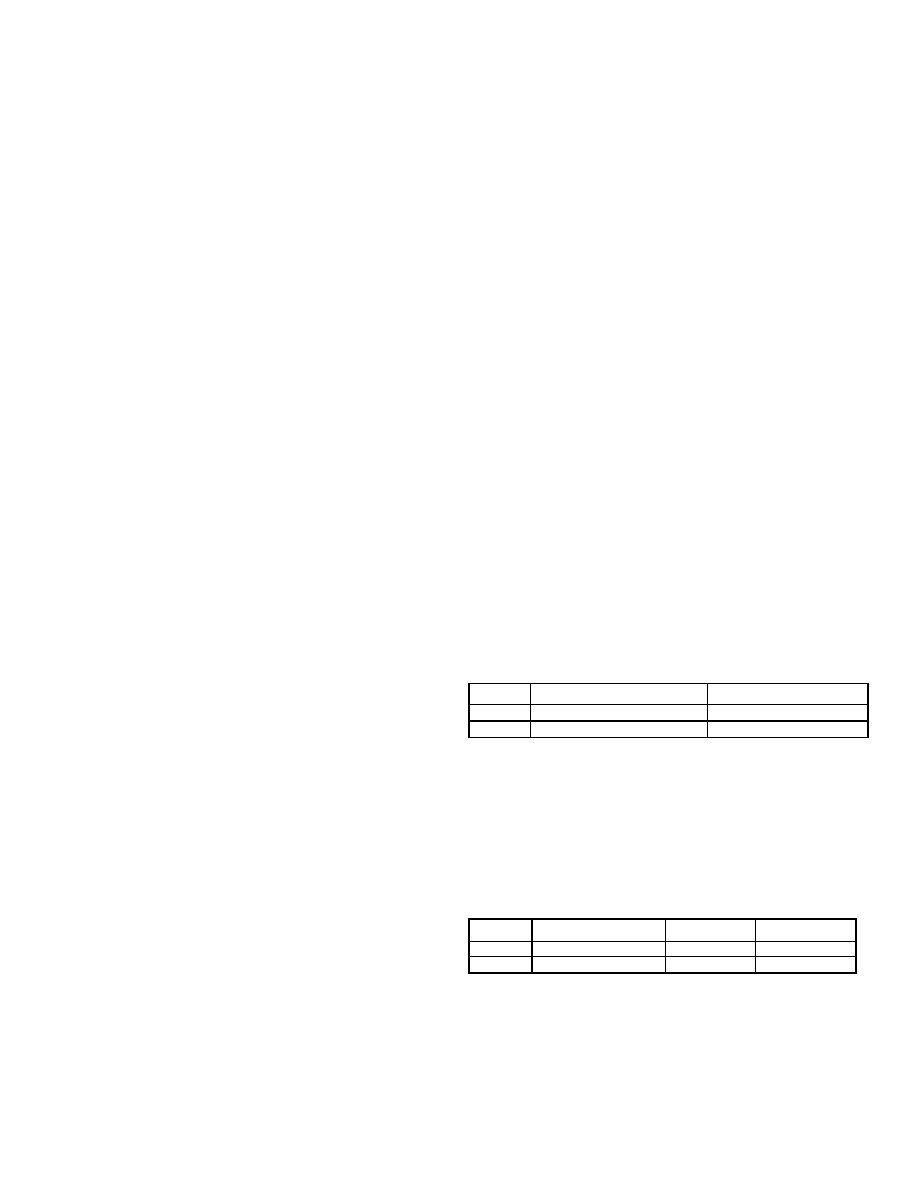
Overall Precision of Sample Duplicates in Different
Lab Groups
One way of assessing “believability” of the
student data is to examine the overall precision of their
assay duplicates. Table 4 shows the mean differences
between sample duplicates (standard curve not included
as these were initially loaded onto the plate by the
instructor) for each of 10 groups (each group ran their
own samples on their own plate) from two different
classes.
Assay error (by each group of four to six
students) ranged from an extraordinary 5% mean
difference with no large (defined by us as ≥ 40%)
difference observed in any duplicate to an unacceptable
53% mean difference with almost half of the sample
duplicates containing large errors. Had we had an extra
kit on hand, we would have made these students re-run
their samples. Generally, results will not be this poor and
the few samples that have a really large percentage
difference can be re-run with spare reagents and strips
or excluded from analysis without significantly impacting
the study. With the exception of one group, these data
clearly illustrate that, with supervision and rudimentary
pipette training (we consider it essential that students
get to practice pipetting, perhaps during previous lab
meetings that do not take the full class period), students
are capable of obtaining usable salivary cortisol data
with this kit.
Table 4. Assay Precision of Two Classes
Mean % difference
between sample
duplicates
Number of duplicate
sample sets run by
each group
Number of duplicates
that had ≥ 40%
difference
5%
24
0
7%
16
0
7%
20
1
8%
15
0
10%
11
0
12%
24
3
14%
24
3
15%
14
2
15%
15
1
53%
24
11
CONCLUSIONS
Measurement of salivary cortisol, with the aid of
an easily obtainable kit, is an ideal human subject
project (and a terrific alternative to electrophysiological
recording) for a course in Physiological Psychology or
Behavioral Neuroscience. It can also be utilized as a
demonstration in a Behavioral Endocrinology lecture or
seminar course where students can self-sample under a
variety of conditions. The professor can then easily run
the samples by him/herself in a couple of hours and
report the data to the class.
One important issue that must be addressed
before adopting this laboratory exercise is the proper
procedure for ensuring both anonymity during data
collection and the proper context for interpreting cortisol
levels. This is especially important because of the

Kalman & Grahn Measuring Salivary Coritsol A48
relationship between cortisol and depression. Although
we have made a point in our lectures to students that
cortisol levels are not diagnostic alone, and that college
students in particular have wide day-to-day variations, it
is likely that a student will attempt to interpret how their
own level relates to their mental health. Our procedure
to ensure privacy was to code microfuge tubes with
numbers such that only the student would be aware of
his/her own set of numbers. In addition, the data was
discussed with regard to means and not by individual
data points.
Another ethical issue is whether to seek
institutional review board (IRB) approval for this project.
The first time that we utilized this paradigm an IRB
representative advised us that we did not need IRB
approval because this fell under the rubric of “classroom
demonstration.” Only later did we decide that it was
successful enough as a laboratory exercise to share with
other instructors via publication. Thus, prior to our
second time utilizing this project as part of a Behavioral
Neuroscience course, we obtained IRB approval with
publication in mind. We leave it to the independent
instructors/institutions as to whether or not approval from
their IRB is necessary.
A methodological concern that we have
regarding the quality of data generated using this
laboratory exercise is the potential difficulty in having
active college students collect “no-stress” PM samples
that are to serve as a basis for comparing both circadian
peak samples as well as samples collected under times
of stress. With a very hectic campus life, some students
may find it difficult to obtain a true no-stress sample.
Kirschbaum and Hellhammer (1989) report that in a
study with 48 students and 54 young mothers (as
opposed to older subjects), only the early morning
values showed stability over three days. They found
considerable intra-subject variability across days at other
time-points throughout the day.
Getting good samples can be maximized by
passing out the sample kits/instructions early in the
semester and not running them until late in the semester
so that students aren’t rushed into taking samples at
undesirable times. Also, since microfuge tubes and
cotton are inexpensive, a good strategy may be to have
each student obtain several samples during the PM or
AM on different days and then combine the samples in
equal volume prior to assaying (thus assaying a single
“Average AM” or “Average PM” sample derived from four
or five samples taken on different days). While we did
not encounter a widespread problem obtaining relatively
low PM cortisol samples in the data presented here, it
was an issue in our prior experience. We wonder if
emphasizing this problem while providing students with
sample collection instructions was instrumental in
achieving the excellent circadian rhythm data in the
present study.
While we are happy with the circadian data this
semester, only one group was able to show some type
of effect in the small group experiment. The data for the
exercise experiment (Figure 4) are typical of results that
we have found in a previous class. That is, the data
make sense ex post facto but do not support the original
hypothesis of the student researchers. In a group from a
previous class (data not shown), it was hypothesized
that watching a scary movie would produce higher
cortisol levels than watching a comedy. No such
difference was observed but, similar to the exercise
effect, they found that watching any movie resulted in
lower cortisol levels than their alleged “no-stress” control
PM sample. Periods like the two movie nights, where the
students just sat with friends for a couple of hours and
did n o t h i n g , probably occur very rarely for many
students.
These two examples bring up an important point
about the experiments designed by students. For our
first time using this module, we discouraged students
from utilizing relaxation manipulations in order
to observe
an experimental difference in baseline cortisol values.
Our thinking was that PM no-stress cortisol levels would
be low enough that a floor effect would obscure any
effect of relaxation. The expected circadian cortisol
rhythm, however, is not as clear-cut in the college
student population where baseline cortisol levels may
often be elevated. As a result, we now are more open
to including relaxation manipulations in addition to
stressor manipulations in the laboratory module, where
appropriate “relaxation control” conditions are not as
important.
As a final example (and one which illustrates a
true stressor effect) one group (data not shown) had the
intent of showing that cortisol levels would be higher on
a day where they were taking an examination than on a
normal school day where there was no exam given. The
results showed no difference in cortisol levels between
the exam day and the non-exam school day, but did
show that samples taken during either time were higher
than their PM baseline sample, which were taken while
not at school. This group’s observation mirrors the effect
observed in our small N professor pilot study (Table 3);
Did anyone think school was not a stressor?
We feel that the combination of experimental
failures (all students think that they have a slam dunk of
a hypothesis) and “unexpected” significant effects
provides a very good education. It gives the students a
glimpse, perhaps their first, of what “real research” often
produces. And it makes them think--which is really the
goal.
Following the first use of this module in a
Behavioral Neuroscience course, several students
approached us about the desire to do an independent
study project examining the effects of some variable on
salivary cortisol. Since that time we have supervised two
honors thesis projects, one in which spirituality and
religiousness was examined as a modulator of the stress
response, and the other examining the effect of yoga
training on basal and exercise-induced cortisol levels. In
fact, some students have moved beyond cortisol,
collecting salivary samples for testosterone and
dihydroepiandrosterone (DHEA) utilizing kits similar to the
cortisol kit used in the above studies. For obvious
reasons, this is an attractive paradigm for students.
Also, in the case where a small department may employ
a single neuroscience professor who utilizes animal
models exclusively, measurement of salivary cortisol (or
other hormones) provides a simple alternative for a
student who wishes to perform an independent study or

The Journal of Undergraduate Neuroscience Education (JUNE), Spring 2004, 2(2):A41-A49. A49
honors research project, but does not desire to work with
non-human subjects.
Another impact of using this module has been to
generate discussion about the type of stress associated
with being in college. We and some of the students are
considering what we might do to better understand
stress in our school environment. Thus, we have found
the salivary cortisol module to be a wonderful learning
experience—for us as well as for our students.
REFERENCES
Kirschbaum C, Hellhammer, DH (1994) Salivary cortisol in
psychoneuroendocrine research: Recent developments and
applications. Psychoneuroendo 19:313-333.
Kirschbaum C, Hellhammer, DH (1989) Salivary cortisol in
p s y c h o b i o l o g i c a l
r e s e a r c h :
a n
overview.
Neuropsychobiology 22:150-169.
Holsboer F (2000) The corticosteroid receptor hypothesis of
depression. Neuropsychopharm 23:477-501.
Holsboer F, Barden N (1996) Antidepressants and hypothalamic
– pituitary - adrenocortical regulation. Endocr Rev 2:187-
205.
Miller DB, O’Callahaghan JP (2002) Neuroendocrine aspects of
the response to stress. Metabolism 51 (Suppl 1):5-10.
Kreig JC (1994) Laboratory tests in depression: Is it worth the
effort? J Psych Res 28:337-339.
Received March 14, 2003; revised April 14, 2004; accepted May 07, 2004
This work was supported by The Howard Hughes Medical Institute and The
Keck Foundation. The authors wish to thank members of PSY/ZOO
Behavioral Neuroscience courses taught in Spring 2002 and 2004 for their
enthusiasm and feedback regarding this module.
A free CD-ROM containing instructions, lecture notes, presentation materials,
and a data-handling spreadsheet is available. Please contact Marc Zimmer at
mzim@conncoll.edu to obtain the CD-ROM or view our website at
http://www.conncoll.edu/is/k-hhmi/k-hhmi-fellows.html.
Address correspondence to: Dr. Ruth E. Grahn, Box 5275, Connecticut
College, Department of Psychology, 270 Mohegan Avenue, New London, CT
06320. Email: regra@conncoll.edu
Copyright © 2004 Faculty for Undergraduate Neuroscience
www.funjournal.org
Wyszukiwarka
Podobne podstrony:
Kalman
kalman filtr
kalman opis
Least squares estimation from Gauss to Kalman H W Sorenson
Kalman
Kalman algorytm
kalman filter streszczenie
kalman filter prezentacja id 23 Nieznany
Filtr Kalmana, Filtr Kalmana
1990 Flux estimation by Kalman filter in inverter fed induction motors
sprawko kalman
Kalman
Segal kalman OPOWIADANIA Z ZABITEGO MIASTECZKA
Kalman Bajadera
Kalman duża sigmar
Kalmanr
Kalman mała sigmar
kalman robsa duza sigma
więcej podobnych podstron