
MATHL/PF/M09/N09/M10/N10
22 pages
For final assessment in 2009 and 2010
MATHEMATICS
Higher Level
The portfolio - tasks
For use in 2009 and 2010
© IBO 2008

– 2 –
MATHL/PF/M09/N09/M10/N10
For final assessment in 2009 and 2010
CONTENTS
Introduction
Type I tasks
INVESTIGATING DIVISIBILITY
INVESTIGATING RATIOS OF AREAS AND VOLUMES
THE SEGMENTS OF A POLYGON
PARABOLA INVESTIGATION
Type II tasks
DESIGNING A FREIGHT ELEVATOR
MODELLING THE HEIGHTS OF SAPLINGS
MODELLING PROBABILITIES IN GAMES OF TENNIS
MODELLING THE COURSE OF A VIRAL ILLNESS AND ITS TREATMENT
Criteria
Developing your own tasks
Old tasks

– 3 –
MATHL/PF/M09/N09/M10/N10
For final assessment in 2009 and 2010
Introduction
What is the purpose of this document
This document contains new tasks for the portfolio in mathematics HL. These tasks have been produced
by the IB, for teachers to use in 2009 and 2010. It should be noted that any tasks previously produced and
published by the IB will no longer be valid for assessment after November 2008. These include all the
tasks in any teacher support material (TSM). To assist teachers to identify these tasks, a list is included at
the end of this document.
What happens if teachers use these old tasks?
The inclusion of these old tasks in the portfolio will make the portfolio non-compliant, and such
portfolios will therefore attract a 10-mark penalty. Teachers may continue to use the old tasks as practice
tasks, but they should not be included in the portfolio for final assessment.
Why are these changes being made?
An interim version of the TSM for the current course was first published in 2004, with the full TSM
published in 2005. There were concerns that these documents were available for sale potentially giving
students access to the student work and its accompanying assessment. Teachers also expressed concerns
that model answers soon became easily available on the internet and felt that this made it difficult to
ensure students’ work was their own. There were also frequent requests for more tasks to be published by
the IB, as many teachers are apprehensive about producing their own tasks.
What other documents should I use?
All teachers should have copies of the mathematics HL subject guide (second edition, September 2006),
including the teaching notes appendix, and the TSM (September 2005). Further information, including
additional notes on applying the criteria, are available on the Online Curriculum Centre (OCC).
Important news items are also available on the OCC, as are the diploma programme coordinator notes,
which contain updated information on a variety of issues.
Can I use these tasks before May 2009?
These tasks should only be submitted for final assessment from May 2009 to November 2010. Students
should not include them in portfolios before May 2009. If they are included, they will be subject to a
10-mark penalty.

– 4 –
MATHL/PF/M09/N09/M10/N10
For final assessment in 2009 and 2010
Type I – mathematical investigation
While many teachers incorporate a problem-solving approach into their classroom practice, students also
should be given the opportunity formally to carry out investigative work. The mathematical investigation
is intended to highlight that:
•
the idea of investigation is fundamental to the study of mathematics
•
investigation work often leads to an appreciation of how mathematics can be applied to solve
problems in a broad range of fields
•
the discovery aspect of investigation work deepens understanding and provides intrinsic motivation
•
during the process of investigation, students acquire mathematical knowledge, problem-solving
techniques, a knowledge of fundamental concepts and an increase in self-confidence.
All investigations develop from an initial problem, the starting point. The problem must be clearly stated
and contain no ambiguity. In addition, the problem should:
•
provide a challenge and the opportunity for creativity
•
contain multi-solution paths, that is, contain the potential for students to choose different courses of
action from a range of options.
Essential skills to be assessed
•
Producing a strategy
•
Generating data
•
Recognizing patterns or structures
•
Searching for further cases
•
Forming a general statement
•
Testing a general statement
•
Justifying a general statement
•
Appropriate use of technology

– 5 –
MATHL/PF/M09/N09/M10/N10
For final assessment in 2009 and 2010
INVESTIGATING DIVISIBILITY
HL TYPE I
Background
In order to satisfactorily complete this assignment, the following areas of the core curriculum should have
been covered:
Factorization of polynomials
Mathematical induction
Pascal’s triangle
Binomial theorem and notation
n
r
1.
Factorize the expression
( )
x
P n
n
n
for
{2, 3, 4, 5}
x
. Determine if the expression is always
divisible by the corresponding x. If divisible use mathematical induction to prove your results by
showing whether
(
1)
( )
P k
P k
is always divisible by x. Using appropriate technology, explore
more cases, summarize your results and make a conjecture for when
x
n
n
is divisible by x.
2.
Explain how to obtain the entries in Pascal’s Triangle, and using appropriate technology, generate
the first 15 rows. State the relationship between the expression
(
1)
( )
P k
P k
and Pascal’s
Triangle. Reconsider your conjecture and revise if necessary.
Write an expression for the x
th
row of Pascal’s Triangle. You will have noticed that
,
x
k k
r
. Determine when k is a multiple of x.
3.
Make conclusions regarding the last result in part 2 and the form of proof by induction used in this
assignment. Refine your conjecture if necessary, and prove it.
4.
State the converse of your conjecture. Describe how you would prove whether or not the converse
holds.
– 6 –
MATHL/PF/M09/N09/M10/N10
For final assessment in 2009 and 2010
INVESTIGATING RATIOS OF AREAS AND VOLUMES
HL TYPE I
Background
The following areas of the core curriculum should have been covered in order to successfully complete
this assignment:
area under a curve
volumes of revolution
integration using the power rule
functions of the form
,
and
n
y
x
n
n
.
Introduction
In this portfolio assignment you will investigate the ratio of the areas formed when
n
y
x
is graphed
between two arbitrary parameters
x
a
and x
b such that a
b .
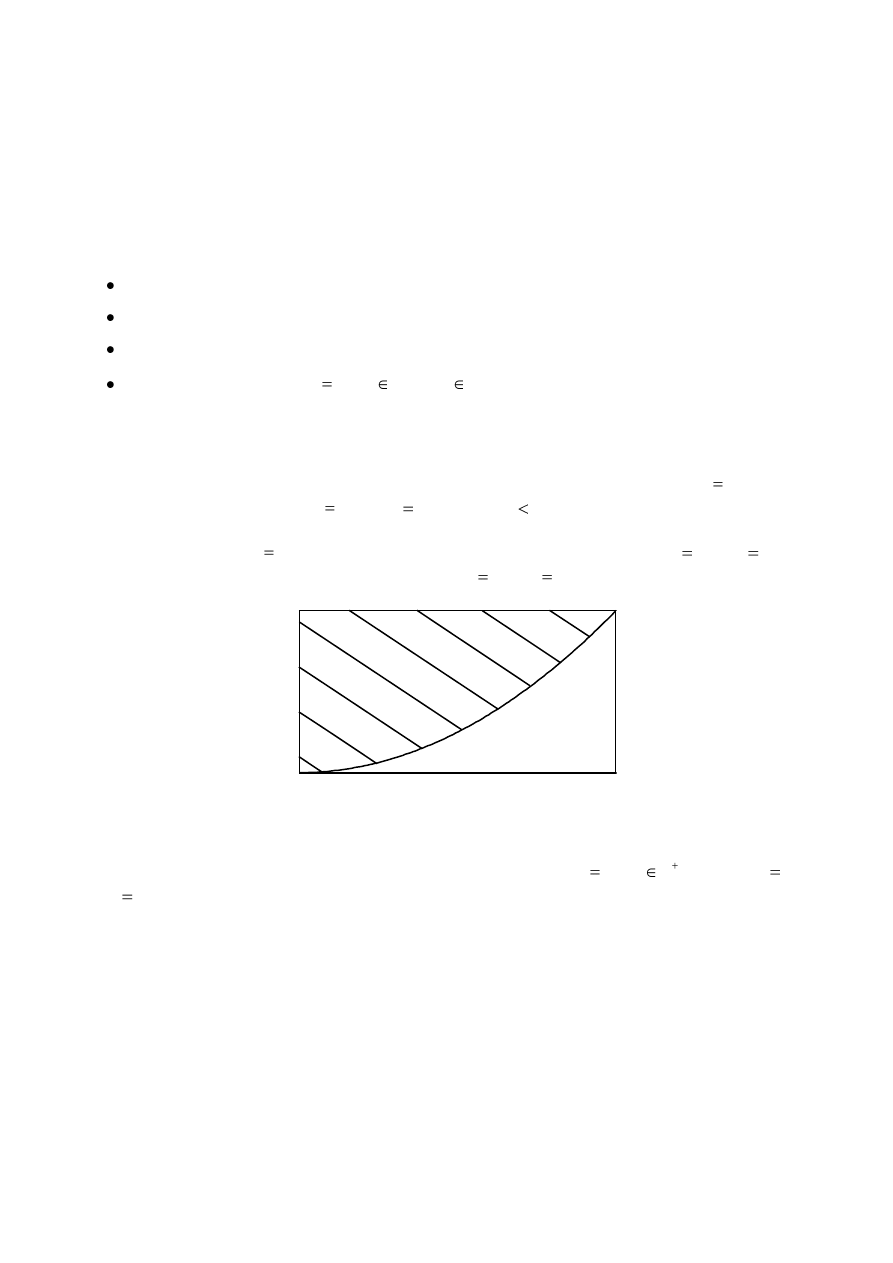
1.
Given the function
2
y
x
, consider the region formed by this function from
0
x
to
1
x
and the
x-axis. Label this area B. Label the region from
0
y
to
1
y
and the y-axis area A.
A
B
Find the ratio of area A: area B.
Calculate the ratio of the areas for other functions of the type
,
n
y
x
n
between
0
x
and
1
x
. Make a conjecture and test your conjecture for other subsets of the real numbers.
(This task continues on the following page)
– 7 –
MATHL/PF/M09/N09/M10/N10
For final assessment in 2009 and 2010
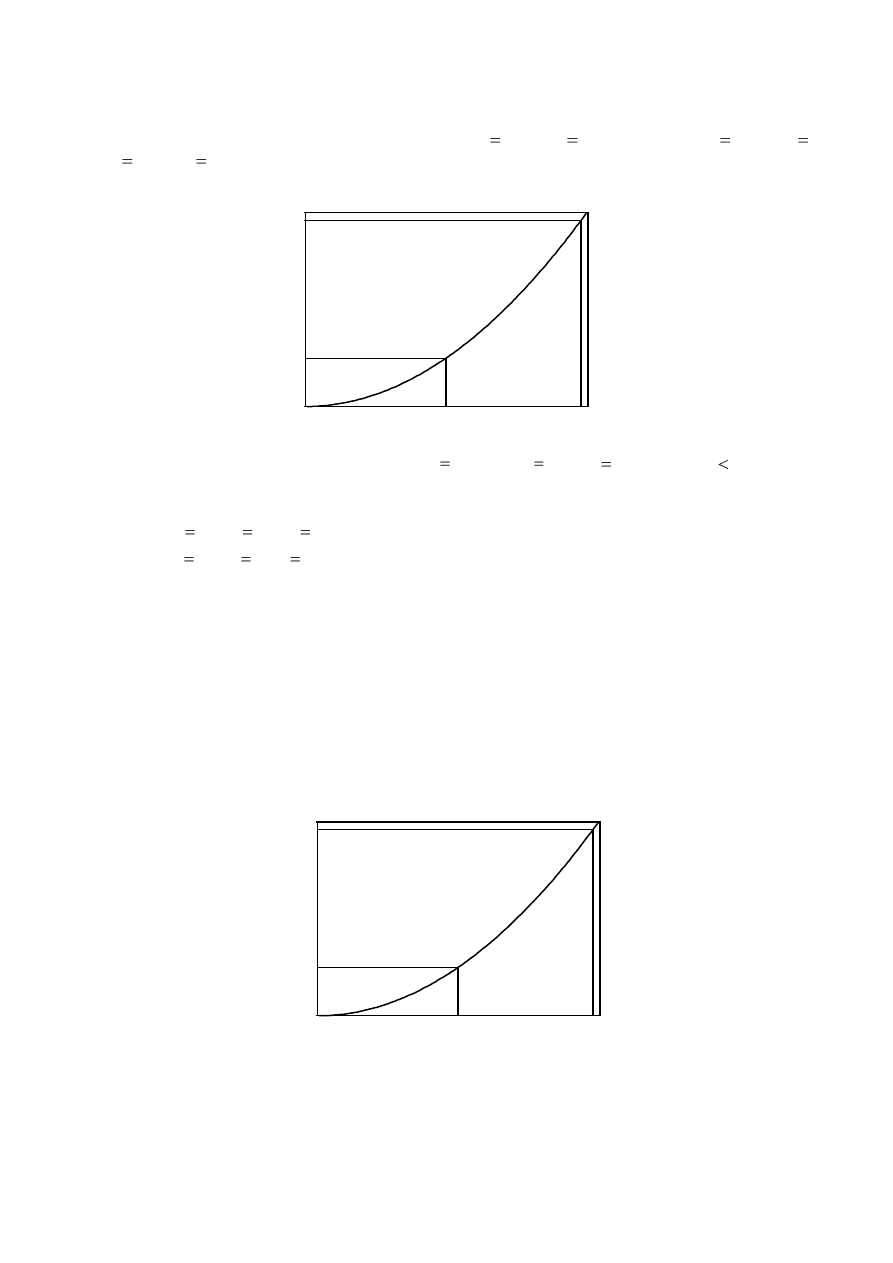
2.
Does your conjecture hold only for areas between
0
x
and
1
x
? Examine for
0
x
and
2
x
,
1
x
and
2
x
, etc. (See diagram)
A
B
3.
Is your conjecture true for the general case
n
y
x
from
x
a
to x
b such that a
b and for the
regions defined below? If so prove it; if not explain why not.
Area A:
,
,
n
n
n
y
x
y
a
y
b
and the y-axis
Area B:
,
,
n
y
x
x
a x
b
and the x-axis
4.
Are there general formulae for the ratios of the volumes of revolution generated by the regions A
and B when they are each rotated about
(a)
the x-axis?
(b)
the y-axis?
State and prove your conjecture.
A
B
b
n
a
n
a
b
– 8 –
MATHL/PF/M09/N09/M10/N10
For final assessment in 2009 and 2010
THE SEGMENTS OF A POLYGON
HL TYPE I
To undertake this task, the student should use a geometry tool such as Geometer’s Sketchpad, Autograph,
Cabri Jr or TI-Nspire.
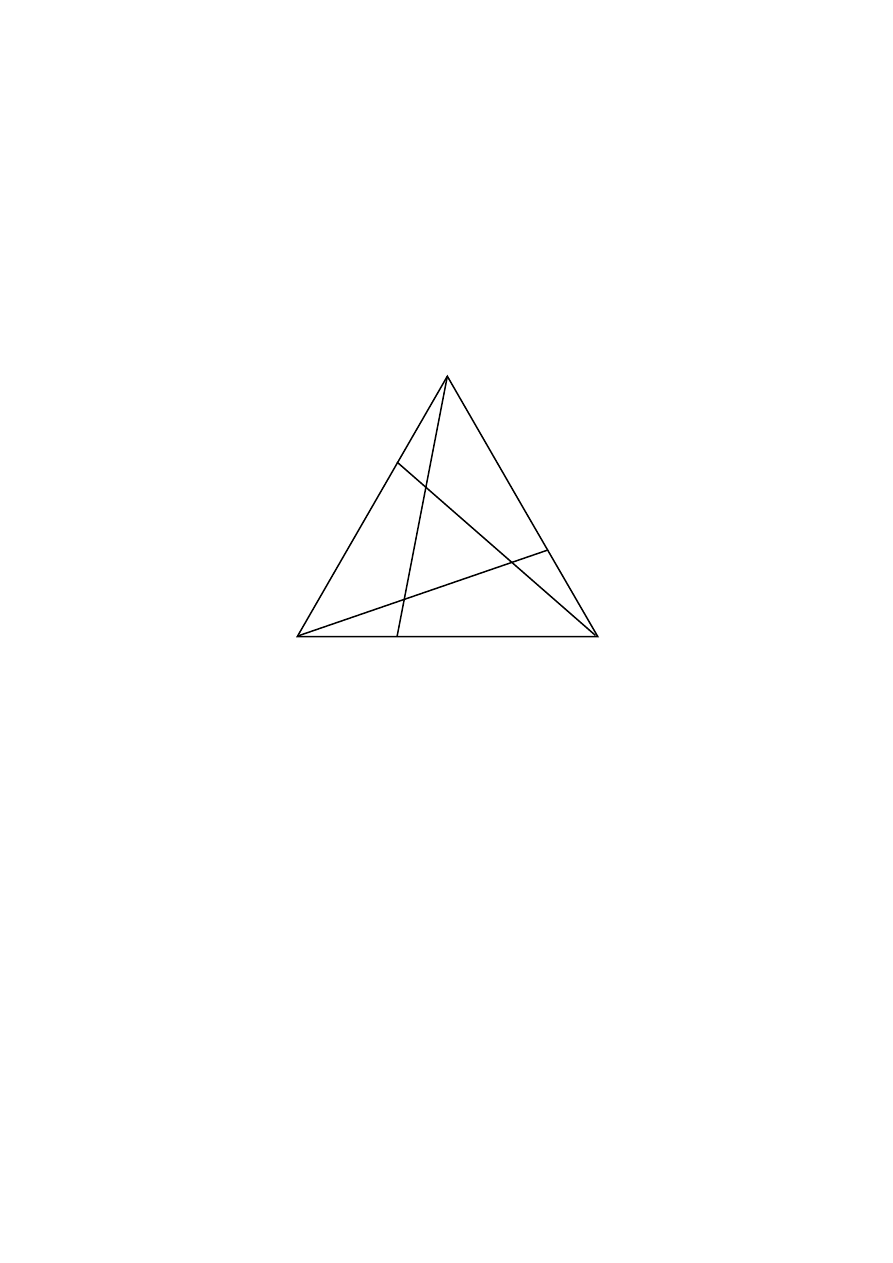
1.
In an equilateral triangle ABC, a line segment is drawn from each vertex to a point on the opposite
side so that the segment divides the side in the ratio 1:2, creating another equilateral triangle DEF
(see below).
A
E
D
F
B
C
(a)
What is the ratio of the areas of the two equilateral triangles? To answer this question,
(i)
create the above diagram with your geometry package.
(ii)
measure the lengths of the sides of the two equilateral triangles.
(iii) find the areas of the two equilateral triangles and the ratio between them.
(b)
Repeat the procedure above for at least two other side ratios, 1:n.
(c)
By analyzing the results above, conjecture a relationship between the ratios of the sides and
the ratio of the areas of the triangles.
(d)
Prove this conjecture analytically.
2.
Does this conjecture hold for non-equilateral triangles? Explain.
(This task continues on the following page)

– 9 –
MATHL/PF/M09/N09/M10/N10
For final assessment in 2009 and 2010
3.
(a)
Do a similar construction in a square where each side is divided into the ratio of 1:2.
Compare the area of the inner square to the area of the original square.
(b)
How do the areas compare if each side is divided in the ratio 1:n? Record your observations,
describe any patterns noted, and formulate a conjecture.
(c)
Prove the conjecture.
4.
If segments were constructed in a similar manner in other regular polygons (e.g. pentagons,
hexagons, etc.), would a similar relationship exist? Investigate the relationship in another regular
polygon.
– 10 –
MATHL/PF/M09/N09/M10/N10
For final assessment in 2009 and 2010
PARABOLA INVESTIGATION
HL TYPE I
Description
In this task, you will investigate the patterns in the intersections of parabolas and the lines y
x and
2
y
x
. Then you will be asked to prove your conjectures and to broaden the scope of the investigation
to include other lines and other types of polynomials.
Method
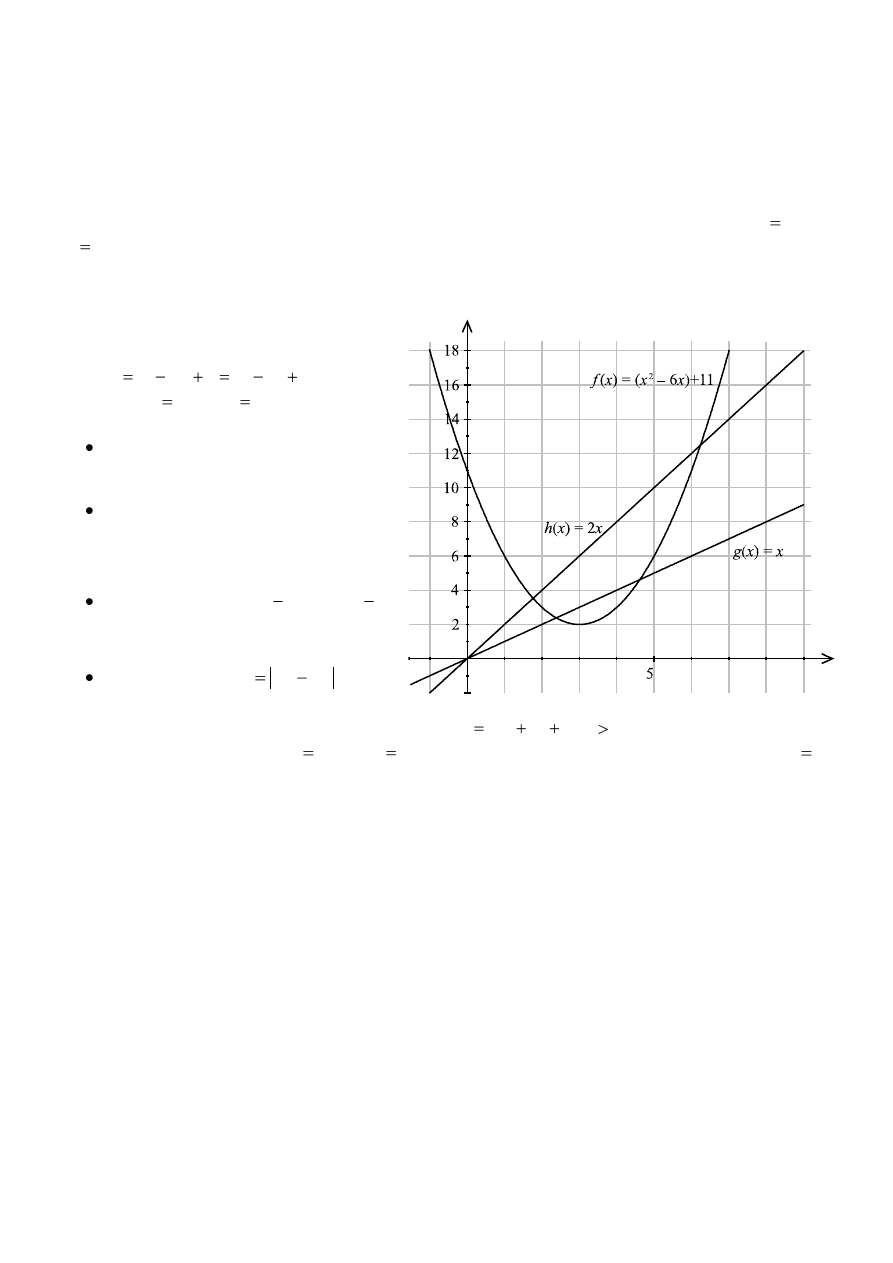
1.
Consider the parabola
2
2
(
3)
2
6
11
y
x
x
x
and the
lines y
x and
2
y
x
.
Using technology find the four
intersections illustrated on the right.
Label the x-values of these intersections
as they appear from left to right on the
x-axis as
1
2
3
4
, ,
, and
x
x
x
x
.
Find the values of
2
1
x
x
and
4
3
x
x
and name them respectively
and
L
R
S
S
.
Finally, calculate
L
R
D
S
S
.
2.
Find values of D for other parabolas of the form
2
y
ax
bx
c
,
0
a
, with vertices in quadrant 1,
intersected by the lines y
x and
2
y
x
. Consider various values of a, beginning with
1
a
.
Make a conjecture about the value of D for these parabolas.
3.
Investigate your conjecture for any real value of a and any placement of the vertex. Refine your
conjecture as necessary, and prove it. Maintain the labeling convention used in parts 1 and 2 by
having the intersections of the first line to be
2
x
and
3
x
and the intersections with the second line to
be
1
x
and
4
x
.
4.
Does your conjecture hold if the intersecting lines are changed? Modify your conjecture, if
necessary, and prove it.
5.
Determine whether a similar conjecture can be made for cubic polynomials.
6.
Consider whether the conjecture might be modified to include higher order polynomials.

– 11 –
MATHL/PF/M09/N09/M10/N10
For final assessment in 2009 and 2010
Type II – mathematical modelling
Problem solving usually elicits a process-oriented approach, whereas mathematical modelling requires an
experimental approach. By considering different alternatives, students can use modelling to arrive at a
specific conclusion, from which the problem can be solved. To focus on the actual process of modelling,
the assessment should concentrate on the appropriateness of the model selected in relation to the given
situation, and on a critical interpretation of the results of the model in the real-world situation chosen.
Mathematical modelling involves the following skills.
•
Translating the real-world problem into mathematics
•
Constructing a model
•
Solving the problem
•
Interpreting the solution in the real-world situation (that is, by the modification or amplification of
the problem)
•
Recognizing that different models may be used to solve the same problem
•
Comparing different models
•
Identifying ranges of validity of the models
•
Identifying the possible limits of technology
•
Manipulating data
Essential skills to be assessed
•
Identifying the problem variables
•
Constructing relationships between these variables
•
Manipulating data relevant to the problem
•
Estimating the values of parameters within the model that cannot be measured or calculated from
the data
•
Evaluating the usefulness of the model
•
Communicating the entire process
•
Appropriate use of technology

– 12 –
MATHL/PF/M09/N09/M10/N10
For final assessment in 2009 and 2010
DESIGNING A FREIGHT ELEVATOR
HL TYPE II
In this activity, you will first explore a possible model for the motion of a heavy-duty freight elevator
used to raise and lower equipment and minerals in a mineshaft. You will evaluate the model for its
strengths and weaknesses and then create a set of specifications to develop a model of your own.
Analyzing a possible model
The formula
3
2
2.5
15
y
t
t
represents the position of the elevator, y, measured in meters (
0
y
represents ground level) and t represents time measured in minutes (
0
t
is the starting time). We know
that the trip up and down the shaft, ignoring time spent at the foot of the shaft, is approximately six
minutes and that the depth of the shaft is no more than 100 metres.
Use suitable computer software, or your calculator in parametric mode, to visualize the motion of the
elevator in the shaft. Create a table of values for the position of the elevator for
0, 1, 2, 3, 4, 5, 6
t
minutes.
If using your calculator in parametric mode, you may want to view the motion along the line
1
x
.
Changing the increment value of x may be helpful. Continuing in parametric or changing to function
mode, enter the displacement, velocity and acceleration functions.
1.
Use these functions to:
(a)
interpret the original vertical line motion simulation,
(b)
explain the meaning of the negative, positive and zero values of the velocity graph,
(c)
explain the relationship between velocity and acceleration in the intervals when the elevator
speeds up, slows down, and is at rest,
(d)
evaluate the usefulness and identify the problems of the model in the given situation.
Creating your own model
2.
List specifications for a redesign of the freight elevator model.
3.
Hence, create a model of your own. You may use a single function or you may combine functions
in a piecewise function. In using piecewise functions, make sure that the joining points (except
perhaps at the bottom of the shaft) are smoothly connected. Interpret what this means
mathematically.
4.
Explain how your model addresses the problems of the given model and satisfies the specifications
of a well-functioning elevator for the mining company.
Applying your model
Explain how your model may be modified to be useful in other situations.

– 13 –
MATHL/PF/M09/N09/M10/N10
For final assessment in 2009 and 2010
MODELLING THE HEIGHTS OF SAPLINGS
HL TYPE II
Description
The following data come from a random sample of 1000 saplings collected
from a representative 0.25 km
2
area in a forest. Your job is to find a way to
use this random sample to develop a probability density function (pdf) to
model the population of all such saplings in the area in which the sample
was taken.
Checking available models
1.
Find a graphical way to show the data.
2.
Add two other columns to the chart, entering the expected frequencies
for the 1000 saplings for both a normal and Poisson distribution.
Test each as a possible model for the data.
3.
Could either of these be developed as a probability density function
for the data? Explain.
Creating your own model
4.
List the requirements for a probability density function.
5.
A useful method for finding a pdf for a given data set is to begin with a function that best describes
the data’s associated cumulative relative frequency curve. What traits must this function possess in
order to be defined as a cumulative density function (cdf) for the pdf you are creating?
6.
Find a suitable function for this cdf, check it to see if it has the necessary traits, and refine it if
necessary.
7.
What is the relationship between your cdf and the required pdf ? Explain. Find the pdf for this cdf
and evaluate it. If it does not satisfy all conditions, might it still be acceptable?
8.
Continue the search for a good cdf and pdf. Explain why your final result is the best and indicate its
limitations.
Applying your model
9.
If you were asked to develop a pdf for a different forest region, comment on the applicability of the
current model.
Heights (m) Frequency
0.00–0.25
61
0.25–0.50
160
0.50–0.75
209
0.75–1.00
202
1.00–1.25
158
1.25–1.50
105
1.50–1.75
58
1.75–2.00
29
2.00–2.25
12
2.25–2.50
4
2.50–2.75
1
2.75–3.00
1

– 14 –
MATHL/PF/M09/N09/M10/N10
For final assessment in 2009 and 2010
MODELLING PROBABILITIES IN GAMES OF TENNIS
HL TYPE II
Description
The purpose of this task is to analyze the relationship between certain probability distributions and the
process of match play in tennis. We will construct a probability model first for two players of predictable
abilities. We will also investigate two models of resolving ties.
Method
Part 1: Club practice.
1.
Suppose two players have played against each other often enough to know that Adam wins about
twice as many points as Ben does. The two decide to play 10 points of practice at their club.
(a)
What would be an appropriate model for the distribution of X , the number of points won by
Adam? Do you have any concerns about its validity? Are there limitations to its value?
(b)
Suppose a point that Adam wins is designated as A and one that Ben wins as B. Using the
distribution you have chosen, calculate all possible values of the random variable X , the
number of points won by Adam, and draw a histogram from your chart. Document any
technology that you are using to help with the calculations and/or graphing.
(c)
Find the expected value and standard deviation of this distribution. In this context, what can
you say about what usually happens in these 10-point practices?
Part 2: Non-extended play games.
2.
When Adam and Ben play against each other in club events, their probabilities of winning points
are approximately the same as above. In club play, the tennis rules are generally followed (win
with at least four points and by at least two points in each game), but to save court time, no game is
allowed to go beyond 7 points. This means that if deuce is called (each player has 3 points), the
next point determines the winner. Show that there are 70 possible ways that such a game might be
played. To assist with this let Y be the number of points played. What values can Y take? For
each possible value of Y find the number of possible ways that such a game could be played, and
show the probability model for such a game. Be sure to define a random variable for the
distribution.
3.
Using the model you developed in 2, what is the probability that Adam wins the game? What are
the odds that he wins?
4.
Generalise this to find the probability that Player C wins in terms of c and d, where c represents the
probability that Player C wins a point and d represents the probability that Player D wins a point.
(This task continues on the following page)

– 15 –
MATHL/PF/M09/N09/M10/N10
For final assessment in 2009 and 2010
Part 3: Extended play games.
5.
When Adam and Ben play against each other in tournaments outside the club, their point-winning
probabilities remain the same (2/3 and 1/3, respectively), but the rules now require that players win
by 2 points and therefore, that games may in theory be infinitely long.
Show that although Adam’s point odds against Ben are 2:1, his game odds are almost 6:1. Be sure
to consider separately the cases of non-deuce and deuce games.
6.
Suppose that, more generally, Player C’s probability of winning a point is c and Player D’s
probability of winning a point is d. Write formulas in terms of c and d for these probabilities:
probability that Player C wins without deuce being called, probability that deuce is called, and
probability that Player C wins given that deuce is called. Using these formulas to aid calculation,
find the odds that Player C wins for
0.5, 0.55, 0.6, 0.7, 0.9
c
and any other values you would
like to test. A spreadsheet approach is encouraged.
7.
What expression represents the odds in such situations? What happens when the winning
probabilities are close together or when one player is almost certain to win each point?
8.
Evaluate the usefulness and limitations of such probability models.

– 16 –
MATHL/PF/M09/N09/M10/N10
For final assessment in 2009 and 2010
MODELLING THE COURSE OF A VIRAL ILLNESS AND ITS TREATMENT
HL TYPE II
Description
When viral particles of a certain virus enter the human body, they replicate rapidly. In about four hours,
the number of viral particles has doubled. The immune system does not respond until there are about
1 million viral particles in the body.
The first response of the immune system is fever. The rise in temperature lowers the rate at which the
viral particles replicate to 160 % every four hours, but the immune system can only eliminate these
particular viral particles at the rate of about 50 000 viral particles per hour. Often people do not seek
medical attention immediately as they think they have a common cold. If the number of viral particles,
however, reaches 10
12
, the person dies.
Modelling infection
1.
Model the initial phase of the illness for a person infected with 10 000 viral particles to determine
how long it will take for the body’s immune response to begin.
2.
Using a spreadsheet, or otherwise, develop a model for the next phase of the illness, when the
immune response has begun but no medications have yet been administered. Use the model to
determine how long it will be before the patient dies if the infection is left untreated.
Modelling recovery
An antiviral medication can be administered as soon as a person seeks medical attention. The medication
does not affect the growth rate of the viruses but together with the immune response can eliminate 1.2
million viral particles per hour.
3.
If the person is to make a full recovery, explain why effective medication must be administered
before the number of viral particles reaches 9 to 10 million.
The antiviral medication is difficult for the body to adapt to, so it must initially be carefully introduced to
the body over a four-hour time period of continuous intravenous dosing. This means the same amount of
medication is entering the body at any given time during the first 4 hours. At the same time, however, the
kidneys eliminate about 2.5 % of this medication per hour. The doctor has calculated that the patient
needs at least 90 micrograms of medication to begin and maintain the rate of elimination of 1.2 million
viral particles.
4.
Create a mathematical model for this four-hour period so that by the end of the four hour period the
patient has 90 micrograms of medication in their body. Find the solution to your model
analytically, or estimate its solution with the help of technology.
Once the level of medication has reached 90 micrograms the patient is taken off the intravenous phase
and given injections every four hours. The kidneys will still be working to eliminate the medication, so
the doctor must calculate the additional dosage, D accordingly. Dosage D should allow for maintenance
of a minimum of 90 micrograms within the patient’s bloodstream throughout the treatment regimen.
(This task continues on the following page)

– 17 –
MATHL/PF/M09/N09/M10/N10
For final assessment in 2009 and 2010
5.
What dosage, D, administered every four hours from the end of the first continual intravenous
phase, would allow for the patient to maintain at least 90 micrograms of the medication in his
system? Make sure you take into account the kidneys’ rate of elimination. Explain carefully how
you came to this number.
6.
Determine the last possible time from the onset of infection to start the regimen of medication.
How long it will take to clear the viral particles from the patient’s system? Show on a graph the
entire treatment regimen from the time treatment begins until the viral particles are eliminated.
Analyzing your models
Analyze all your models discussing any assumptions you have made, the strengths and weaknesses of the
models, and the reliability of your results.
Applying your model
7.
Explain how your models could be modified for use if the patient were not an adult, but a young
child.

– 18 –
MATHL/PF/M09/N09/M10/N10
For final assessment in 2009 and 2010
Overview of assessment criteria for type I tasks
C
ri
te
ri
o
n
F:
Qu
a
li
ty
o
f
w
o
rk
Th
e
st
u
d
en
t
h
as
sh
o
w
n
a
p
o
o
r
q
u
al
it
y
o
f
w
o
rk
.
Th
e
st
u
d
en
t
h
as
sh
o
w
n
a
sa
ti
sf
a
ct
o
ry
q
u
al
it
y
o
f
w
o
rk
.
Th
e
st
u
d
en
t
h
as
sh
o
w
n
a
n
o
u
tst
a
n
d
in
g
q
u
al
it
y
o
f
w
o
rk
.
C
ri
te
ri
o
n
E
:
U
se
o
f
te
ch
n
o
lo
g
y
Th
e
st
u
d
en
t
u
se
s a
c
al
cu
la
to
r
o
r
co
m
p
u
te
r
fo
r
o
n
ly
r
o
u
ti
n
e
ca
lc
u
la
ti
o
n
s.
Th
e
st
u
d
en
t
a
tt
empt
s
to
u
se
a
ca
lc
u
la
to
r
o
r
co
m
p
u
te
r
in
a
man
n
er
t
h
at
c
o
u
ld
e
n
h
an
ce
th
e
d
ev
el
o
p
me
n
t
o
f
th
e
ta
sk
.
Th
e
st
u
d
en
t
ma
k
es
li
mi
te
d
u
se
o
f
a
ca
lc
u
la
to
r
o
r
co
m
p
u
te
r
in
a
ma
n
n
er
t
h
at
en
h
an
ce
s t
h
e
d
ev
el
o
p
me
n
t
o
f
th
e
ta
sk
.
Th
e
st
u
d
en
t
ma
k
es
fu
ll
a
n
d
re
so
u
rc
ef
u
l
u
se
o
f
a
ca
lc
u
la
to
r
o
r
co
mp
u
te
r
in
a
man
n
er
t
h
at
si
g
n
if
ic
a
n
tl
y
en
h
an
ce
s t
h
e
d
ev
el
o
p
me
n
t
o
f
th
e
ta
sk
.
C
ri
te
ri
o
n
D
:
R
esu
lt
s—
g
en
er
a
li
za
ti
o
n
Th
e
st
u
d
en
t
d
o
es
n
o
t
p
ro
d
u
ce
a
n
y
g
en
er
al
st
at
eme
n
t
co
n
si
st
en
t
w
it
h
t
h
e
p
at
te
rn
s
an
d
/o
r
st
ru
ct
u
re
s
g
en
er
at
ed
.
Th
e
st
u
d
en
t
a
tt
empt
s
to
p
ro
d
u
ce
a
g
en
er
al
st
at
em
en
t
th
at
i
s
co
n
si
st
en
t
w
it
h
t
h
e
p
at
te
rn
s
an
d
/o
r
st
ru
ct
u
re
s
g
en
er
at
ed
.
Th
e
st
u
d
en
t
co
rr
ec
tl
y
p
ro
d
u
ce
s
a
g
en
er
al
st
at
eme
n
t
th
at
i
s
co
n
si
st
en
t
w
it
h
t
h
e
p
at
te
rn
s
an
d
/o
r
st
ru
ct
u
re
s
g
en
er
at
ed
.
Th
e
st
u
d
en
t
ex
p
re
ss
es
th
e
co
rr
ec
t
g
en
er
al
s
ta
te
me
n
t
in
a
p
p
ro
p
ri
a
te
m
a
th
em
a
ti
ca
l
te
rm
in
o
lo
g
y
.
Th
e
st
u
d
en
t
co
rr
ec
tl
y
st
a
te
s
th
e
sc
o
p
e
o
r
li
m
it
at
io
n
s
o
f
th
e
g
en
er
al
s
ta
te
me
n
t.
Th
e
st
u
d
en
t
g
iv
es a
c
o
rr
ec
t,
fo
rmal
p
ro
o
f
o
f
th
e
g
en
er
al
st
at
eme
n
t.
C
ri
te
ri
o
n
C
:
M
a
th
em
a
ti
ca
l
p
ro
ce
ss
—
sea
rc
h
in
g
f
o
r
p
a
tt
er
n
s
Th
e
st
u
d
en
t
d
o
es
n
o
t
a
tt
empt
t
o
u
se
a
mat
h
em
at
ic
al
s
tr
at
eg
y
.
Th
e
st
u
d
en
t
u
se
s
a
mat
h
em
at
ic
al
s
tr
at
eg
y
t
o
p
ro
d
u
ce
d
at
a.
Th
e
st
u
d
en
t
o
rg
a
n
iz
es
th
e
d
at
a
g
en
er
at
e
d.
Th
e
st
u
d
en
t
a
tt
empt
s to
a
n
a
ly
se
d
at
a
to
e
n
ab
le
t
h
e
fo
rmu
la
ti
o
n
o
f
a
g
en
er
al
st
at
eme
n
t.
Th
e
st
u
d
en
t
su
cc
essf
u
ll
y
a
n
a
ly
se
s
th
e
co
rr
ec
t
d
at
a
to
en
ab
le
t
h
e
fo
rmu
la
ti
o
n
o
f
a
g
en
er
al
s
ta
te
m
en
t.
Th
e
st
u
d
en
t
te
st
s
th
e
v
al
id
it
y
o
f
th
e
g
en
er
al
st
at
eme
n
t
b
y
co
n
si
d
er
in
g
f
u
rt
h
er
ex
amp
le
s.
C
ri
te
ri
o
n
B
:
C
o
mm
u
n
ic
a
ti
o
n
Th
e
st
u
d
en
t
n
ei
th
er
p
ro
v
id
es
ex
p
la
n
at
io
n
s
n
o
r
u
ses
a
p
p
ro
p
ri
at
e
fo
rms o
f
re
p
re
se
n
ta
ti
o
n
(
fo
r
ex
am
p
le
,
sy
m
b
o
ls,
ta
b
le
s,
g
ra
p
h
s
an
d
/o
r
d
ia
g
ra
ms)
.
Th
e
st
u
d
en
t
a
tt
empt
s
to
p
ro
v
id
e
ex
p
la
n
at
io
n
s
o
r
u
ses
so
me
a
p
p
ro
p
ri
at
e
fo
rms o
f
re
p
re
se
n
ta
ti
o
n
(
fo
r
ex
am
p
le
,
sy
m
b
o
ls,
ta
b
le
s,
g
ra
p
h
s
an
d
/o
r
d
ia
g
ra
ms)
.
Th
e
st
u
d
en
t
p
ro
v
id
es
a
d
eq
u
a
te
ex
p
la
n
at
io
n
s
o
r
ar
g
u
me
n
ts
,
an
d
co
mm
u
n
ic
at
es
th
em
u
si
n
g
a
p
p
ro
p
ri
at
e
fo
rms o
f
re
p
re
se
n
ta
ti
o
n
(
fo
r
ex
am
p
le
,
sy
m
b
o
ls,
ta
b
le
s,
g
ra
p
h
s
an
d
/o
r
d
ia
g
ra
ms)
.
Th
e
st
u
d
en
t
p
ro
v
id
es
co
mpl
et
e,
co
h
er
en
t
ex
p
la
n
at
io
n
s
o
r
ar
g
u
m
en
ts,
an
d
c
o
mm
u
n
ic
at
es
th
em
cl
ea
rl
y
u
si
n
g
ap
p
ro
p
ri
at
e
fo
rms
o
f
re
p
re
se
n
ta
ti
o
n
(f
o
r
ex
am
p
le
,
sy
m
b
o
ls,
t
ab
le
s,
g
ra
p
h
s
an
d
/o
r
d
ia
g
ra
ms)
.
C
ri
te
ri
o
n
A
:
U
se
o
f
n
o
ta
ti
o
n
a
n
d
t
er
mi
n
o
lo
g
y
Th
e
st
u
d
en
t
d
o
es
n
o
t
u
se
a
p
p
ro
p
ri
at
e
n
o
ta
ti
o
n
a
n
d
te
rmi
n
o
lo
g
y
.
Th
e
st
u
d
en
t
u
se
s
so
m
e
ap
p
ro
p
ri
at
e
n
o
ta
ti
o
n
a
n
d
/o
r
te
rmi
n
o
lo
g
y
.
Th
e
st
u
d
en
t
u
se
s
ap
p
ro
p
ri
at
e
n
o
ta
ti
o
n
an
d
t
er
mi
n
o
lo
g
y
i
n
a
co
n
si
st
en
t
man
n
er
a
n
d
d
o
es
so
th
ro
u
g
h
o
u
t
th
e
w
o
rk
.
0
1
2
3
4
5

– 19 –
MATHL/PF/M09/N09/M10/N10
For final assessment in 2009 and 2010
Overview of assessment criteria for type II tasks
C
ri
te
ri
o
n
F:
Qu
a
li
ty
o
f
w
o
rk
Th
e
st
u
d
en
t
h
as
sh
o
w
n
a
p
o
o
r
q
u
al
it
y
o
f
w
o
rk
.
Th
e
st
u
d
en
t
h
as
sh
o
w
n
a
sa
ti
sf
a
ct
o
ry
q
u
al
it
y
o
f
w
o
rk
.
Th
e
st
u
d
en
t
h
as
sh
o
w
n
a
n
o
u
tst
a
n
d
in
g
q
u
al
it
y
o
f
w
o
rk
.
C
ri
te
ri
o
n
E
:
U
se
o
f
te
ch
n
o
lo
g
y
Th
e
st
u
d
en
t
u
se
s a
ca
lc
u
la
to
r
o
r
co
mp
u
te
r
fo
r
o
n
ly
r
o
u
ti
n
e
ca
lc
u
la
ti
o
n
s.
Th
e
st
u
d
en
t
a
tt
empt
s
to
u
se
a
ca
lc
u
la
to
r
o
r
co
m
p
u
te
r
in
a
ma
n
n
er
t
h
at
co
u
ld
e
n
h
an
ce
t
h
e
d
ev
el
o
p
me
n
t
o
f
th
e
ta
sk
.
Th
e
st
u
d
en
t
ma
k
es
li
m
it
ed
u
se
o
f
a
ca
lc
u
la
to
r
o
r
co
m
p
u
te
r
in
a
ma
n
n
er
th
at
e
n
h
an
ce
s
th
e
d
ev
el
o
p
me
n
t
o
f
th
e
ta
sk
.
Th
e
st
u
d
en
t
ma
k
es
fu
ll
an
d
r
es
o
u
rc
ef
u
l
u
se
o
f
a
ca
lc
u
la
to
r
o
r
co
mp
u
te
r
in
a
ma
n
n
er
t
h
at
si
g
n
if
ic
a
n
tl
y
e
n
h
an
ce
s
th
e
d
ev
el
o
p
me
n
t
o
f
th
e
ta
sk
.
C
ri
te
ri
o
n
D
:
R
esu
lt
s—
in
te
rp
re
ta
ti
o
n
Th
e
st
u
d
en
t
h
a
s n
o
t
a
rr
iv
ed
a
t
an
y
re
su
lt
s.
Th
e
st
u
d
en
t
h
as a
rr
iv
ed
a
t
so
me
re
su
lt
s.
Th
e
st
u
d
en
t
h
a
s n
o
t
in
te
rp
re
te
d
t
h
e
re
aso
n
ab
le
n
ess
o
f
th
e
re
su
lt
s
o
f
th
e
mo
d
el
i
n
t
h
e
co
n
te
x
t
o
f
th
e
ta
sk
.
Th
e
st
u
d
en
t
h
as
a
tt
empt
ed
t
o
in
te
rp
re
t
th
e
re
as
o
n
ab
le
n
es
s
o
f
th
e
re
su
lt
s
o
f
th
e
m
o
d
el
i
n
t
h
e
co
n
te
x
t
o
f
th
e
ta
sk
,
to
t
h
e
ap
p
ro
p
ri
at
e
d
eg
re
e
o
f
ac
cu
ra
cy
.
Th
e
st
u
d
en
t
h
as
co
rr
ec
tl
y
i
n
te
rp
re
te
d
th
e
re
aso
n
ab
le
n
ess
o
f
th
e
re
su
lt
s
o
f
th
e
m
o
d
el
i
n
t
h
e
co
n
te
x
t
o
f
th
e
ta
sk
,
to
t
h
e
ap
p
ro
p
ri
at
e
d
eg
re
e
o
f
ac
cu
ra
cy
.
Th
e
st
u
d
en
t
h
as
co
rr
ec
tl
y
a
n
d
cr
it
ic
a
ll
y
i
n
te
rp
re
te
d
t
h
e
re
aso
n
ab
le
n
ess
o
f
th
e
re
su
lt
s
o
f
th
e
mo
d
el
i
n
t
h
e
co
n
te
x
t
o
f
th
e
ta
sk
,
in
cl
u
d
in
g
p
o
ssi
b
le
l
im
it
at
io
n
s
an
d
mo
d
if
ic
at
io
n
s
o
f
th
es
e
re
su
lt
s,
to
t
h
e
ap
p
ro
p
ri
at
e
d
eg
re
e
o
f
ac
cu
ra
cy
.
C
ri
te
ri
o
n
C
:
M
a
th
em
a
ti
ca
l
p
ro
ce
ss
—
d
ev
el
o
p
in
g
a
m
o
d
el
Th
e
st
u
d
en
t
d
o
es
n
o
t
d
ef
in
e
v
ar
ia
b
le
s,
p
ar
am
et
er
s
o
r
co
n
st
ra
in
ts
o
f
th
e
ta
sk
.
Th
e
st
u
d
en
t
d
ef
in
es
so
m
e
v
ar
ia
b
le
s,
p
ar
am
et
er
s
o
r
co
n
st
ra
in
ts
o
f
th
e
ta
sk
.
Th
e
st
u
d
en
t
d
ef
in
es
v
ar
ia
b
le
s,
p
ar
am
et
er
s
a
n
d
c
o
n
st
ra
in
ts
o
f
th
e
ta
sk
a
n
d
a
tt
emp
ts
to
c
re
at
e
a
mo
d
el
.
Th
e
st
u
d
en
t
co
rr
ec
tl
y
a
n
a
ly
ses
v
ar
ia
b
le
s,
p
ar
am
et
er
s a
n
d
co
n
st
ra
in
ts
o
f
th
e
ta
sk
t
o
e
n
ab
le
t
h
e
fo
rmu
la
ti
o
n
o
f
a
m
at
h
em
at
ic
al
mo
d
el
t
h
at
i
s
re
le
v
a
n
t
to
t
h
e
ta
sk
an
d
c
o
n
si
st
en
t
w
it
h
t
h
e
le
v
el
o
f
th
e
co
u
rse.
Th
e
st
u
d
en
t
co
n
si
d
er
s
h
o
w
w
el
l
th
e
m
o
d
el
f
it
s
th
e
d
at
a.
Th
e
st
u
d
en
t
a
p
p
li
es
t
h
e
mo
d
el
t
o
o
th
er
s
it
u
at
io
n
s.
C
ri
te
ri
o
n
B
:
C
o
mm
u
n
ic
a
ti
o
n
Th
e
st
u
d
en
t
n
ei
th
er
p
ro
v
id
es
ex
p
la
n
at
io
n
s
n
o
r
u
ses
ap
p
ro
p
ri
at
e
fo
rms
o
f
re
p
re
se
n
ta
ti
o
n
(
fo
r
ex
amp
le
,
sy
m
b
o
ls,
ta
b
le
s,
g
ra
p
h
s
an
d
/o
r
d
ia
g
ra
ms)
.
Th
e
st
u
d
en
t
a
tt
empt
s
to
p
ro
v
id
e
ex
p
la
n
at
io
n
s
o
r
u
ses
so
me
ap
p
ro
p
ri
at
e
fo
rms
o
f
re
p
re
se
n
ta
ti
o
n
(
fo
r
ex
amp
le
,
sy
m
b
o
ls,
ta
b
le
s,
g
ra
p
h
s
an
d
/o
r
d
ia
g
ra
ms)
.
Th
e
st
u
d
en
t
p
ro
v
id
es
a
d
eq
u
a
te
ex
p
la
n
at
io
n
s
o
r
ar
g
u
me
n
ts
,
an
d
co
mm
u
n
ic
at
es
th
em
u
si
n
g
ap
p
ro
p
ri
at
e
fo
rms
o
f
re
p
re
se
n
ta
ti
o
n
(
fo
r
ex
amp
le
,
sy
m
b
o
ls,
ta
b
le
s,
g
ra
p
h
s
an
d
/o
r
d
ia
g
ra
ms)
.
Th
e
st
u
d
en
t
p
ro
v
id
es
co
mpl
et
e,
co
h
er
en
t
ex
p
la
n
at
io
n
s
o
r
ar
g
u
me
n
ts
,
an
d
c
o
mm
u
n
ic
at
es
th
em c
le
ar
ly
u
si
n
g
a
p
p
ro
p
ri
at
e
fo
rms o
f
re
p
re
se
n
ta
ti
o
n
(
fo
r
ex
amp
le
,
sy
mb
o
ls,
ta
b
le
s,
g
ra
p
h
s
an
d
/o
r
d
ia
g
ra
ms)
.
C
ri
te
ri
o
n
A
:
U
se
o
f
n
o
ta
ti
o
n
a
n
d
te
rm
in
o
lo
g
y
Th
e
st
u
d
en
t
d
o
es
n
o
t
u
se
ap
p
ro
p
ri
at
e
n
o
ta
ti
o
n
a
n
d
te
rmi
n
o
lo
g
y
.
Th
e
st
u
d
en
t
u
se
s
so
m
e
ap
p
ro
p
ri
at
e
n
o
ta
ti
o
n
a
n
d
/o
r
te
rmi
n
o
lo
g
y
.
Th
e
st
u
d
en
t
u
se
s
ap
p
ro
p
ri
at
e
n
o
ta
ti
o
n
an
d
t
er
mi
n
o
lo
g
y
i
n
a
co
n
si
st
en
t
ma
n
n
er
an
d
d
o
es s
o
th
ro
u
g
h
o
u
t
th
e
w
o
rk
.
0
1
2
3
4
5

– 20 –
MATHL/PF/M09/N09/M10/N10
For final assessment in 2009 and 2010
Tasks developed by teachers
Introduction
As stated in the Mathematics HL guide (2008), portfolio tasks must be integrated into the course of study.
This course of study should be devised before the start of the course and suitable tasks identified that can
be incorporated into it to support the learning process. Students need to submit two pieces of work, but it
is a good idea for them to be allowed to complete more than two and choose the best ones.
When setting tasks, the background of the students and the purpose of each task should be considered, as
well as the types of technology available to students. The tasks should be:
presented to students at appropriate times, periodically over the two-year course
meaningful and relevant to the topic being studied at the time of the task
considered as part of normal classwork and homework, not as something extra.
It may be helpful to provide students with a timetable of tasks at an early stage to assist them in managing
their time. The following section deals with the cycle of development from possible starting points to the
writing of a task.
Starting points
The process of developing a task can start from a number of different points.
A task written by someone else
It will be necessary to work the task first to check suitability. Amendments will almost certainly be
needed for the task to be incorporated into a particular course of study. This includes the tasks in this
document.
A syllabus topic to be covered
Some syllabus topics are suited to particular types of task. For example, sequences and series invite
investigative work using a graphic display calculator (GDC), and exponential functions can be applied in
a modelling task.
Outside sources
A report in a newspaper or journal can often provide the starting point for a modelling task or an
investigation. Such a report provides an ideal opportunity to apply mathematics to real-life contexts.
These reports may not appear at appropriate times in the course, so starting points of this kind usually
require long-term planning.
Interesting points that arise in class discussion
Sometimes an interesting mathematics problem is exchanged among colleagues or arises from class
discussion. If it is relevant to the syllabus it could be developed into a portfolio task.

– 21 –
MATHL/PF/M09/N09/M10/N10
For final assessment in 2009 and 2010
Questions before starting
The following questions need to be considered before starting to develop a portfolio task.
What is the purpose of the task?
The purpose of each task should be clearly understood in terms of whether it is being used to introduce a
topic, reinforce mathematical meaning or take the place of a revision exercise.
What type should it be (type I or type II)?
It is important to make a decision about the type of task at an early stage and to make sure the task
addresses the particular requirements of that type.
What part of the syllabus does this assess?
Portfolio tasks must relate directly to the syllabus. Choosing topics outside the syllabus, or extending
work on topics beyond the intended level of study, will create extra work for the student and the teacher.
What knowledge and skills are involved?
Teachers should consider the prior knowledge and skills that are required in order for students to
complete the task successfully. Teachers should also consider the mathematical knowledge and skills
they wish the students to obtain, develop and review as they work through the task.
What follow-up work will be needed?
The extent of the follow-up work required will vary with the nature of the task and should be planned in
advance.
The cycle of development
In developing a portfolio task it will be necessary to work through a number of stages.
Stage 1
Draft the task, or select a task that has been written by someone else. The assessment criteria should be
consulted at this point.
Stage 2
Work the task yourself in full, as if you were a student.
Stage 3
Refer to the assessment criteria. Will the task provide an opportunity for students to gain the highest
achievement levels?
Stage 4
Consider whether the task has achieved its aims. Is it of an appropriate length? Is it at an appropriate
level? What will the students learn?
Stage 5
What flaws in the task have been exposed? How could the task be improved?
Stage 6
Redraft the task so that it will be ready to use with your students.
Stage 7
Present the task to your students, and then repeat stages 3 to 6.
– 22 –
MATHL/PF/M09/N09/M10/N10
For final assessment in 2009 and 2010
Titles of tasks taken from old teacher support materials.
These are the titles of tasks which appear in TSMs published for the old course. They should not be
included in portfolios after the November 2008 examination session. In the second edition of the TSM,
some tasks were not published in all three languages, so the titles for all three languages are included
here for reference.
TSM (Mathematics HL, first edition, November 1998)
Title
Título
Titre
Rotating rectangles
Giros de rectángulos
Rectangles en rotation
Estimation of
Estimación de
Estimation de
Finding zeros of functions
Hallar ceros de funciones
Trouver les zéros d’une fonction
Investigating a sequence of
numbers
Investigación de una sucesión
de números
Étude d’une suite de nombres
The rational zeros
Ceros racionales
Les racines rationnelles
The Newton-Raphson method
El método de Newton-Raphson
La méthode de Newton-Raphson
Lines and planes
Rectas y planos
Droites et plans
Absorbing shocks
Absorción de choques
Amortir les chocs
Transformations and their
matrices
Transformaciones y sus
matrices
Les transformations et leurs
matrices
Population growth
Crecimiento de la población
Croissance d’une population
Design of a ship’s propeller
blade
Diseño de la hoja de una hélice
de barco
Conception des pales de l’hélice
d’un navire
Some history and complex
numbers
Algo de historia y números
complejos
Approche historique des
nombres complexes
The use of i in solving
quadratic equations
Uso de i al resolver ecuaciones
cuadráticas
L’utilisation de i dans la
résolution d’équations du second
degré
TSM (Mathematics HL, second edition, November 2000)
Title
Título
Titre
Binomial coefficients
Volume of cones
Volúmenes de conos
Modelling sunrise
Un modelo para la salida del sol
Wyszukiwarka
Podobne podstrony:
Maths HL Specimen M 08
Maths HL Specimen M 08
2008 01 15 godz 09 HL
download Zarządzanie Produkcja Archiwum w 09 pomiar pracy [ www potrzebujegotowki pl ]
09 AIDSid 7746 ppt
09 Architektura systemow rozproszonychid 8084 ppt
TOiZ 09
Wyklad 2 TM 07 03 09
09 Podstawy chirurgii onkologicznejid 7979 ppt
Wyklad 4 HP 2008 09
09 TERMOIZOLACJA SPOSOBY DOCIEPLEŃ
09 Nadciśnienie tętnicze
wyk1 09 materiał
Niewydolność krążenia 09
09 Tydzień zwykły, 09 środa
09 Choroba niedokrwienna sercaid 7754 ppt
TD 09
więcej podobnych podstron