
Journal of Basic Microbiology 2011, 51, 385 – 396
385
© 2011 WILEY-VCH Verlag GmbH & Co. KGaA, Weinheim
www.jbm-journal.com
Research Paper
Rhamnolipid from Pseudomonas desmolyticum NCIM-2112
and its role in the degradation of Brown 3REL
Mital Jadhav
1
, Satish Kalme
2
, Dhawal Tamboli
3
and Sanjay Govindwar
4
1
Department of Microbiology, Shivaji University, Kolhapur, India
2
National Center for Biomedical Engineering Sciences, National University of Ireland, Galway, Ireland
3
Department of Biotechnology, Shivaji University, Kolhapur, India
4
Department of Biochemistry, Shivaji University, Kolhapur, India
The biosurfactant produced by Pseudomonas desmolyticum NCIM 2112 (Pd 2112) was confirmed as
rhamnolipid based on the formation of dark blue halos around the colonies in CTAB-methylene
blue agar plates and the content of rhamnose sugar. The average yield of rhamnolipid was
0.398 g/l/day when grown on hexadecane as sole carbon source. Pd 2112 emulsification
potential associated with cell free culture broth was stable for 72 h using various hydrocarbons
and vegetable oils. Chemical structure of the biosurfactant was identified as mono-rhamnolipid
(Rha-C
6
–C
8
) using HPTLC, fourier transform infrared spectroscopy,
1
H and
13
C NMR and gas
chromatography-mass spectroscopy analysis. Pd 2112 mono-rhamnolipid (1 mg/ml) had in-
creased permeabilization of Bacillus sp VUS NCIM 5342 and increased decolorization rate of
textile dye Brown 3REL by 50%. Extracellular activities of lignin peroxidase and veratryl
alcohol oxidase, enzymes involved in dye degradation, were significantly increased in the
presence of mono-rhamnolipid by 324.52% and 100% respectively. Scanning electron micro-
scopy observations revealed that rhamnolipid did not exert any disruptive action on Bacillus
cells as compared to Tween 80. The mono-rhamnolipid of Pd 2112 has potential for its
application in biodegradation of textile dyes.
Keywords: Mono-rhamnolipid / Pseudomonas desmolyticum / Decolorization / Lignin peroxidase / Biodegradation
Received: September 13, 2010; accepted: January 11, 2011
DOI 10.1002/jobm.201000364
Introduction
*
Biosurfactants are amphiphilic compounds that consti-
tute a diverse group of surface active molecules synthe-
sized by the microorganisms which either adhere to
cell surfaces or are excreted in the growth medium [1].
The distinctive properties of biosurfactants, like lower
toxicity, biodegradable nature, similar surface-active
properties and better environmental compatibility that
are not observed in synthetic surfactants have attracted
their use in various fields as multifunctional materials
for new century [2, 3]. Increasing environmental aware-
ness and emphasis on sustainable society in harmony
Correspondence: Prof. Sanjay Govindwar, Department of
Biochemistry, Shivaji University, Kolhapur-416-004, India
E-mail: spg_biochem@unishivaji.ac.in
Phone: +91-231-2609152
Fax: +91-231-2691533
with the global environment, during the recent years,
has led to serious consideration of biosurfactants as
possible alternative to synthetic surfactants as they
cause environmental problems due to their resistance
to biodegradability and toxicity to ecosystems [4].
Textile dyes are recalcitrant molecules. Pollution by
dye-waste water is becoming increasingly alarming
with the increasing use of a wide variety of dyes. Cur-
rently various chemical, physical and biological treat-
ment methods are used to remove the color [5]. Chemi-
cal and physical methods for treating dye wastewater
have disposal problems. Microbial decolorization and
degradation is an ecofriendly alternative to the chemi-
cal decomposition process [6]. The numerous advan-
tages of biosurfactants have promoted its applications
in the environmental remediation [7]. However, there
are no reports on the effects of biosurfactant on the
microbial dye degradation.

386 M.
Jadhav
et al.
Journal of Basic Microbiology 2011, 51, 385 – 396
© 2011 WILEY-VCH Verlag GmbH & Co. KGaA, Weinheim
www.jbm-journal.com
The biodegradation ability of bacteria is assumed to
be associated with the production of different en-
zymes. It is believed that surfactants alter the cell
membranes to facilitate enzyme release [8]. There re-
mains a dearth in availability of reports on the in-
fluence of biosurfactants on the enzymes involved
in microbial dye degradation. It can be a valuable ap-
proach to uncover the role of rhamnolipids in micro-
bial dye degradation with respect to its effects on the
microbes and the enzyme systems involved in the pro-
cess.
Recently, we have reported that Pseudomonas desmoly-
ticum NCIM 2112 (Pd 2112) could degrade diesel and
kerosene alone as well as in consortium with Nocardia
hydrocarbonoxydans [9]. Pd 2112 could reduce surface
tension of the growth medium and produce stable
emulsification during degradation of diesel and kero-
sene. In this work, we describe physical and chemical
characteristics of the rhamnolipid produced by
Pd 2112. And also the effects of Pd 2112 rhamnolipid
on dye degradation by Bacillus sp. VUS NCIM 5342 and
the enzyme systems involved in the same.
Materials and methods
Bacterial strains, growth, and media conditions
Pd 2112 was obtained from National Center for Indus-
trial Microorganisms (NCIM), Pune, India. Bacillus sp.
VUS NCIM 5342 was isolated from textile dye conta-
minated soil in our laboratory and deposited in
NCIM, Pune, India [10]. Pure cultures were maintained
on nutrient agar slants at 4 °C. Mineral salt medium
(MSM) was used for rhamnolipid synthesis with fol-
lowing composition (g/l): KH
2
PO
4
, 1.0; K
2
HPO
4
, 1.0;
MgSO
4
⋅ 7 H
2
O, 0.2; CaCl
2
⋅ 2 H
2
O, 0.2; FeCl
3
⋅ 6 H
2
O,
0.05; NH
4
NO
3
, 1.0. The final pH of the medium was
adjusted to 6.5 with 0.1 M HCl. The dry cell weight was
calculated using a predetermined correlation between
OD
660
and dry cell weight.
CTAB-methylene blue agar plate assay
Pd 2112 was initially assayed for rhamnolipid produc-
tion using mineral salt cetyltrimethylammoniumbro-
mide (CTAB)-methylene blue agar plate method (CTAB
0.2 mg/ml and methylene blue 5 μg/ml) [11]. Pd 2112
was grown for 24 h (OD
660
0.1) in MSM under appropri-
ate growth conditions. Shallow wells were cut into the
surface of the indicator plates. Ten micro liters of the
appropriate culture was placed into each well. The
plates were then incubated at 30 °C and checked peri-
odically over a 24 h to 48 h time period. The production
of rhamnolipid was confirmed by the formation of dark
blue halos around the colonies.
Cultivation conditions for rhamnolipid production
Pd 2112 was grown in the nutrient broth medium for
24 h at 30 °C. For biosurfactant production, 2% inocu-
lum of Pd 2112 was added in 100 ml MSM containing
2% (v/v) hexadecane. Cultivations were performed in
250 ml Erlenmeyer flasks and incubated at 30 °C in a
shaking incubator at 120 rpm for 168 h to obtain the
highest microbial growth and rhamnolipid concentra-
tions.
Extraction and quantification of rhamnolipid
Pd 2112 cells were separated from rhamnolipid produc-
tion medium by centrifugation at 8500 rpm at 4 °C for
20 min. The clear supernatant was further treated by
acidification to pH 2.0 using 6.0 M HCl and incubated
at 4 °C for ~12 h to precipitate biosurfactants. After
centrifugation at 10,000 rpm for 20 min, the precipitate
was dissolved in 0.1 M NaHCO
3
, followed by rham-
nolipid extraction using chloroform:methanol (2:1 v/v)
at room temperature. The organic phase was removed
using a rotary evaporator yielding a viscous honey-
colored rhamnolipid product.
The concentration of rhamnose produced was de-
termined using orcinol method [12]. In brief, 333 μl
culture supernatant was evaporated to dryness and
0.5 ml of distilled water was added to it. In 100 μl
samples 900 μl of 0.19% orcinol, prepared in 53%
H
2
SO
4
(v/v) was added. After heating at 80 °C for 30 min,
all samples were cooled at room temperature and
OD
421
was measured spectrophotometrically. Rham-
nolipid concentration was calculated using L-rhamnose
as standard and expressed as rhamnose equivalents
(RE).
Determination of surface tension
and emulsification index
Surface tension of cell-free culture broth was measured
according to the Du Nouy ring method using a surface
tensiometer (Jencon Company, India). The tensiometer
was calibrated before each measurement using distilled
water. The ring was cleaned with benzene at low heat-
ing for each measurement. Samples of the culture me-
dia were centrifuged at 8000 rpm for 20 min. The ring
was introduced in 50 ml cell-free culture broth apply-
ing an ascending force until the ring was pulled out
from the culture broth, and the surface tension was
recorded from the graduated dial.
Emulsification index (E24) was determined by the
addition of 4 ml hydrophobic substrate to equal volume

Journal of Basic Microbiology 2011, 51, 385 – 396
Rhamnolipid in dye degradation
387
© 2011 WILEY-VCH Verlag GmbH & Co. KGaA, Weinheim
www.jbm-journal.com
of cell free culture broth, mixed with a vortex for 2 min
and left to stand for 24 h. Emulsification activity E
24
(%)
was determined using following equation:
E
24
(%) =
¥
The height of emulsion layer
100 .
The height of total solution
The hydrophobic substrates like hexadecane, kerosene,
diesel, toluene, groundnut oil, sunflower oil, and corn
oil were tested for emulsification assay.
Structural characterization of rhamnolipid
High performance thin layer chromatography (HPTLC)
was carried out using a CAMAG thin layer chromato-
graphy system composed of an automatic TLC sampler
(CAMAG Linomat 5), automatic development chamber
(CAMAG ADC2), detector (CAMAG TLC Scanner 3), and
an electronic integrator (winCATS software). An aliquot
(15 μl) of the crude rhamnolipid sample was band ap-
plied (mm) on to an HPTLC precoated silica gel 60F
254
plate (10 × 10 cm). The sample was loaded at a dosage
speed of 50 nl/s under nitrogen stream. The sample was
developed (ascending) using 10 ml of the mobile phase
of CHCl
3
/CH
3
OH/H
2
O (65:25:4, v/v/v), in plates precondi-
tioned for 3 min, to a migration distance of 85 mm. The
plate was dried, sprayed with orcinol reagent (0.19%
orcinol in 53% H
2
SO
4
), and then put in a hot-air oven at
120 °C for 15 min. The developed chromatogram was
scanned in remission type, absorbance mode at 550 nm.
The signals recovered from the scanner were integrated
into absorbance chromatograms from which peak area
was automatically calculated using the winCATS soft-
ware. Based on the R
f
value, the band of rhamnolipid
was scratched off from the other HPTLC plate after
developing and was used for further characterizations.
1
H and
13
C-Nuclear magnetic resonance (NMR) spec-
tra were obtained using an OXFORD NMR
400
spectrome-
ter. The HPTLC purified rhamnolipids were deuterium-
exchanged by repeated evaporation in methanol-D
2
O
(1:1, v/v). The NMR spectra were determined in deuter-
ated methanol at 30
o
C using tetramethylsilane (TMS) as
an internal standard.
The Fourier transform infrared spectroscopy (FTIR;
Perkin-Elmer, Spectrum one) analysis of HPTLC purified
rhamnolipid was done in the mid IR region of 400–
4000 cm
–1
with 20 scan speed. The samples were mixed
with spectroscopically pure KBr in the ratio of 5:95.
The pellets were fixed in sample holder for an analysis.
The Gas chromatography-mass spectrometry (GC-MS)
analyses were performed using Varian 4000 mass spec-
trometer equipped with an integrated chromatograph
with a DB-5 column. Helium was used as carrier gas at
a flow rate of 1 ml/min. The injector temperature was
maintained at 280 °C with oven conditions as: 80 °C
kept constant for 2 min; increased up to 200 °C with
10 °C/min;
rose up to 280 °C with 20 °C/min rate. The
negative ion mode was used throughout and scans were
initiated over the 50–1000 m/z range.
Dye degradation experiments
Decolorization of Brown 3REL by Bacillus sp.
VUS NCIM 5342 in presence of rhamnolipid
Bacillus sp. VUS strain was grown in 250 ml Erlenmeyer
flask containing 100 ml nutrient broth at static condi-
tion for 24 h at 40 °C. Before addition of dye, cells were
permeabilized with Pd 2112 produced mono-rham-
nolipid (Pd mono-rhamnolipid, 1 mg/ml) for 30 min as
described by Galabova et al. [13]. A synthetic surfactant,
Tween 80 (1 mg/ml, v/v) was used to compare its effect
with that of mono-rhamnolipid on decolorization pro-
cess. Further, Brown 3REL (procured from Manpasand
textile industry, Ichalkaranji, India) (50 mg/l) was added
in the culture medium and incubated at same condi-
tions. Three milliliter aliquot of the culture media was
withdrawn at different time intervals, centrifuged at
6000 rpm for 20 min, and decolorization was deter-
mined by measuring the change in absorbance of cul-
ture supernatants at OD
440
(Hitachi U-2800). The per-
centage of decolorization was measured as reported
previously [10].
Effect of Pd mono-rhamnolipid
and dye concentrations on decolorization
The various concentrations of Pd mono-rhamnolipid
(0.5–2 mg/ml) and Brown 3REL (50–250 mg/l) were
added in nutrient broth in order to evaluate their effect
on decolorization ability of Bacillus sp. VUS. Percent
decolorization and dry cell weight were measured at
different time intervals. The correlation between the
specific decolorization rate and dye concentration was
described by Michaelis Menten kinetics (v
dye
= v
dye,max
[Dye]/K
m
+ [Dye]); where v
dye,max
and K
m
denoted maxi-
mum decolorization rate and Michaelis Menten con-
stant respectively and [Dye] represents the concentra-
tion of Brown 3REL (mg/l).
Enzymes status during dye decolorization
Preparation of cell free extract
Bacillus sp. VUS was grown in nutrient broth for 24 h at
40 °C, harvested by centrifugation (6000 rpm, 20 min)
and suspended in 50 mM potassium phosphate buf-
fer (pH 7.4) and sonicated (30 seconds, 60 amplitude,
10 strokes) at 4 °C. This extract was used as enzyme
source without centrifugation.
388 M.
Jadhav
et al.
Journal of Basic Microbiology 2011, 51, 385 – 396
© 2011 WILEY-VCH Verlag GmbH & Co. KGaA, Weinheim
www.jbm-journal.com
Enzyme assays
Lignin peroxidase (LiP), laccase, tyrosinase and veratryl
alcohol oxidase activities were assessed in cell free ex-
tract as well as culture free supernatant. LiP activity
was determined by monitoring the formation of pro-
panaldehyde by the method of Shanmugam et al. [14].
Laccase activity was determined in a 2 ml reaction mix-
ture containing 10% ABTS in 0.1 M acetate buffer (pH
4.9) by measuring increase in OD
420
[15]. Tyrosinase
activity was determined by the method of Zhang and
Flurkey [16]. Veratryl alcohol oxidase (VAO) was deter-
mined in a reaction mixture (2 ml) containing 4 mM
veratryl alcohol in 0.05 M citrate phosphate buffer
(pH 3) by monitoring the formation of veratraldehyde
at OD
310
[17]. All enzyme assays were carried out at
30 °C where reference blanks contained all components
except the enzyme. All enzyme assays were run in trip-
licate, average rates calculated and one unit of enzyme
activity was defined as change in absorbance unit per
min per mg of protein.
NADH-DCIP reductase activity was determined in cell
free extract using procedure reported earlier by Sa-
lokhe and Govindwar [18]. Riboflavin reductase [NAD-
(P)H:Flavin oxidoreductase] reaction rates were calcu-
lated using a molar extinction coefficient of 6.3 mM
cm
–1
by the method of Fontecave et al. [19].
Extraction and analysis of dye degradation products
After complete decolorization, medium was centrifuged
at 10,000 rpm for 20 min and supernatant was ex-
tracted with equal amount of ethyl acetate. The ex-
tracts were dried over anhydrous Na
2
SO
4
and evaporat-
ed to dryness on rotary evaporator. Metabolites ob-
tained after degradation were analyzed using HPLC and
FTIR spectroscopy. HPLC analyses were carried out
(Waters model no. 2690; Waters Corp., Milford, MA) on
C
18
column (symmetry, 4.6 × 250 mm) with methanol as
mobile phase at flow rate of 0.75 ml/min and UV detec-
tor at OD
316
. The FTIR (Perkin Elmer, Spectrum one) was
used to characterize the biodegraded products of Brown
3REL formed by mono-rhamnolipid treated cells and
compared with control dye and products formed by
mono-rhamnolipid untreated cells. The FTIR analysis
was performed as mentioned above except 16 scan
speed.
Scanning electron microscopy
of biosurfactant treated cells
Permeabilized cells and control cells were fixed in 2%
(w/v) glutaraldehyde for 2 h at 4 °C, washed with saline
solution, and dehydrated for 5 min in increasing etha-
nol concentrations (30, 50, 70, and 90% v/v) and for
15 min in absolute ethanol. The samples were air dried
then coated with gold in argon atmosphere to an ap-
proximate thickness of 50 nm with the help of sputter-
ing. The Scanning electron microscopy (SEM) observa-
tions were carried out using a scanning device JEOL
JSM-6360.
Statistical analysis
All values reported are the mean of three independent
measurements. The analyses were done using one-way
analysis of variance (ANOVA) with Tukey-Kramer mul-
tiple comparisons test.
Results
Production of mono-rhamnolipid
CTAB-methylene blue agar plate assay was used to de-
termine the rhamnolipid production by Pd 2112. A
positive reaction for rhamnolipid nature of the biosur-
factant was reported by the formation of a purple-blue
haze with a sharp defined edge around the culture well
after 24 h (data not shown). Pd 2112 produced biosur-
factant in MSM containing hexadecane as the sole car-
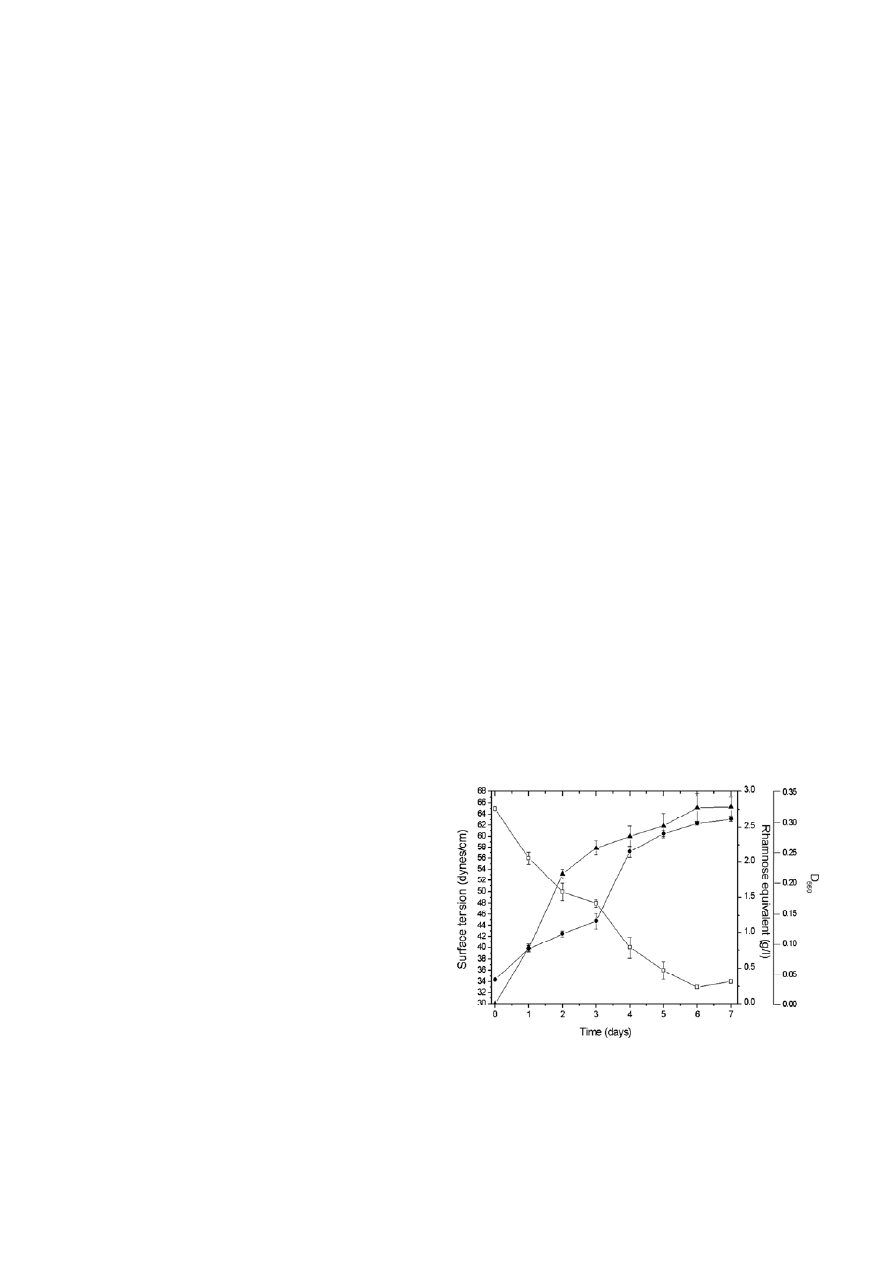
bon source. Fig. 1 depicts the growth of Pd 2112, sur-
face tension reduction of the culture broth, and
rhamnolipid production in MSM containing hexadec-
ane. Surface tension of the medium was reduced by
~51% at the end of 7 d incubation period. The rham-
nolipid production rate was 0.735 g/l d for initial 3 d,
followed by its dramatic decrease to 0.146 g/l d till 7 d
of incubation. The biosurfactant synthesis and surface
tension reduction were linearly proportional to Pd 2112
Figure 1. Time course evolution of Pd 2112 growth (
●), surface
tension reduction of the culture broth (
□), and the biosurfactant
produced in terms of rhamnose equivalent (
▲). Error bars represent
the standard deviation, calculated from at least three independent
experiments.
Journal of Basic Microbiology 2011, 51, 385 – 396
Rhamnolipid in dye degradation
389
© 2011 WILEY-VCH Verlag GmbH & Co. KGaA, Weinheim
www.jbm-journal.com
growth. The average yield of rhamnolipid was 0.398 g/l
d. Pd 2112 emulsification potential associated with cell
free culture broth was studied using various hydrocar-
bons and vegetable oils (data not shown). Diesel associ-
ated emulsification index (E
24
, 77 ± 1%) was signifi-
cantly higher (P < 0.001) than toluene associated E
24
(49.33 ± 0.66%). Among the vegetable oils studied, corn
oil and groundnut oil showed 74.33 ± 0.66% and
56.66 ± 0.88% emulsification activity, respectively. The
order of associated E
24
was: diesel > corn oil > sunflower
oil > kerosene/hexadecane > groundnut oil > toluene.
The emulsion was stable for ~72 h at room temperature
without any significant change in the emulsification
index.
Chemical structure of mono-rhamnolipid produced
by Pd 2112
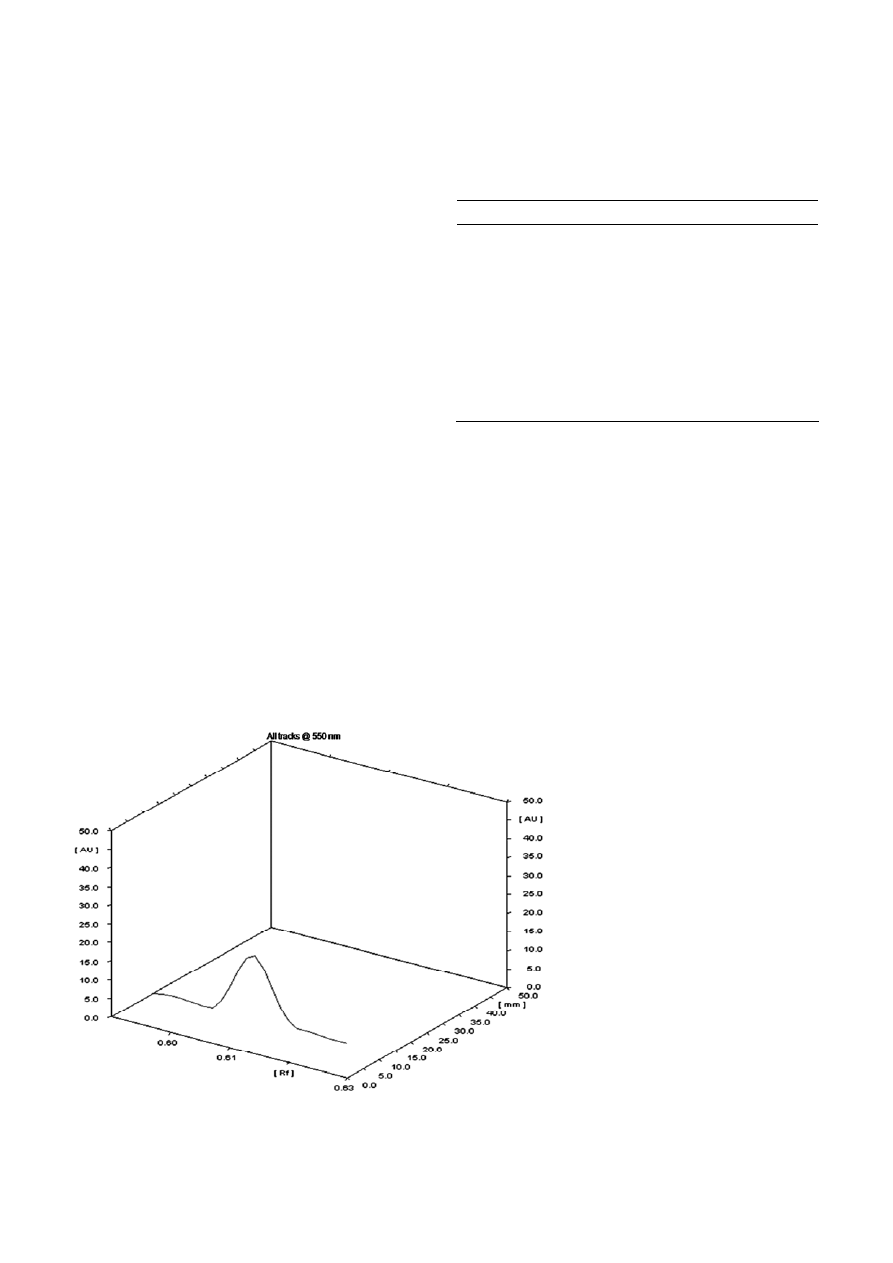
HPTLC results (Fig. 2) showed the presence of only one
peak; therefore, only one homologue was present in the
crude sample having the R
f
value of 0.61. The purified
rhamnolipid was analyzed using
1
H NMR and
13
C NMR.
As illustrated in Table 1 characteristic chemical shifts
indicate that the sample had the molecular structure of
monorhamnolipid. The long hydrocarbon chain and
rhamnose ring were indicated by the appearance of the
characteristic
1
H chemical shifts in the region of 0.96–
1.4 and 3.25–4.94 ppm, respectively.
1
H and
13
C NMR
analysis showed anomeric signal at δ 4.94/99.99, sug-
gesting L-rhamnosyl-hydroxyfatty acid linkage (1′ ↔ 1).
The rhamnosyl methyl protons are assigned to the
Table 1. Chemical shifts of purified rhamnolipid in
1
H NMR and
13
C NMR spectra.
Carbon
δ
1
H
δ
13
C
C-1′ 4.94
99.99
C-2′ 3.64
72.34
C-3′ 3.5
–
C-4′ 3.25
73.47
C-5′ 3.62
–
C-6′ 1.26
–
C-1 4.08
70.97
C-2 2.28
39.3
C-3 – –
C-4 – 70.69
C-5 2.37
40.13
–CH
2
– chain
1.4
–
CH
3
– 0.96
–
two overlapping doublets at 1.26 ppm. The chemical
shifts observed for hydrocarbon chains were 0.96 ppm
(for –CH
3
), 1.4 ppm (for –(CH
2
)– chain), 2.37 ppm (for
–CH
2
–COO–), and 3.62 ppm (for –O–CH–). The signal
at 3.64 ppm is assigned to rhamnose moiety, adjacent
to the lipid motif. The 3-hydroxyacyl lipid motifs are
evident from two proton peaks at 2.28 and 2.37 ppm.
These results are similar to those obtained by Wei et al.
[20].
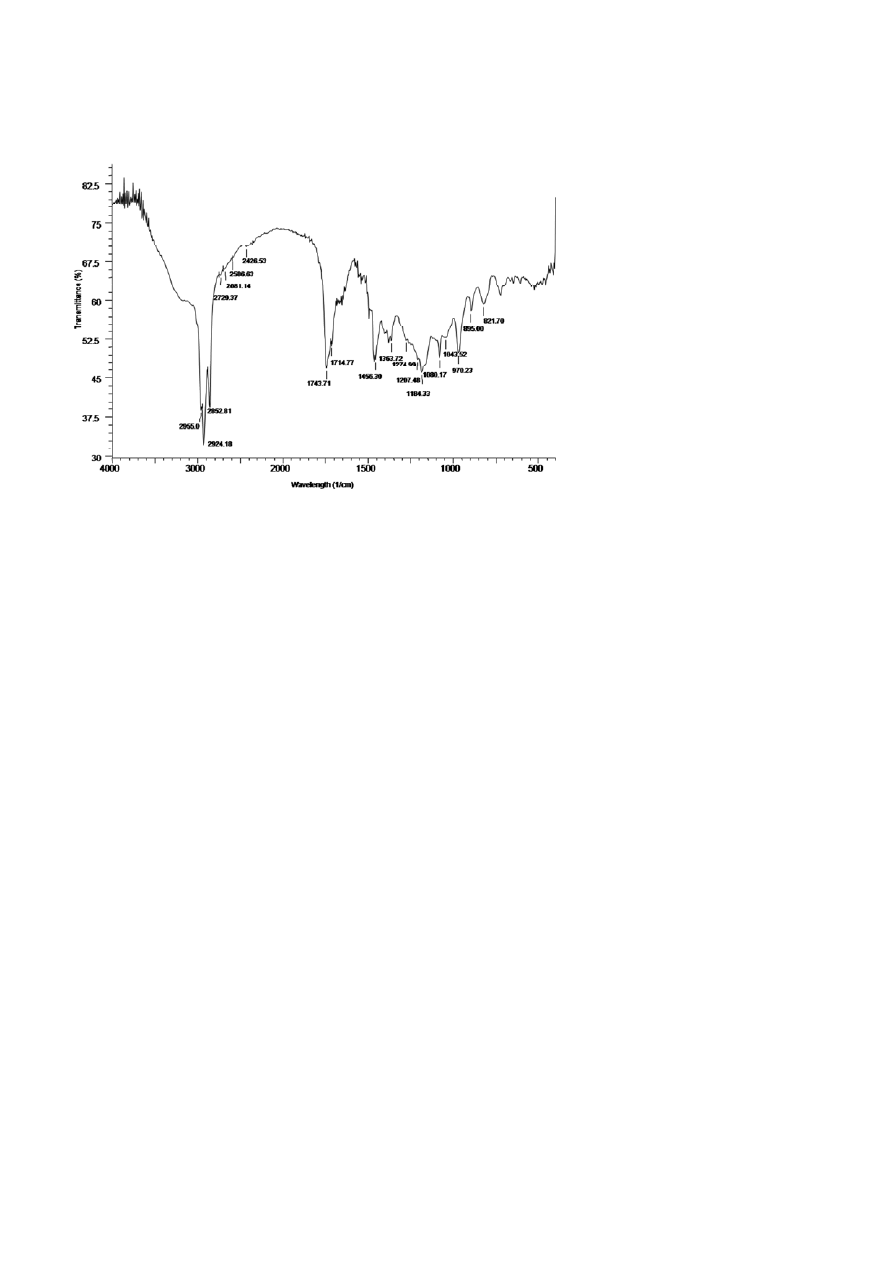
The chemical composition of the rhamnolipid was
preliminarily investigated using FTIR spectroscopy
(Fig. 3). The peaks at 2955, 2924, 2852, 1743, 1456, 1363
and 1274 cm
–1
indicate the chemical structure identical
to those of rhamnolipids which are composed of rham-
nose rings and long hydrocarbon chains. The peaks at
Figure 2. 3-D absorbance chromatogram of HPTLC of mono-rhamnolipid measured at 550 nm.
390 M.
Jadhav
et al.
Journal of Basic Microbiology 2011, 51, 385 – 396
© 2011 WILEY-VCH Verlag GmbH & Co. KGaA, Weinheim
www.jbm-journal.com
Figure 3. FTIR spectroscopy analysis of rhamnolipid produced by Pd 2112.
2955, 2924 and 2852 cm
–1
indicate the C–H stretching
vibrations of hydrocarbon chain position. Peak at
1743 cm
–1
relates to the C=O stretching vibrations of
the carbonyl groups. The deformation vibrations at
1456 and 1363 cm
–1
represent alkyl groups while the
peak at 1274 cm
–1
showed the presence of C–O stretch-
ing in hydrocarbon chain. The peaks in the range of
1080–1043 cm
–1
corresponded to C–O–C stretching in
the rhamnose. Similar results were obtained by Porn-
sunthorntawee et al. [21] and Bondarenko et al. [22].
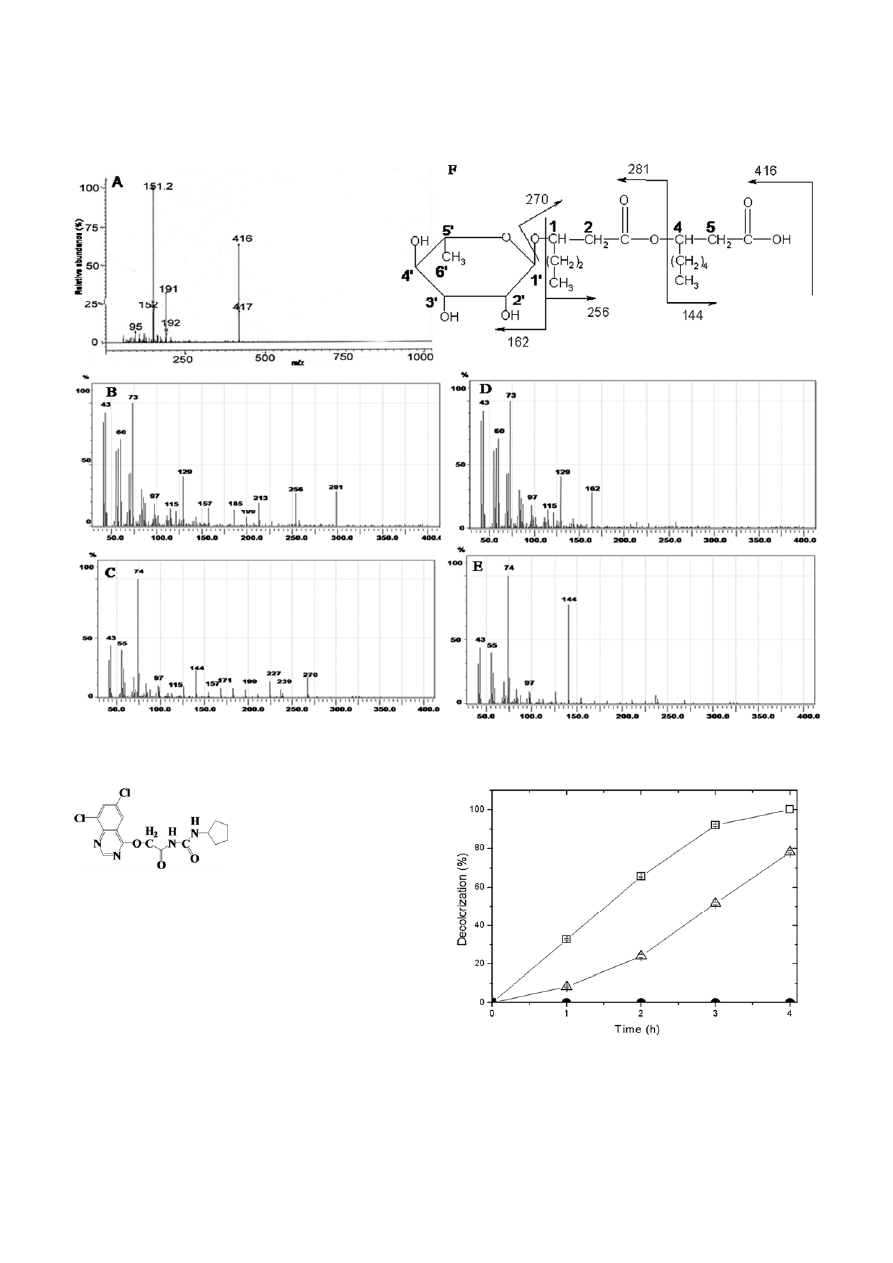
The mass spectrometric analysis of the rhamnolipid
complements the FTIR and NMR spectra results. It
showed the main pseudo-molecular ion at m/z 416
(Fig. 4A–E). The fragmentation pattern is consistent
with the mono-rhamnolipid structure (Rha-C
6
–C
8
)
(Fig. 4F). The ion fragment at m/z 162 is related to the
cleavage of the rhamnose moiety. The same cleavage
also produced m/z 270 ion which represents the fatty
acid moiety. The peak at m/z 281 represents the rup-
ture of an ester link between two alkylic chains of
mono-rhamnolipid along with peak m/z 144 for the loss
of terminal C
8
. The fatty acid moiety of the mono-
rhamnolipid consisted of two saturated hydroxy fatty
acids of 6- and 8-carbon lengths. This data constitutes
the structure of mono-rhamnolipid (Rha-C
6
–C
8
) pro-
duced by Pd 2112.
Biodegradation of Brown 3REL
Bacillus sp. VUS could decolorize textile dye Brown 3REL
(Fig. 5) in 8 h; however Pd 2112 mono-rhamnolipid
(1 mg/ml) permeabilized Bacillus sp. decolorized the
same amount of dye in 4 h (Fig. 6). The permeabilized
cells had doubled the rate of dye decolorization as
compared to the untreated cells. Tween 80 (1 mg/ml,
v/v), a synthetic surfactant, treated Bacillus sp. cells did
not show decolorization and settled in the decoloriza-
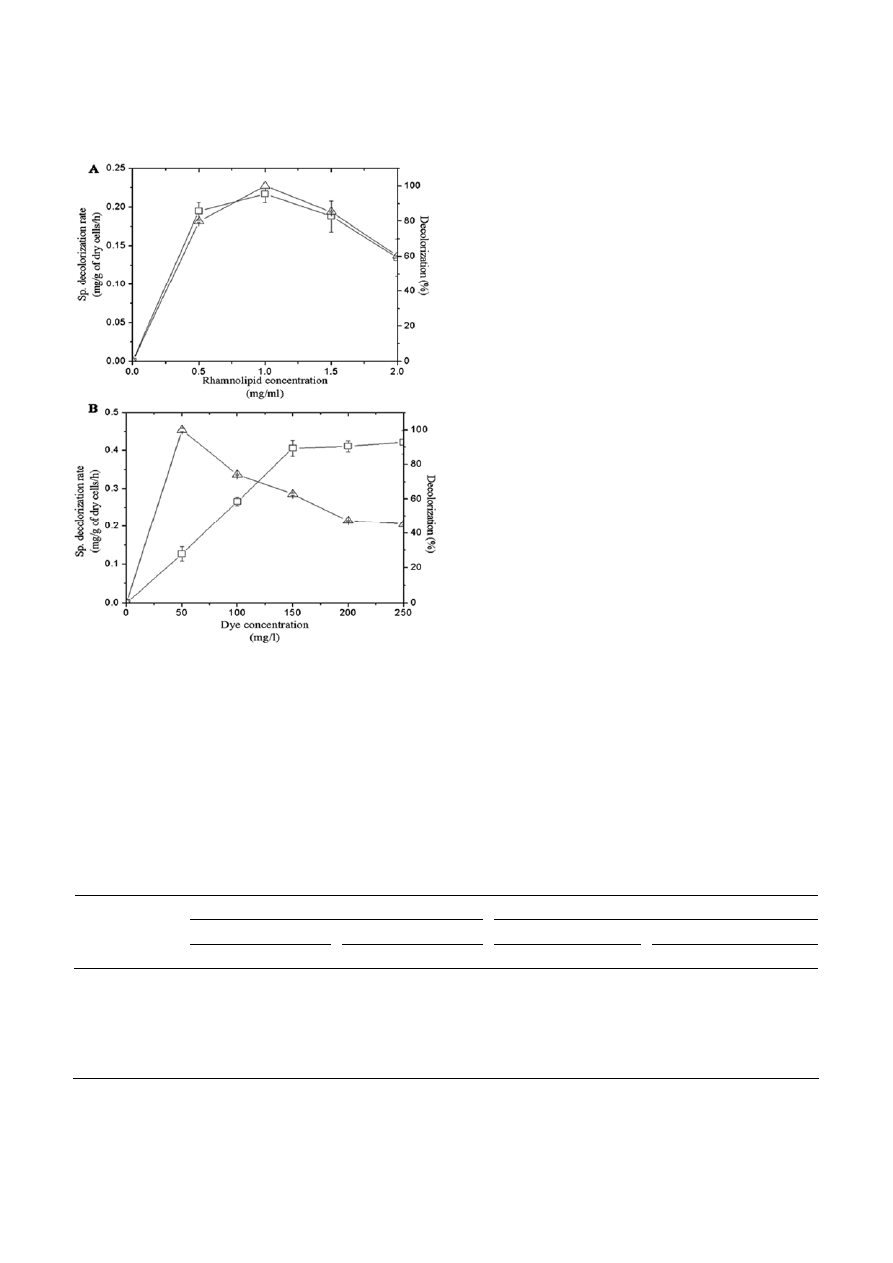
tion medium. The optimum concentration of rham-
nolipid was 1 mg/ml to achieve maximum decoloriza-
tion rate and decolorization efficiency (Fig. 7A). Rham-
nolipid treated Bacillus sp. VUS decolorized increasing
concentrations of Brown 3REL (50–250 mg/l) however,
% decolorization was decreased after 50 mg/l dye con-
centration (Fig. 7B). The kinetic constants estimated for
decolorization at different dye concentrations in the
presence of 1 mg/ml of rhamnolipid were 1.052 mg/g
cell /h for V
dye, max
and 50 mg/l for K
m
.
In order to acquire information about the effect of
mono-rhamnolipid on the enzyme systems involved in
the dye degradation, activities of various oxidative and
reductive enzymes before and after decolorization were
evaluated in the rhamnolipid treated and untreated
Bacillus sp. cells (Table 2). The activities of the evaluated
enzymes were lower at 0 h in the absence of mono-
rhamnolipid than for treated ones. The extracellular
activities of Lip and VAO were significantly increased
by 324.52% and 100% in rhamnolipid treated cells.
Induction in intracellular activities of Lip (245.56%),
laccase (100%), VAO (185.12%) and NADH-DCIP reduc-
tase (142.60%) were observed in treated cells. In rham-
nolipid treated cells, the extracellular Lip activity was
induced by 220.83% at 0 h and 276.08% at 4 h and in-
tracellular Lip activity was 205.72% higher at 4 h as
compared to untreated cells. However, extracellular
VAO activity was increased by 480% at 4 h; intracellu-
Journal of Basic Microbiology 2011, 51, 385 – 396
Rhamnolipid in dye degradation
391
© 2011 WILEY-VCH Verlag GmbH & Co. KGaA, Weinheim
www.jbm-journal.com
Figure 4. GC-MS spectra of rhamnolipid sample and principal fragmentations of mono-rhamnolipids produced by Pd 2112 (A – E). Structure
drawn within spectra shows the molecular base fragmentation of the rhamnolipid molecules (F).
Figure 5. Structure of Brown 3REL.
lar VAO activity was 302.50% higher at 0 h and
329.41% higher at 4 h over that of untreated cells.
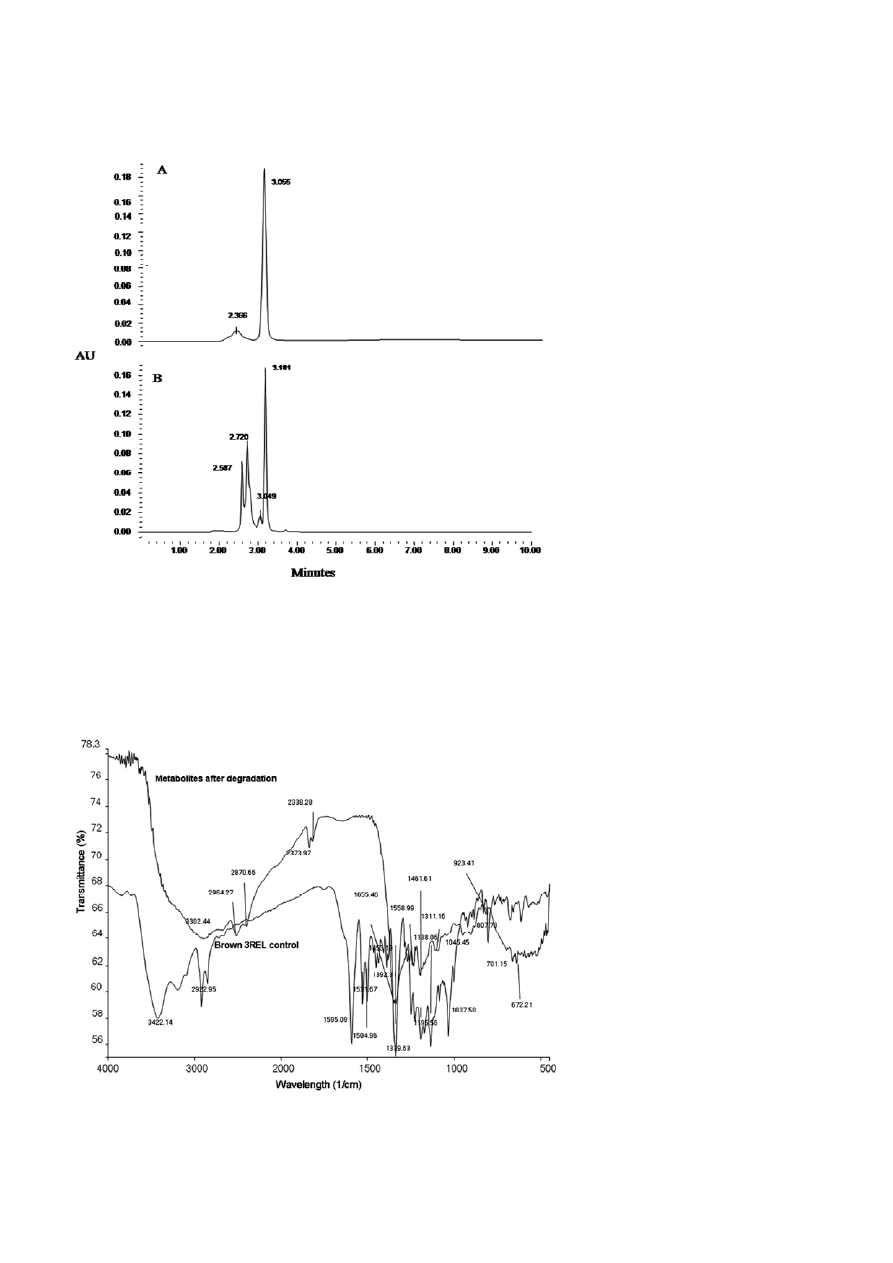
Biodegradation analysis
The difference in HPLC and FTIR spectrum of control
dye and extracted metabolites indicated biodegradation
of Brown 3REL. HPLC analysis of Brown 3REL dye
showed a major peak at retention time 3.05 min and
minor peak at 2.36 min (Fig. 8A) whereas the meta-
bolites extracted after degradation showed the peaks
at retention time 2.587, 2.720, 3.049, and 3.181 min
Figure 6. Percentage decolorization (Control,
∆) of Brown 3REL
(50 mg/l) by Bacillus sp. VUS in the absence and in the presence
(Test,
□) of rhamnolipid (1 mg/ml) and (▲) Tween 80 (1 mg/ml).
Error bars represent the standard deviation, calculated from at least
three independent experiments.
392 M.
Jadhav
et al.
Journal of Basic Microbiology 2011, 51, 385 – 396
© 2011 WILEY-VCH Verlag GmbH & Co. KGaA, Weinheim
www.jbm-journal.com
Figure 7. Effect of various concentrations of rhamnolipid on speci-
fic decolorization rate (
□) and percent decolorization (∆) of Brown
3REL by Bacillus sp. VUS (A) and Effect of various concentrations
of dye on specific decolorization rate (
□) and percent decolorization
(
∆) of Brown 3REL by Bacillus sp. VUS in the presence of mono-
rhamnolipid (1
mg/ml) (B). Error bars represent the standard
deviation, calculated from at least three independent experiments.
(Fig. 8B). FTIR spectrum (Fig. 9) of control dye showed
different peaks at 3422
cm
–1
for C=O overtone,
2922 cm
–1
for C–H asymmetric stretching and 1595 cm
–1
for stretching vibrations between N–H bond. We also
observed C=C symmetric stretching (1504 cm
–1
), C–H
scissoring (1453
cm
–1
), C–N stretching (1531 and
1195 cm
–1
), O–H deformation (1392 cm
–1
), C–H de-
formation (1339 and 1138 cm
–1
), C–OH stretching
(1037 cm
–1
) and N–O stretching vibrations (807 cm
–1
).
In the extracted metabolites new peaks at 3302, 2373
and 2338, 1655, 1461, and 923 cm
–1
represents C–H
stretching, O–H stretching, C=N stretching, asymmet-
ric deformation of C–H and C–O stretching respec-
tively. Also, peaks at 2922, 1595, 1392, 1195 and
1037 cm
–1
present in the control spectra are absent in
the metabolites.
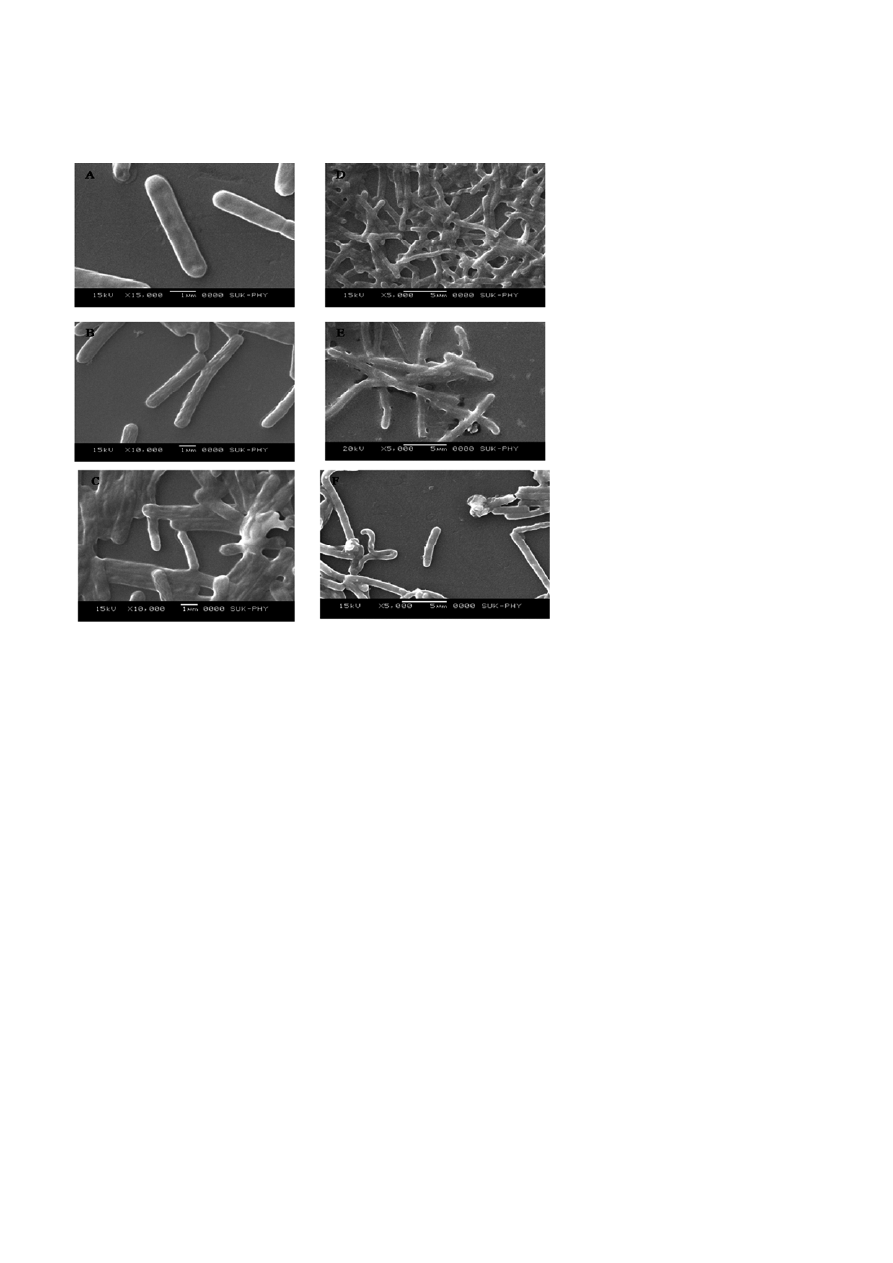
Scanning-electron microscopy
To examine morphological changes at the ultra struc-
tural level, Bacillus sp. VUS cells were permeabilized
with mono-rhamnolipid and observed using SEM. The
untreated cells (Fig. 10A) had apparent outlines and
smooth surfaces. In contrast, the cells permeabilized
with 1 mg/ml rhamnolipid (Fig. 10B) had altered cell
shapes, rough surfaces and folded cell walls. Whereas,
those cells treated with the same concentration of
Tween 80 (Fig. 10C) showed indistinct bulged cells with
different shapes and sizes and have hazy outlines. Simi-
lar results were obtained with the cells treated with
lower concentrations (0.1, 0.01 and 0.001 mg/ml) of
Tween 80 (Fig. 10D, E and F).
Discussion
Pd 2112 had been reported for biodegradation of diesel
and kerosene, and biodecolorization of sulfonated azo
dyes [9, 23, 24]. In this study, Pd 2112 formed halos
on blue agar plates which indicate the production of
extracellular anionic glycolipids. Pd 2112 produced
2.79 g/l of rhamnolipid and reduced surface tension of
Table 2. Enzyme activity status during decolorization of Brown 3REL by Bacillus sp. VUS in absence (control) and presence (test)
of rhamnolipid.
Control Test
0 h
4 h
0 h
4 h
Enzyme
E I E I E I E I
Lignin peroxidase
a
0.024 ± 0.005 0.075 ± 0.009 0.063 ± 0.016 0.095 ± 0.002 0.053 ± 0.002 0.079 ± 0.012 0.172 ± 0.020** 0.194 ± 0.020**
Laccase
a
– – – 0.023
±
0.010
–
0.014 ± 0.002 –
0.071 ± 0.004**
Tyrosinase
a
–
–
–
0.004 ± 0.001 –
0.001
–
0.014 ± 0.001
Veratryl alcohol
oxidase
a
–
0.040 ± 0.008 0.02 ± 0.005 0.068 ± 0.018 –
0.121 ± 0.012 0.096 ± 0.009** 0.224 ± 0.016**
DCIP Reductase
b
–
6.39 ± 0.870 –
9.97 ± 0.240 –
17.23 ± 0.340
–
24.57 ± 1.310*
Riboflavin reductase
c
–
1.34
–
2.215 ± 0.315 –
1.34
–
8.485 ± 2.415*
E – Extracellular; I – Intracellular;
a
activity in units mg/min;
b
mg of DCIP reduced mg/min;
c
µg of riboflavin reduced mg/min;
Significantly different than control (0 h) at *P < 0.05, **P < 0.01.
Journal of Basic Microbiology 2011, 51, 385 – 396
Rhamnolipid in dye degradation
393
© 2011 WILEY-VCH Verlag GmbH & Co. KGaA, Weinheim
www.jbm-journal.com
Figure 8. HPLC elution profile of Brown 3REL (A) and its degradation products formed in the presence of rhamnolipid (B).
MSM-hexadecane medium to 33 dynes cm
–1
(51% of
control). Pd 2112 had reduced surface tension by 47.7%
when grown in Bushnell-Hash medium containing
diesel as the sole carbon source [9]. The stable emul-
sions formed (~72 h) with diesel and vegetable oils are
indicative of potential use of these surface active com-
pounds as emulsifying agents. Substrate-specific emul-
sification by biosurfactant has been demonstrated by
Falatko and Novak [25]. Further, Flavobacterium sp. DS5-
73 and Micrococcus sp. GS2-22 were reported to produce
Figure 9. FTIR spectra of Brown 3REL and its degradation products formed in the presence of rhamnolipid.
394 M.
Jadhav
et al.
Journal of Basic Microbiology 2011, 51, 385 – 396
© 2011 WILEY-VCH Verlag GmbH & Co. KGaA, Weinheim
www.jbm-journal.com
Figure 10. Scanning electron micrographs of Bacillus sp. VUS. Control cells (A), Cells permeabilized 1 mg/ml of rhamnolipid (B), Cells
permeabilized with Tween 80, 1 mg/ml (C), 0.1 mg/ml (D), 0.01 mg/ml (E) and 0.001 mg/ml (F).
surfactants with the ability to emulsify various hydro-
carbons, irrespective of the substrates used as carbon
source [26]. Here, Pd 2112 produced biosurfactant using
hexadecane as the sole carbon source and it could
emulsify hexadecane as well as other hydrophobic
compounds studied. These results suggest that the
emulsification activity of Pd 2112 biosurfactant is not
substrate-specific.
HPTLC, FTIR, NMR and mass spectra data verified a
typical structure between the compounds with the
presence of rhamnose and lipidic group. The biosurfac-
tant produced by Pd 2112 was physicochemically and
structurally characterized as a mono-rhamnolipid (Rha-
C
6
–C
8
), which is in contrast with P. aeruginosa that
makes both mono-rhamnolipids and di-rhamnolipids
[27]. Pseudomonads are the best-known bacteria capable
of utilizing hydrocarbons as carbon and energy sources
and producing biosurfactants [28]. Among Pseudomo-
nads, Pseudomonas aeruginosa, P. putida, P. fluorescens, and
P. rubescans are studied for the production of mixture of
mono and di-rhamnolipid type of biosurfactants [27].
Till date, P. chlororaphis is the only organism reported
for the production of mono-rhamnolipid type of biosur-
factant while B. pseudomallei, makes only di-rhamnolipid
[29, 30]. Furthermore, GC-MS analysis have shown that
there is much variation in the composition of fatty acid
chains of rhamnolipids produced by Pd 2112 as com-
pared to rhamnolipids produced by P. aeruginosa,
P. chlororaphis, and Burkholderia pseudomallei. The lengths
of the fatty acid chains of rhamnolipids can vary sig-
nificantly, resulting in a multitude of different rham-
nolipid compositions. P. aeruginosa has been reported to
produce 28 different homologues of rhamnolipids [31].
Fatty acyl chains composed of 8, 10, 12, and 14 carbons
in length, as well as 12 or 14 carbon chains with double
bonds (12:1, 14:1), have been observed in rhamnolipids
produced by P. aeruginosa or B. pseudomallei [30, 31].
P. chlororaphis strain NRRL B-30761 produced rham-
nolipids with fatty acids containing carbon lengths of 8,
10, 12, 14, 12:1, and 14:1 [29]. This differs from our
results which indicated that Pd 2112 is capable of mak-
ing rhamnolipid with fatty acid containing chain
length of 6 and 8. The differences either in the strain
or in the culture conditions used may result in varia-
tion in the composition of fatty acid chains of rham-
nolipids.

Journal of Basic Microbiology 2011, 51, 385 – 396
Rhamnolipid in dye degradation
395
© 2011 WILEY-VCH Verlag GmbH & Co. KGaA, Weinheim
www.jbm-journal.com
Bacillus sp. VUS which could efficiently decolorize a
range of textile dyes was selected to assess the role of
rhamnolipid in dye decolorization process with respect
to its effects on bacterial cells and the enzyme systems
involved in it. Permeabilization of Bacillus sp. VUS with
1 mg/ml rhamnolipid resulted in decreasing the time
required for degradation of Brown 3REL by half. In this
study, induction of extracellular LiP, intracellular LiP
and laccase during decolorization were responsible for
complete decolorization of Brown 3REL. Surfactants
were reported for their stimulatory effects on enzymes
like α amylase [32], cellulases and xylanases [33], phy-
tase production [34] etc. and their release in solid state
or submerged fermentation however, the mechanism
of action is still not clear [35, 36]. Most reports believe
that surfactants improve the permeability of cell mem-
brane to facilitate the enzyme release [8, 35]. Also the
unique ability of biosurfactants to enhance biodegrada-
tion has gained more and more attention and will un-
doubtedly lead to its application in pollution control
[37]. The results showed the intensified effects of
rhamnolipid on the enzymes involved in dye degrada-
tion process and the stimulatory effect on Lip and VAO
were much eminent. Liu et al. [38] reported 161.98%
increase in the activity of Lip by Phanerochaete chrysospo-
rium in the presence of dirhamnolipid. Also Liang et al.
[37] reported increase in Lip activity by 86%. Thus, the
higher activities of enzymes involved in dye degrada-
tion have favorably increased the biodegradation rate of
Brown 3REL by 50%. HPLC and FTIR analysis of ex-
tracted metabolites indicated the biodegradation of the
parent dye compound by Bacillus sp. VUS. HPLC analysis
(Fig. 9) showed that the peak at 3.055 min is shifted to
3.181 min; that means a big part of the original mate-
rial has been changed a little bit to be more hydropho-
bic (reducing enzymes seem to be responsible). Other
parts of the material have been changed a little bit to
be more hydrophilic (2.587 min, 2.720 min; oxidizing
enzymes seem to be responsible). The oxidase and re-
ductase susceptible peaks (Fig. 10, FTIR peaks at 2922,
1595, 1392, 1195 and 1037 cm
–1
) present in the control
spectra, that are absent in the metabolites, supported
enzyme induction data and HPLC analysis however
further investigation of metabolites by GC-MS is in
progress to understand degradation pattern of Brown
3REL by Bacillus sp. VUS.
In conclusion, Pd 2112 is a very efficient mono-
rhamnolipid producer and the culture conditions pro-
mote very high titers of rhamnolipid production. Also,
Bacillus sp. VUS NCIM 5342 is an efficient strain for the
treatment of dye containing waste waters. Its treatment
with rhamnolipids has increased its potential for dye
decolorization thus making it more competent and
suitable for its use in the bioremediation of textile dye
contaminated sites. Thus, the study indicates the effec-
tiveness of the rhamnolipid on micro-organisms in-
volved in dye degradation and the enzymes involved in
the process.
Acknowledgement
M. J. is thankful to Shivaji University for awarding ‘De-
partmental Research Fellowship’.
References
[1] Muthusamy, K., Gopalakrishnan, S., Ravi, T.K., Sivachi-
dambaram, P., 2008. Biosurfactants: properties, commer-
cial production and application. Curr. Sci., 94, 736–747.
[2] Kitamoto, D., Isoda, H., Nakahara, T., 2002. Functional
and potential applications of glycolipid biosurfactant
from energy saving materials to gene delivery carriers. J.
Biosci. Bioeng., 94, 187–201.
[3] Wei, Y.H., Cheng, C.L., Chien, C.C., Wan, H.M., 2008.
Enhanced di-rhamnolipid production with an indigenous
isolate Pseudomonas aeruginosa J16. Process Biochem., 43,
769–774.
[4] George, S., Jayachandran, K., 2009. Analysis of rham-
nolipid biosurfactants produced through submerged fer-
mentation using orange fruit peelings as sole carbon
source. Appl. Biochem. Biotechnol., 158, 694–705.
[5] Telke, A., Kalyani, D., Jadhav, J., Govindwar, S., 2008.
Kinetics and mechanism of reactive red 141 degradation
by a bacterial isolate Rhizobium radiobacter MTCC 8161. Ac-
ta Chim. Solv., 55, 320–329.
[6] Jadhav, S.U., Kalme, S.D., Govindwar, S.P., 2008. Biodeg-
radation of methyl red by Galactomyces geotrichum MTCC
1360. Int. Biodeter. Biodegrad., 62, 135–142.
[7] Beal, R ., Betts, W.B., 2000. Role of rhamnolipid biosurfac-
tants in the uptake and mineralization of hexadecane in
Pseudomonas aeruginosa. J. Appl. Microbiol., 89, 158168.
[8] Ahuja, S.K., Ferreira, G.M., Moreira, A.R., 2004. Produc-
tion of an endoglucanase by the shipworm bacterium
Teredinobacter turnirae. J. Ind. Microbiol. Biotechnol., 31,
41–47.
[9] Kalme, S., Parshetti, G., Gomare, S., Govindwar, S., 2008.
Diesel and kerosene degradation by Pseudomonas desmolyti-
cum NCIM 2112 and Nocardia hydrocarbonoxydans NCIM
2386. Curr. Microbiol., 56, 581–586.
[10] Dawkar, V.V., Jadhav, U.U., Jadhav, S.U., Govindwar, S.P.,
2008. Biodegradation of disperse textile dye Brown 3REL
by newly isolated Bacillus sp. VUS. J. Appl. Microbiol., 105,
14–24.
[11] Siegmund, I., Wagner, F., 1991. New method for detecting
rhamnolipids excreted by Pseudomonas species during
growth on mineral agar. Biotechnol. Tech., 5, 265–268.
[12] Chandrasekaran, E.V., Bemiller, J.N., 1980. Constituent
analyses of glycosaminoglycans. In: Methods in Carbohy-

396 M.
Jadhav
et al.
Journal of Basic Microbiology 2011, 51, 385 – 396
© 2011 WILEY-VCH Verlag GmbH & Co. KGaA, Weinheim
www.jbm-journal.com
drate Chemistry (Whistler, R.L., ed). Academic press, New
York, pp. 89–96.
[13] Galabova, D., Tuleva, B., Spasova, D., 1996. Permeabiliza-
tion of Yarrowia lipolytica cells by triton X-100. Enzyme
Microb. Technol., 18, 18–22.
[14] Shanmugam, V., Kumari, M., Yadav, K.D., 1999. n-pro-
panol as a substrate for assaying the lignin peroxidase ac-
tivity of Phanerochaete chrysoporium. Ind. J. Biochem. Bio-
phys., 36, 39–43.
[15] Hatvani, N., Mecs, I., 2001. Production of laccase and
manganese peroxidase by Lentinus edodes on malt contain-
ing by product of the brewing process. Process Biochem.,
37, 491–496.
[16] Zang, X., Flurkey, W., 1997. Phenol oxidases in Portabella
Mushrooms. J. Food Sci., 62, 97–100.
[17] Jadhav, U.U., Dawkar, V.V., Tamboli, D.P., Govindwar,
S.P., 2009. Purification and characterization of veratryl
alcohol oxidase form Comamonas sp. UVS and its role in
dye decolorization. Biotechnol. Bioprocess. Eng., 14, 369–
376.
[18] Salokhe, M.D., Govindwar, S.P., 1999. Effect of carbon
source on the biotransformation enzymes in Serratia mar-
cescens. World J. Microbiol. Biotechnol., 15, 229–232.
[19] Fontecave, M., Eliasson, R., Reichard, P., 1987. NAD (P)H:
flavin oxidoreductase of E. coli: a ferric iron reductase par-
ticipating in the generation of the free radical of ribonu-
cleotide reductase. J. Biol. Chem., 262, 12325–12331.
[20] Wei, Y.H., Chien, L.C., Chang, J.S., 2005. Rhamnolipid
production by indigenous Pseudomonas aeruginosa J4 origi-
nating from petrochemical wastewater. Biochemical Eng.
J., 27, 146–154.
[21] Pornsunthorntawee, O., Wongpanit, P., Chavadej, S., Abe,
M., Rujiravanit, R., 2008. Structural and physicochemical
characterization of crude biosurfactant produced by Pseu-
domonas aeruginosa SP4 isolated from petroleum-conta-
minated soil. Bioresour. Technol., 99, 1589–1595.
[22] Bondarenko, O., Rahman, P.K.S.M., Rahman, T.J., Kahru,
A., Ivask, A., 2010. Effects of rhamnolipid from Pseudomo-
nas aeruginosa DS10-129 on luminescent bacteria: toxicity
and modulation of cadmium bioavailability. Microb. Ecol.,
59, 588–600.
[23] Kalme, S.D., Parshetti, G.K., Jadhav, S.U., Govindwar, S.P.,
2007. Biodegradation of benzidine based dye Direct blue 6
by Pseudomonas desmolyticum NCIM 2112. Bioresour. Tech-
nol., 98, 1405–1410.
[24] Kalme, S., Jadhav, S., Jadhav, M., Govindwar, S., 2009.
Textile dye degrading laccase from Pseudomonas desmolyti-
cum NCIM 2112. Enzyme Microb. Technol., 44, 65–71.
[25] Falatko, D.F., Novak, J.T., 1992. Effects of biologically
produced surfactants on the mobility and biodegradation
of petroleum hydrocarbons. Water Environ. Res., 64,
163–169.
[26] Rahman, K.S.M., Rahman, T.J., Kourkoutas, Y., Petsas, I.,
Marchant, R., Banat, I.M., 2003. Enhanced bioremediation
of n-alkane in petroleum sludge using bacterium consor-
tium amended with rhamnolipid and micronutrients. Bio-
resour. Technol., 90, 159–168.
[27] Kumar, M., Leon, V., Materano, A.D.S., Ilzins, O.A., Luis,
L., 2008. Biosurfactant production and hydrocarbon-de-
gradation by halotolerant and thermotolerant Pseudomo-
nas sp. World J. Microbiol. Biotechnol., 24, 1047–1057.
[28] Perfumo, A., Banat, I.M., Canganella, F., Marchant, R.,
2006. Rhamnolipid production by a novel thermophilic
hydrocarbon-degrading Pseudomonas aeruginosa APO2-1.
Appl. Microbiol. Biotechnol., 72, 132–138.
[29] Gunther, N.W., Nunez, A., Fett, W., Solaiman, D.K.Y.,
2005. Production of rhamnolipids by Pseudomonas chloro-
raphis, a nonpathogenic bacterium. Appl. Environ. Micro-
biol., l71, 2288–2293.
[30] Haussler, S., Nimtz, M., Domke, T., Wray, V., Steinmetz,
I., 1998. Purification and characterization of a cytotoxic
exolipid of Burkholderia pseudomallei. Infect Immun., 66,
1588–1593.
[31] Deziel, E., Lepine, F., Dennie, D., Boismenu, D., Mamer,
O.A., Villemur, R., 1999. Liquid chromatography/mass
spectrometry analysis of mixtures of rhamnolipids pro-
duced by Pseudomonas aeruginosa strain 57RP grown on
mannitol or naphthalene. Biochim. Biophys. Acta, 1440,
244–252.
[32] Goes, A.P., Sheppard, J.D., 1999. Effect of surfactants on
α
-amylase production in a solid substrate fermentation
process. J. Chem. Technol. Biotechnol., 74, 709–712.
[33] Liu, J., Yuan, X., Zeng, G., Shi, J., Shi, C., 2006. Effect of
biosurfactant on cellulase and xylanase production by Tri-
choderma viride in solid substrate fermentation. Process
Biochem., 41, 2347–2351.
[34] Mandviwala, T.N., Khire, J.M., 2000. Production of high
activity thermostable phytase from thermotolerant Asper-
gillus niger in solid state fermentation. J. Ind. Microbiol.
Biotechnol., 24, 237–243.
[35] Pardo, A.G., 1996. Effect of surfactants on cellulose pro-
duction by Nectria catalinensis. Curr. Microbiol., 33, 275–
278.
[36] Zeng, G.M., Shi, J.G., Yuan, X.Z., Liu, J. et al., 2006. Effects
of Tween 80 and rhamnolipid on the extracellular en-
zymes of Penicillium simplicissimum isolated from compost.
Enzyme Microb. Technol., 39, 1451–1456.
[37] Liang, Y.S., Yuan, X.Z., Zeng, G.M., Hu, C.L. et al., 2010.
Biodelignification of rice straw by Phanerochaete chrysospo-
rium in the presence of dirhamnolipid. Biodegradation
DOI 10.1007/s10532-010-9329-0.
[38] Liu, X.L., Zeng, G.M., Tang, L., Zhong, H. et al., 2008. Ef-
fects of dirhamnolipid and SDS on enzyme production by
Phanerochaete chrysosporium in submerged fermentation.
Process Biochem., 43, 1300–1303.
Wyszukiwarka
Podobne podstrony:
jobm 201000013
jobm 201000298
jobm 201000191
jobm 201000321
jobm 201000018
jobm 201000214
jobm 201000067
jobm 201000037
jobm 201000074
jobm 201000280
jobm 201000385
jobm 201000198
jobm 201000458
jobm 201000147
jobm 201000520
jobm 201000327
jobm 201000342
jobm 201000420
jobm 201000317
więcej podobnych podstron