In 2012 EUFIC launched www.coolfoodplanet.org, a new and exciting
educational website for children, to help them learn about health, nutrition
and food safety in a way that is engaging and fun.
What is Cool Food Planet?
With the overall aim of emphasising healthy lifestyle choices, Cool Food Planet
uses customisable cartoon characters to let children aged 612 years explore a
wide range of learning tools and interactive games. The language is simple, clear
and includes useful terms on food and nutrition that children can learn, particularly
when playing alongside parents and teachers. There are two ageappropriate
portals, for 68 years and 912 years. Cool Food Planet is currently available in
English and French, and thanks to cooperation with the Department of Food
Science and Technology at the Agricultural University of Athens, Greek will be the
next language. EUFIC welcomes proposals from other partners to expand to more
languages.
Upon entering
, children are asked by 'World Leaders'
“to go on a mission to Cool Food Planet to discover all there is to know about
tasty, healthy, fun food!” Children can download a ‘Mission Card’ that encourages them to explore five destinations, each
revealing a ‘secret food’ that further motivates their journey to learn and report back to ‘World Food Leaders’. Adults can follow
children’s progress against the learning areas. While playing Cool Food Planet online, children and adults are also encouraged
to choose activities they can engage in offline, in the classroom or at home, outside, in the playground, or at the supermarket.
Why is Cool Food Planet important?
Educating children about healthy lifestyles including safe and balanced diets as well as physical activity is one of the most
important steps towards good health and helping children to grow to their potential. For example, not getting the energy
balance right by consuming more calories than are expended can lead to excess body weight. According to the regional office
for Europe of the World Health Organization (WHO), overweight and obesity in children and young people are major risk
factors for chronic disease and are associated with an increased risk of adult obesity and premature mortality.
1
Childhood
overweight and obesity have reached epidemic proportions in most industrialised countries, with the European Association for
the Study of Obesity reporting that approximately 60% of adults and 20% of schoolage children in the EU are overweight or
obese.
2
Visit
Find out what nutritionists, parents, officials and children have to say about Cool Food Planet through the
page for adults.
References
1. WHO Europe (2009). Prevalence of overweight and obesity in children and adolescents. Fact sheet 2.3 Code:
RPG2_Hous_E2.
http://www.euro.who.int/__data/assets/pdf_file/0005/96980/2.3.Prevalenceof
overweightandobesityEDITED_layouted_V3.pdf
2. European Association for the Study of Obesity website, Quick Facts section:
http://www.easo.org/quickfacts
EUFIC’s Cool Food Planet educational website: nutrition, food safety &
physical activity for children!
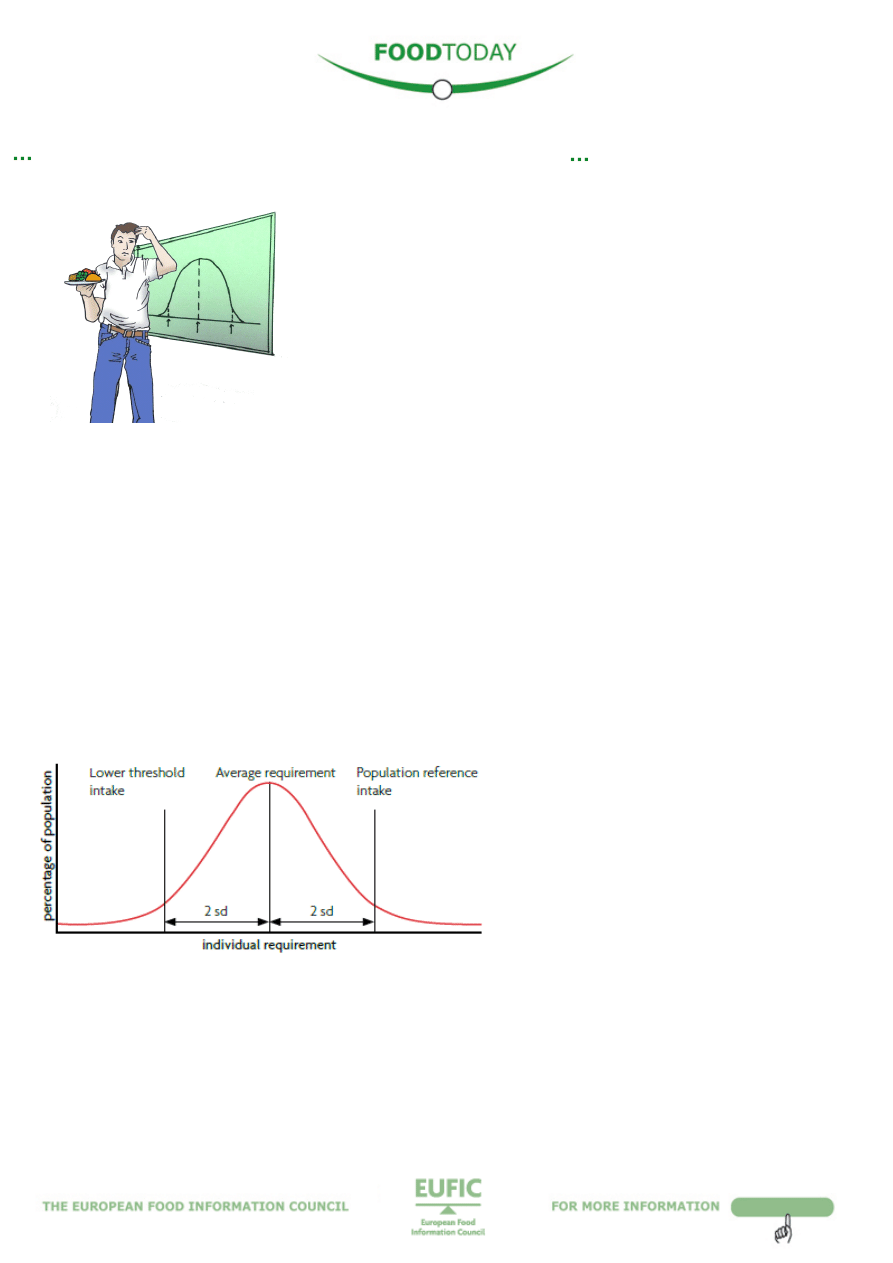
Dietary Reference Values (DRVs) are important for supporting public health,
developing labelling laws and identifying populations at risk of over or
underconsumption. However, the process of developing them is complex,
and they should not be viewed as recommendations or goals for individuals.
Rather, they require interpretation by professionals and can form the basis of
dietary advice.
Deriving DRVs
DRVs are quantitative reference values for nutritional intakes derived for different
population groups, based on health criteria. They guide professionals on the
estimated quantities of energy and nutrients needed to support adequate growth,
development and health, while reducing the risk of deficiencies and non
communicable diseases such as heart disease or cancer.
1
In defining nutrient adequacy, a range of criteria is considered. For most nutrients a
hierarchy can be established – ranging from prevention of clinical deficiency to
optimisation of body stores, or status. Depending on the criteria selected, a variety
of information sources can be used: in vitro studies, animal studies, human
experimental trials, and epidemiological surveys. Several factors are taken into account; these include age, gender, specific
needs during pregnancy and lactation, the influence of environmental stress such as infection, and bioavailability (proportion of
a nutrient absorbed and used by the body). Hence, DRVs are developed for different lifestages and gender groups, and for
different age ranges, depending on the available data. Within any population group, nutrient requirements vary between
individuals.
1
European DRVs
The European Food Safety Authority (EFSA) published updated DRVs for fats, carbohydrates (including sugars and fibre), and
water in 2010, protein in 2012, energy in 2013, while those for micronutrients are in progress.
13
EFSA also produced guiding
principles for deriving and applying DRVs, which include acceptable types of studies, methods for determining (and factors
influencing) nutrient requirements, and how diet influences chronic disease risks.
1
The EU project EURRECA (EURopean
micronutrient RECommendations Aligned) has developed a framework for deriving and applying DRVs for micronutrients.
4
Which type of DRV is set, and the criteria used, is decided on a casebycase basis for each nutrient. Within a population group
for which DRVs are derived, there remain variations between individuals and hence there is a distribution of requirements in
the population. A wide range of terminologies has been used by different national agencies. In Europe, terminology has been
harmonised and EFSA used the following set of defined DRVs.
l
Population Reference Intake: level of intake adequate for virtually all people, i.e. an optimal intake for the population as
a whole.
l
Average Requirement: level of intake adequate for half of the people, assuming a normal distribution of requirements
(see Figure 1).
l
Lower Threshold Intake: level of intake below which, on the basis of current knowledge, almost all individuals would
have an inadequate intake.
l
Adequate Intake (when evidence is insufficient to set a Population Reference Intake): the average level of a nutrient
consumed by healthy populations (i.e. assumed to be adequate).
Figure 1. Distribution of requirements of a population group assuming that the requirement is normally distributed and the
variation in requirements between individuals is known. The Population Reference Intake is two standard deviations (SD)
above the Average Requirement, and the Lower Threshold Intake is two SD below the Average Requirement.
1
Since DRVs not only aim to ensure sufficient intakes of essential nutrients, but also guard against overconsumption, the
following reference values also exist:
l
Reference intake ranges for macronutrients: expressed as a proportion of daily energy intakes, to reflect intakes that
are adequate for maintaining health and are associated with a low risk of chronic disease. For example, the reference
intake range set for dietary fat is 20–35% of total daily energy intake.
1
l
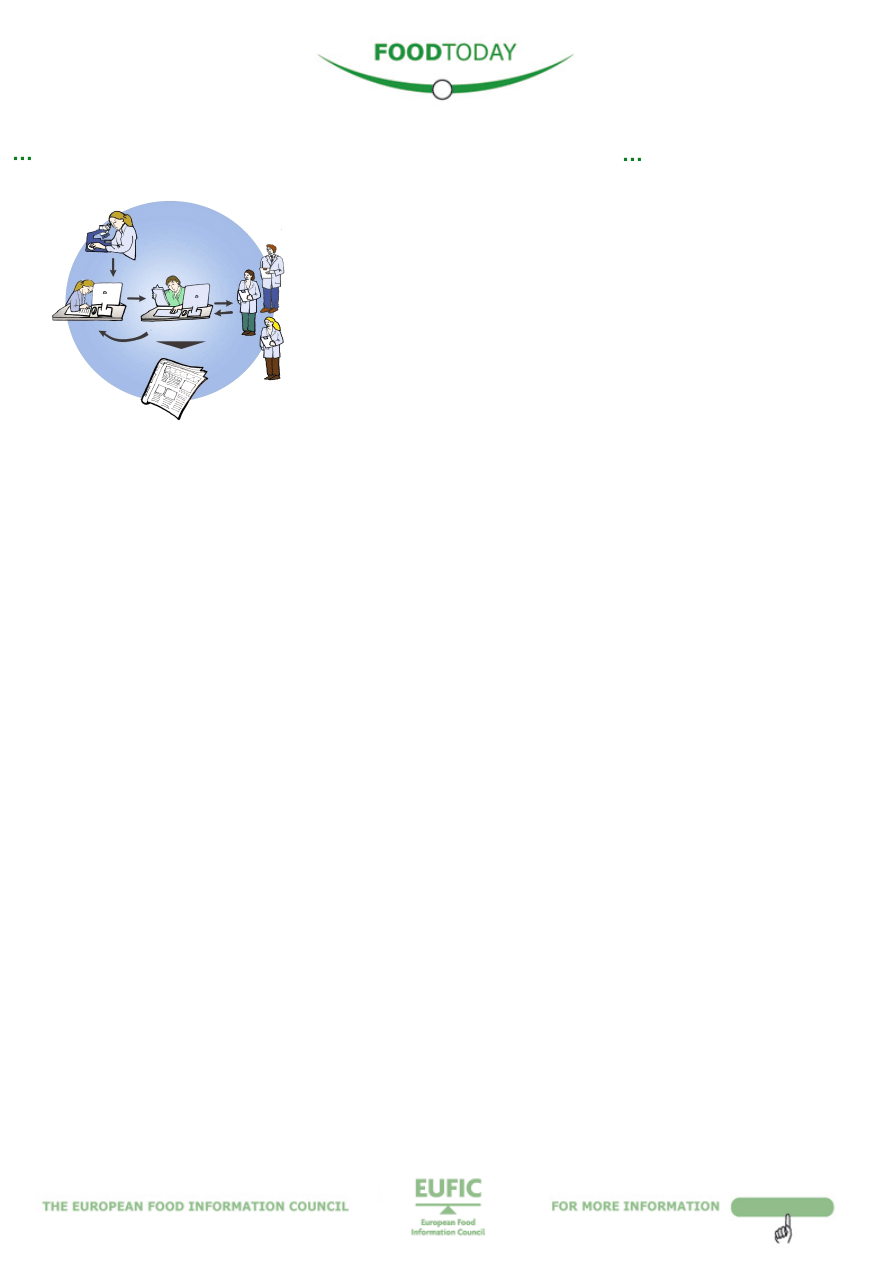
Tolerable Upper Intake Level (or Upper Level): the maximum level of chronic daily intake of nutrients unlikely to have
adverse health effects (see Figure 2).
Dietary Reference Values a reference for whom?
2
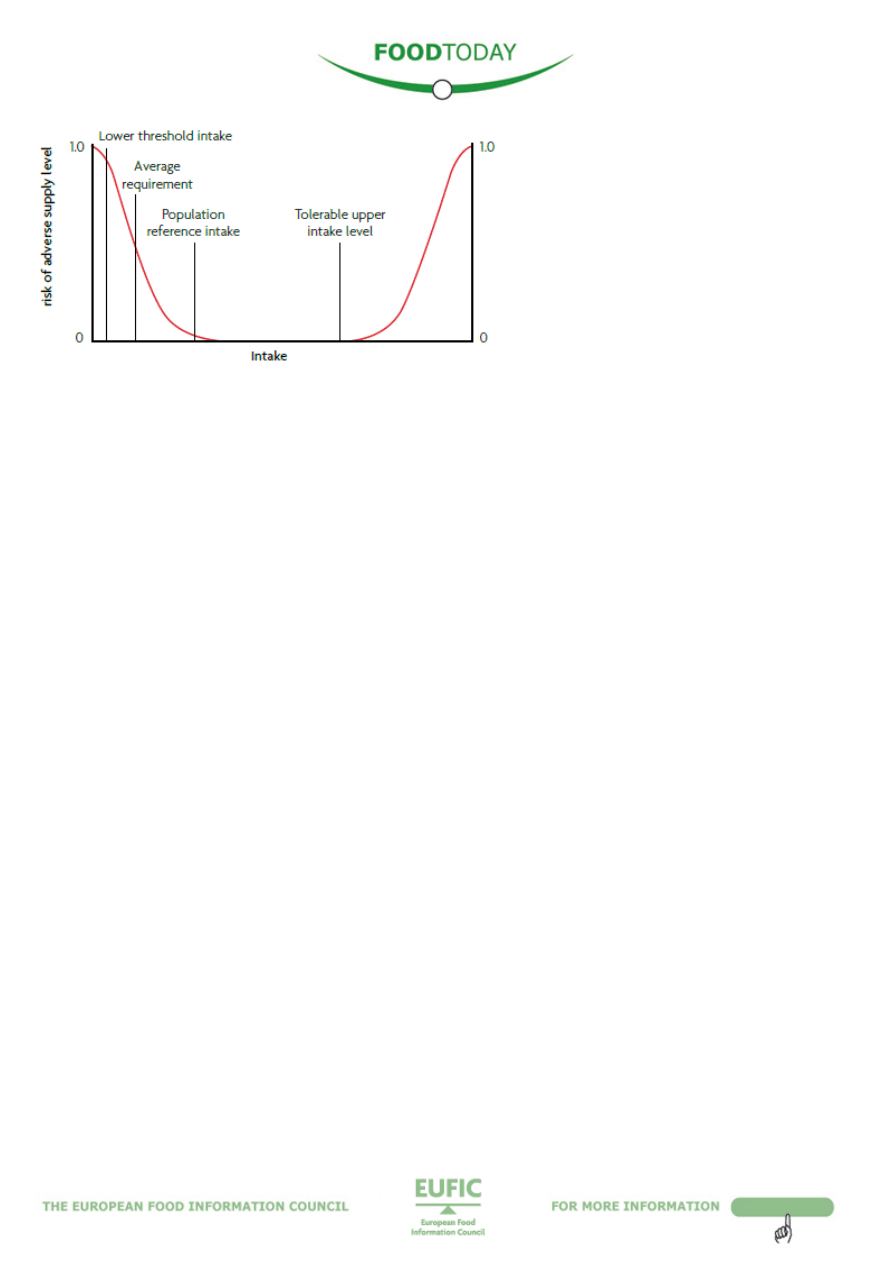
Figure 2. Relationship between individual intake and risk of adverse effects due to insufficient or excessive intake.
1
Applying DRVs
DRVs can be used in policy making, healthcare, the food industry, and academic research. They can be used for dietary
assessment, planning diets, and developing dietary recommendations for individuals or groups, and for food labelling.
Dietary assessment and planning
Dietary intakes can be estimated and assessed against DRVs to determine whether diets are at risk of inadequate, or indeed
excessive, intakes of nutrients. Dietary assessment should take into account daytoday variations in intake and likely under
reporting of food (and nutrients) to accurately reflect habitual intakes. Dietary planning aims to determine diets that have a low
probability of nutrient inadequacy or excess.
1
Individuals with habitual intakes which fall below the Average Requirement are likely to have inadequate diets, and those with
intakes below the Lower Threshold Intake have diets that are very probably inadequate. In contrast, chronic intakes above the
Upper Level may be associated with an increased risk of adverse effects. However, there are inherent problems with assessing
the usual dietary intakes of individuals due to the limitations in methods such as food diaries and questionnaires. A valid
assessment of an individual’s diet should take into account individual variations in nutrient requirements, using anthropometric,
biochemical (status) and clinical data, and physical activity levels.
1
In groups of people, the distribution of nutrient intakes among the population is considered more important than a fixed
recommended intake level. Dietary intakes of groups are obtained from food consumption surveys. The percentage of people
with intakes below an Average Requirement (AR cutpoint method) is the estimated proportion of a group likely to have
inadequate intakes. This method is appropriate if the distribution of nutrient intakes is normal (as exemplified by the bell
shaped curve in Figure 1). Iron is an example of a nutrient showing a skewed distribution of individual requirements within a
population; the cutpoint method would underestimate the prevalence of inadequate intakes of iron in menstruating women.
1
Alternatively, statistical methods exist (e.g. the probability approach or Monte Carlo simulation) which take into account the
variability of intakes and requirements. The Population Reference Intake should not be used as a cutpoint, as this would
overestimate the proportion of people at risk of inadequate intakes. A mean intake at or above an Adequate Intake implies a
low prevalence of inadequate intakes. If an individual’s intake falls below the Adequate Intake, however, the probability of
nutrient inadequacy cannot be estimated.
1
In dietary planning for individuals or groups, the Population Reference Intake (or Adequate Intake) can be used as a goal for
adequate intakes of vitamins, minerals or protein. Median intakes of a group may be higher than the Population Reference
Intake (particularly if the intake distribution is skewed).
1
The DRVs for energy are given as Average Requirements of specified age and sex groups. Since energy requirements vary
widely, DRVs are of limited use for individuals. The appropriate Average Requirement for energy (based on sex, age, height,
weight and physical activity level) may be used as a planning goal, but will exceed the needs of half the individuals of a defined
group. This may result in a positive energy balance for these individuals, which in the longterm would increase body weight.
Body weight history is a useful indicator of whether usual intake has matched energy needs, and body weight should be
monitored and intake adjusted as appropriate.
1
Dietary goals and recommendations
Dietary goals and recommendations consider health needs, nutritional status and consumption patterns, and the composition of
available foods. Targets for nutrient intakes at population level may be set for public health planning and assessment. An
example of a nutrient goal might be a population average fat intake of 30% energy, i.e. relative to mean total daily energy
intake, 30% of the energy comes from fat. Nutrient recommendations are typically targets for the nutrient intakes of
individuals, for example ≤10% energy for saturated fatty acids. These may not always be communicated directly to the
consumer, but rather are for use by healthcare professionals and policymakers. EFSA has published guidance on how DRVs
could be used to create foodbased dietary guidelines (FBDGs), which are more easily understood by consumers than
numerical targets.
5
At national level, recommendations consider the dietary habits and needs of diverse groups. Twentyfive
Member States are already using FBDGs, the most common types being food plates, pyramids or circles.
6
Food labelling
DRVs also form the basis of nutrition labelling on foods, beverages and dietary supplements. The new regulation on food
information to consumers makes it mandatory that food labels provide information on energy, total fat, saturated fat,
carbohydrate, sugars, protein and salt per 100 g, or 100 ml if a liquid. Per portion information may also be given. In addition to
absolute values, nutritional content may be expressed as a percentage of the reference intake (RI) of an average adult
(commonly known as Guideline Daily Amounts, GDAs), in relation to per 100 g/ml or a typical portion size. These RIs are
consistent with dietary advice for the general population and have been set for labelling purposes, based on a 2000 kcal (8400
kJ) diet: 70 g fat (31.5% energy), 20 g saturated fat (9% energy), 260 g carbohydrate (52% energy), 90 g sugars (18%
3

energy), 50 g protein and 6 g salt.
7,8
For example, the nutrition label on a yoghurt may state 2.8 g fat per 100 g, 4% of the RI.
On food labels this information will be accompanied by the phrase “Reference intake of an average adult (8400 kJ/2000 kcal)”.
In addition, vitamins and minerals may be labelled if present in significant amounts, in which case their content must also be
expressed as a percentage of reference values.
8
EFSA have not yet published updated DRVs for micronutrients, but these have
been set for labelling purposes.
DRV misapplication
DRVs can be used inappropriately. For example, it does not make sense to criticise individual foods or beverages because they
fail to meet DRVs for fat, salt or sugars. Actually DRVs are expressed on a daily basis, and are applied to the whole diet, over
longer periods of time.
Furthermore, reference values should not be misinterpreted as nutritional advice to individuals. DRVs act as points of reference
for professionals, who use DRVs when developing policy and recommendations to consumers. They are estimates (not exact
values), and are intended for healthy people; they cannot be applied to patients without caution.
1
The role of health
professionals, particularly dietitians, is important for tailoring DRVs to individual needs.
Consumers should aim to follow FBDG in the long term through a balanced and varied diet. Reference intakes on food labels
are not targets. Percentages of reference intakes aim to help consumers to estimate the relative contribution of individual
products to daily dietary intake, and provide one way of comparing the nutritional content of products.
Further information
EURRECA website:
References
1. EFSA (2010). Scientific Opinion on principles for deriving and applying Dietary Reference Values. EFSA Journal 8
http://www.efsa.europa.eu/en/efsajournal/doc/1458.pdf
2. Food Today 5/2011. New nutrition guidelines for Europe, halfway there:
/article/en/nutrition/understanding
food/artid/NewnutritionguidelinesEuropehalfwaythere/
3. EFSA (2013). Scientific Opinion on Dietary Reference Values for energy. EFSA Journal 11(1):3005.
http://www.efsa.europa.eu/en/efsajournal/doc/3005.pdf
4. EU project EURRECA,
5. EFSA (2010). Scientific Opinion on establishing FoodBased Dietary Guidelines. EFSA Journal 8(3):1460.
http://www.efsa.europa.eu/en/efsajournal/doc/1460.pdf
6. EUFIC Review (2009). FoodBased Dietary Guidelines in Europe:
/article/en/expid/foodbaseddietary
7. EFSA (2009). Scientific Opinion of the Panel on Dietetic Products, Nutrition and Allergies on a request from the
Commission related to the review of labelling reference intake values for selected nutritional elements. EFSA Journal
1008:114.
http://www.efsa.europa.eu/en/efsajournal/doc/1008.pdf
8. Regulation (EU) No 1169/2011 of the European Parliament and of the Council of 25 October 2011 on the provision of
food information to consumers:
http://eurlex.europa.eu/LexUriServ/LexUriServ.do?
uri=OJ:L:2011:304:0018:0063:EN:PDF
4
Have you ever wondered how the work of scientists is checked? When a new
finding is published, how do we know it is sound?
Before a scientific assertion is made public it should be scrutinised for its credibility.
Has the scientist drawn justifiable conclusions, based on the data available from sound
scientific research?
The peer review process is a form of scientific quality control, where scientists open
their research to the scrutiny of other experts in the field (peers).
1
By reviewing and
criticising each others’ work, scientists aim to ensure that only original and sound
research is published and recognised.
How does it work?
When research is submitted for publication in a peerreviewed journal, the journal
invites several (usually two or more) independent experts to assess the credibility of
the research.
1
These experts consider the scientific methods, results and conclusions
presented by the authors, asking themselves, if the science is technically sound, if the
interpretation is consistent with the data, and if it is new, important or ground
breaking.
2
Reviewers usually remain anonymous, are not paid for their assessment, and should not have any conflicts of interest in
relation to the research. If a paper does not meet the requirements, based on the peer reviews, the editor can either reject it
or deem it acceptable subject to adequate changes, allowing authors to react and revise their paper.
Why is it important?
The peer review process checks that a paper explains clearly how the research was carried out, so that it can be reproduced
by others. It also verifies that the methodology is appropriate for the specific field and set of objectives. Another crucial part of
the review process is assessing the originality of new research and the accurate referencing of related published research,
particularly if these contrast with the research at hand. The review is also useful for those whose work is being scrutinised; it
allows them to finetune their manuscript before public release.
2
A manuscript is seldom accepted for publication without at
least a minor revision.
The review process essentially strives to separate fact from speculation and personal opinion.
2
Peerreviewed research is
never beyond criticism however, and any conclusions drawn must be considered in the context of other studies. Ideally,
experiments should be repeated to assess whether results can be reproduced; this is how findings are truly substantiated. The
real validation, therefore, comes after publication.
Nonpeerreviewed research
Unfortunately, research results often find their way into the public domain without being peer reviewed, and are spread via
newspapers, magazines, the internet, television and radio. They may be unpublished findings presented at press conferences,
or published findings from a journal that does not use peer review. Even journals that do use peer review contain some non
peerreviewed content, such as editorials and letters to the editor. Both scientists and journalists should understand the
meaning and importance of peer review and clarify whether or not research they discuss has been peerreviewed. There are
potentially enormous costs to both science and society from the promotion of scientifically weak or flawed research findings.
An imperfect process
The peer review process does not protect against misconduct. It can identify mistakes, but relies on honesty and, as a result,
can fail to recognise deliberately fraudulent research. Various organisations have produced integrity guidelines on good
research practice aiming to reduce such occurrences.
3
On the other side, financial or personal concerns may bias a reviewer’s
professional judgement and objectivity. It is vital to consider in advance any factors, which could lead to bias.
3
According to
the European Science Foundation, preventing and managing such conflicts of interest is crucial in ensuring equity and
integrity.
3
Sometimes concerns are raised about the influence of the funding body on the design of the study, or the interpretation or
reporting of the research outcomes. The peer review process gives credence to research, because the paper has been
independently checked and critically evaluated, including the correct scientific interpretation of the results on the basis of other
existing evidence – no matter who funded the research.
2
Inevitably, there are variations in standards between journals. A journal’s “Impact Factor” reflects how often its papers are
cited in other peerreviewed journals, and gives some indication of importance of the journal in its field – the higher the
number, the greater the impact or influence.
The process and culture of checking each other’s work is ongoing in the scientific world. Once a paper has been published,
further criticism can be made by the scientific community via letters to the journal editor, discussions at conferences, or direct
exchange with the research team behind the study in question. Authors can justify their findings and flaws uncovered can be
corrected or retracted.
1,2
This is the nature of science; all work is open to critique by other scientists.
References
1. Science Media Centre (2012). Peer review in a nutshell:
http://www.sciencemediacentre.org/wp
content/uploads/2012/09/PeerReviewinaNutshell.pdf
2. Sense About Science (2004). Peer Review and the acceptance of new scientific ideas. London: Sense About Science.
http://www.senseaboutscience.org/data/files/resources/17/peerReview.pdf
3. European Science Foundation (2011). European peer review guide integrating policies and practices into coherent
procedures. Strasbourg: European Science Foundation.
http://www.vr.se/download/18.2ab49299132224ae10680001647/European+Peer+Review+Guide.pdf
In search of quality: the scientific peer review process
5
Wyszukiwarka
Podobne podstrony:
FOOD TODAY #62 EUFIC
FOOD TODAY #77 EUFIC
FOOD TODAY #71 EUFIC
FOOD TODAY #90 EUFIC
FOOD TODAY #64 EUFIC
FOOD TODAY #66 EUFIC
FOOD TODAY #75 EUFIC
FOOD TODAY #80 EUFIC
FOOD TODAY #73 EUFIC
FOOD TODAY #91 EUFIC
FOOD TODAY #83 EUFIC
FOOD TODAY #69 EUFIC
FOOD TODAY #70 EUFIC
FOOD TODAY #74 EUFIC
FOOD TODAY #56 EUFIC
FOOD TODAY #84 EUFIC
FOOD TODAY #67 EUFIC
FOOD TODAY #63 EUFIC
FOOD TODAY #79 EUFIC
więcej podobnych podstron